. 2023 Apr;53(6):2619-2633.
doi: 10.1017/S0033291721004554. Epub 2022 Apr 5.

Mapping anorexia nervosa genes to clinical phenotypes

Affiliations

Mapping anorexia nervosa genes to clinical phenotypes

Jessica S Johnson et al. Psychol Med. 2023 Apr.

Abstract

Background: Anorexia nervosa (AN) is a psychiatric disorder with complex etiology, with a significant portion of disease risk imparted by genetics. Traditional genome-wide association studies (GWAS) produce principal evidence for the association of genetic variants with disease. Transcriptomic imputation (TI) allows for the translation of those variants into regulatory mechanisms, which can then be used to assess the functional outcome of genetically regulated gene expression (GReX) in a broader setting through the use of phenome-wide association studies (pheWASs) in large and diverse clinical biobank populations with electronic health record phenotypes.

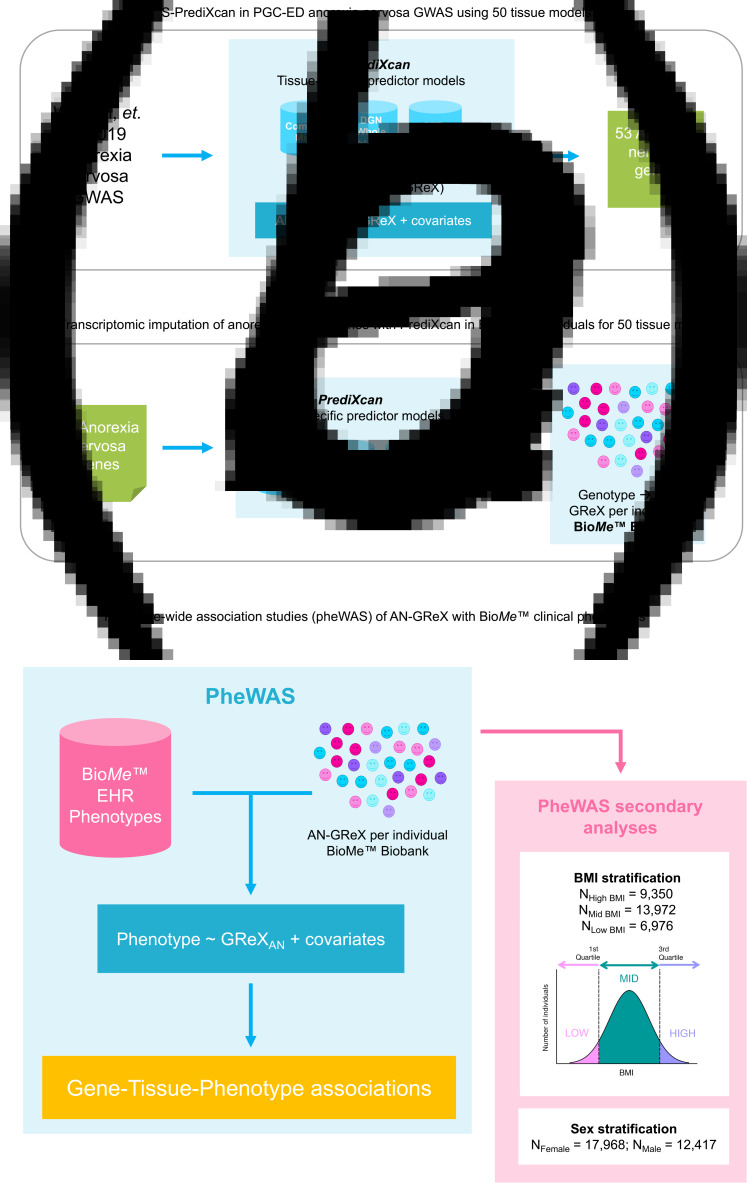
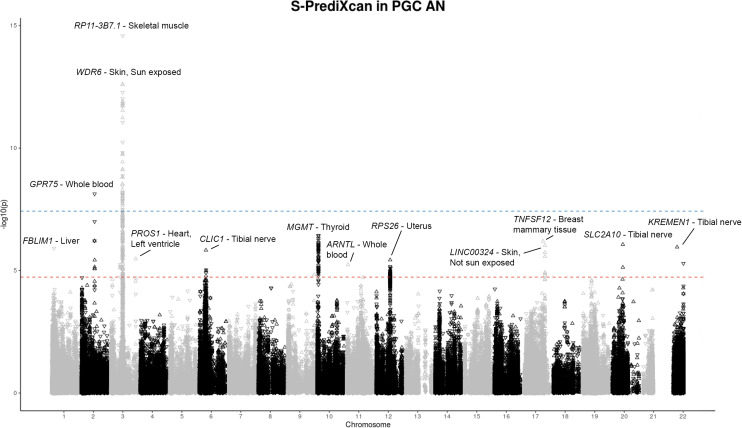
Methods: Here, we applied TI using S-PrediXcan to translate the most recent PGC-ED AN GWAS findings into AN-GReX. For significant genes, we imputed AN-GReX in the Mount Sinai BioMe™ Biobank and performed pheWASs on over 2000 outcomes to test the clinical consequences of aberrant expression of these genes. We performed a secondary analysis to assess the impact of body mass index (BMI) and sex on AN-GReX clinical associations.

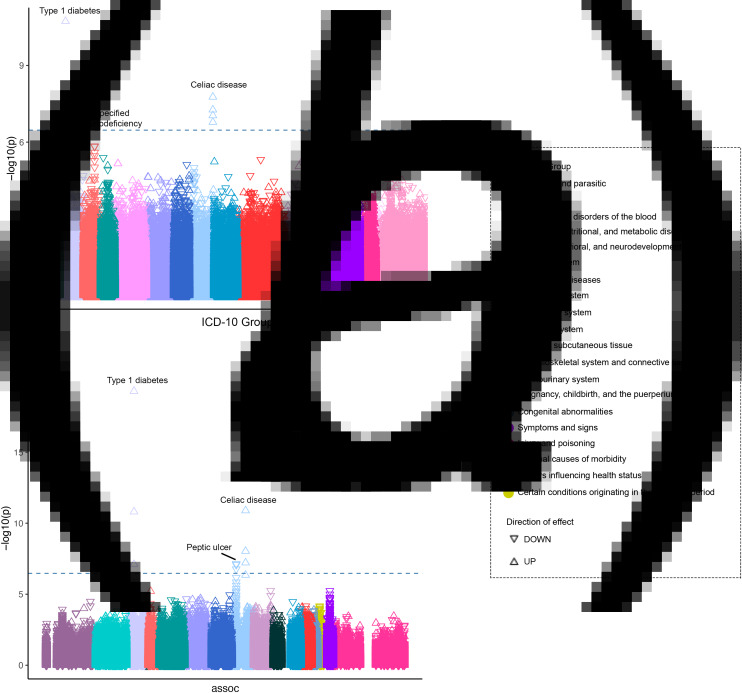
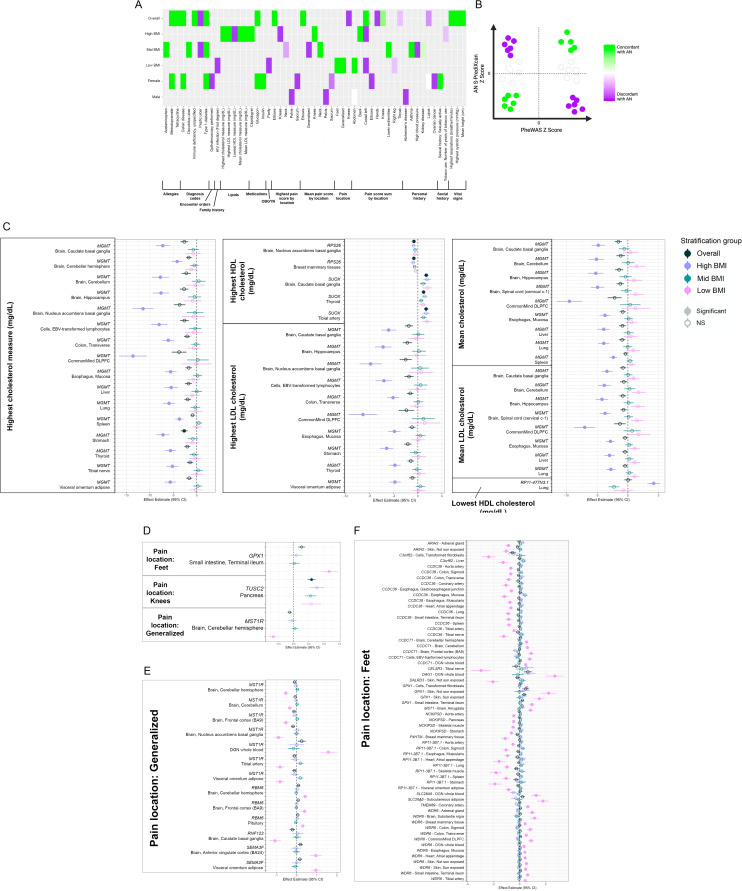
Results: Our S-PrediXcan analysis identified 53 genes associated with AN, including what is, to our knowledge, the first-genetic association of AN with the major histocompatibility complex. AN-GReX was associated with autoimmune, metabolic, and gastrointestinal diagnoses in our biobank cohort, as well as measures of cholesterol, medications, substance use, and pain. Additionally, our analyses showed moderation of AN-GReX associations with measures of cholesterol and substance use by BMI, and moderation of AN-GReX associations with celiac disease by sex.

Conclusions: Our BMI-stratified results provide potential avenues of functional mechanism for AN-genes to investigate further.

Keywords: Anorexia nervosa; EHR; PrediXcan; pheWAS; transcriptomic imputation.


Conflict of interest statement

CMB reports: Shire (grant recipient, Scientific Advisory Board member); Idorsia (consultant); Pearson (author, royalty recipient); Equip Health Inc. (clinical advisory board). ML declares that over the past 36 months, he has received lecture honoraria from Lundbeck Pharmaceutical (no other equity ownership, profit-sharing agreements, royalties, or patent). The remaining authors declare no competing interests.

Figures

Fig. 1.
Fig. 1.
Graphical depiction of S-PrediXcan and PrediXcan TI and pheWAS analyses. (a) We used S-PrediXcan predictor models for 50 different tissue types to impute GReX in Watson et al. (2019) AN GWAS and found 53 genes whose GReX was associated with AN. We then (b) imputed GReX for those 53 AN-genes in our BioMe™ cohort and (c) performed a pheWAS across available EHR phenotypes. The pheWAS analyses were run within each ancestral population and then meta-analyzed using an inverse-variance approach in METAL. Secondary analyses included stratifying individuals in BioMe™ by BMI and sex, and running the pheWAS analyses within each stratification group.
Fig. 2.
Fig. 2.
S-PrediXcan results for PGC-ED AN GWAS (2019) (NCases = 16 992, NControls = 55 525). S-PrediXcan TI of the PGC-ED AN GWAS summary statistics to determine GReX, with tests for association of GReX with AN disease status. Manhattan plot of S-PrediXcan gene–tissue associations with AN for 50 tissues. Each point represents a different gene–tissue association result; i.e. the same gene may have multiple points within a peak. Experiment-wide significance threshold of p < 3.75 × 108 (solid line); tissue-specific significance threshold of p < 2.45 × 105 (dotted line).
Fig. 3.
Fig. 3.
AN-GReX associations with BioMe™ Diagnosis codes. GReX-Tissue-Phenotype associations for (a) encounter diagnosis ICD-10 codes (N = 2178) and (b) phecodes (N = 1093) for the BioMe™ cohort (N = 30 585). Diagnosis codes are plotted along the x-axis and grouped by category, with the −log(10) p value associations along the y-axis. FDR-significant diagnosis codes are labeled (FDR-adjusted p < 0.05). FDR-significant p value threshold p = 3.4 × 107 (blue dashed line).
Fig. 4.
Fig. 4.
Context-specific pheWAS associations. (a) Concordance of context-specific experiment-wide significant AN-GReX clinical associations with AN direction of effect. We compared the direction of effect (DoE) for each experiment-wide gene–tissue-pheWAS association with the DoE of that gene–tissue pair for AN from our S-PrediXcan results (online Supplemental Methods). For those phenotypes concordant with AN, this may indicate that genetic regulation of those AN-genes is more similar to individuals with AN in individuals with those clinical outcomes. (b) Schematic of the proportion of concordance of AN-GReX pheWAS associations with AN S-PrediXcan associations. Associations with similar direction of effect to AN (green) identified as ‘concordant’, associations with opposite direction of effect (purple) identified as ‘discordant’. (c) Context-specific associations of AN-GReX with lipid phenotypes of highest recorded, lowest recorded, and mean measures of total cholesterol (mg/dl), HDL cholesterol (mg/dl), and LDL cholesterol (mg/dl). Experiment-wide significant threshold set at p = 0.05(9 phenotypes × 45 tissues) = 1.2 × 10−4. Tissue-specific threshold set at 0.05/(9 phenotypes) = 0.0056. Context-specific associations of AN-GReX with pain location for (d) experiment-wide significant associations (p = 0.05/(99 phenotypes × 45 tissues) = 1.1 × 10−5), (e) all context-specific associations (experiment-wide and tissue-specific) with generalized pain, and (f) with foot pain. Tissue-specific threshold for pain location set at 0.05/(99 phenotypes) = 5.0 × 10−4.

References

    1. Achamrah, N., Coëffier, M., & Déchelotte, P. (2016). Physical activity in patients with anorexia nervosa. Nutrition Reviews, 74(5), 301–311. 10.1093/nutrit/nuw001. - DOI - PubMed
    1. Adams, D. M., Reay, W. R., Geaghan, M. P., & Cairns, M. J. (2021). Investigation of glycaemic traits in psychiatric disorders using Mendelian randomisation revealed a causal relationship with anorexia nervosa. Neuropsychopharmacology, 46(6), 1093–1102. 10.1038/s41386-020-00847-w. - DOI - PMC - PubMed
    1. Akbari, P., Gilani, A., Sosina, O., Kosmicki, J. A., Khrimian, L., Fang, Y.-Y., … Lotta, L. A. (2021). Sequencing of 640 000 exomes identifies GPR75 variants associated with protection from obesity. Science, 373(6550), eabf8683. 10.1126/science.abf8683. - DOI - PMC - PubMed
    1. Allison, K. C., Spaeth, A., & Hopkins, C. M. (2016). Sleep and eating disorders. Current Psychiatry Reports, 18(10), 92. 10.1007/s11920-016-0728-8. - DOI - PubMed
    1. Alloy, L. B., Ng, T. H., Titone, M. K., & Boland, E. M. (2017). Circadian rhythm dysregulation in bipolar Spectrum disorders. Current Psychiatry Reports, 19(4), 21. 10.1007/s11920-017-0772-z. - DOI - PMC - PubMed

Publication types