. 2022 Apr 15;208(8):1968-1977.
doi: 10.4049/jimmunol.2101099. Epub 2022 Apr 4.

Characterization of Altered Gene Expression and Histone Methylation in Peripheral Blood Mononuclear Cells Regulating Inflammation in COVID-19 Patients

Affiliations

Characterization of Altered Gene Expression and Histone Methylation in Peripheral Blood Mononuclear Cells Regulating Inflammation in COVID-19 Patients

Xiaoming Yang et al. J Immunol. .

Abstract

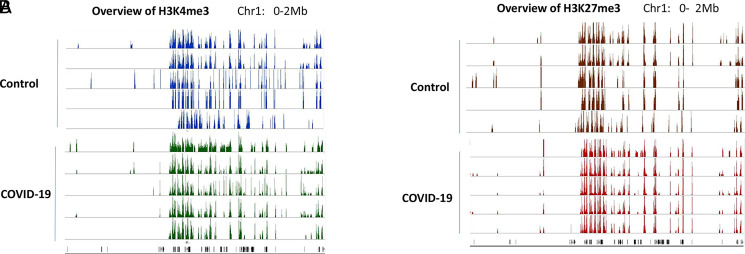
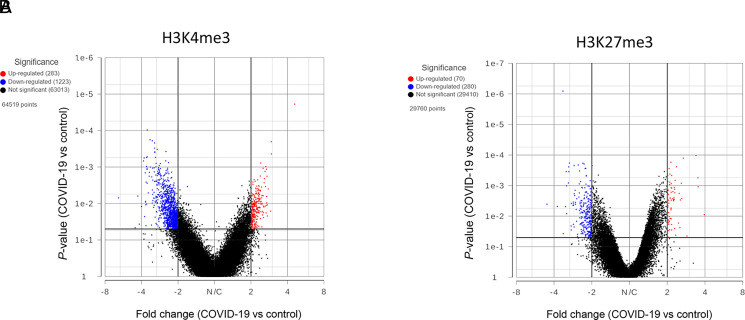
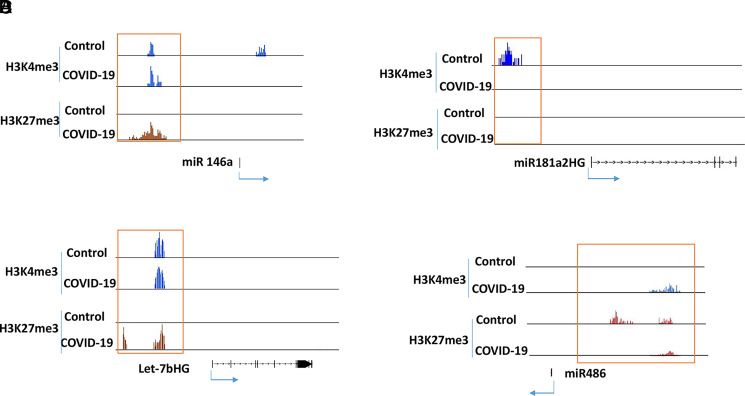
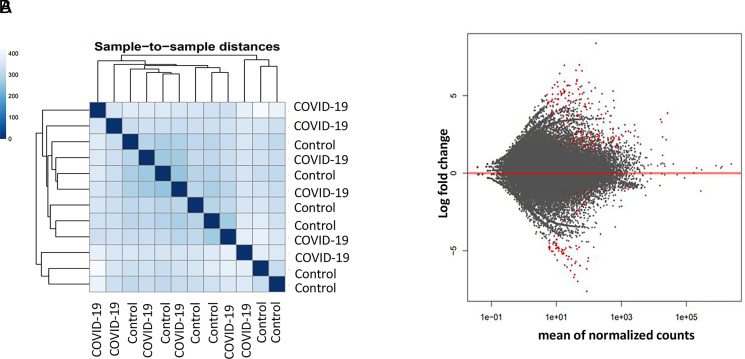
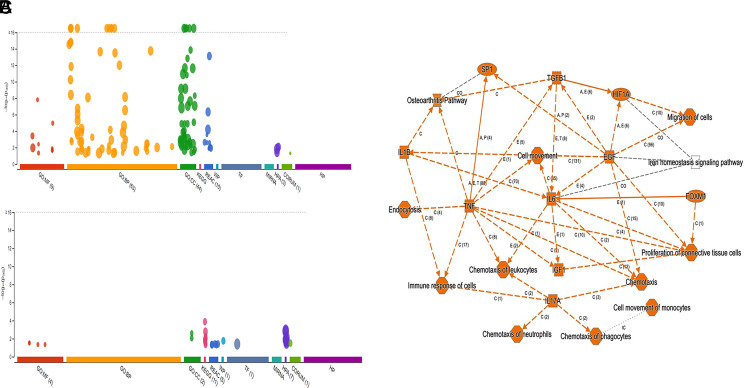
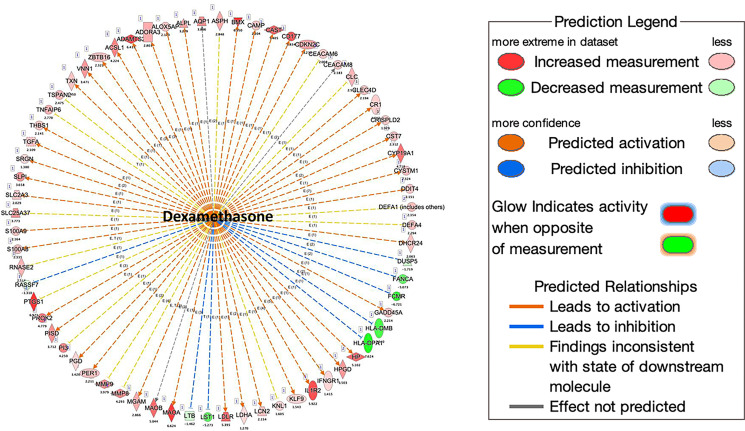
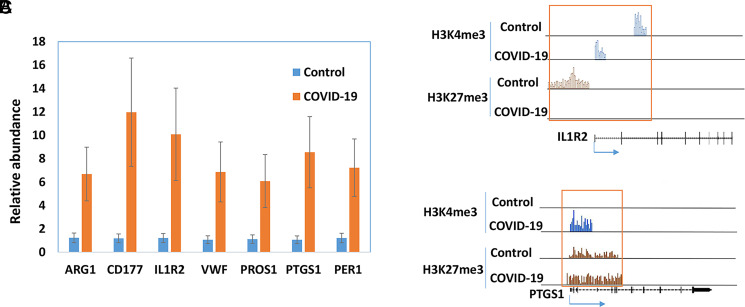
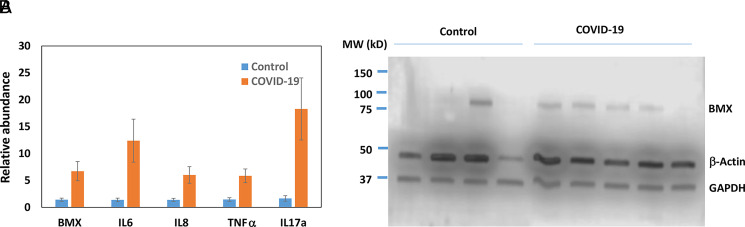
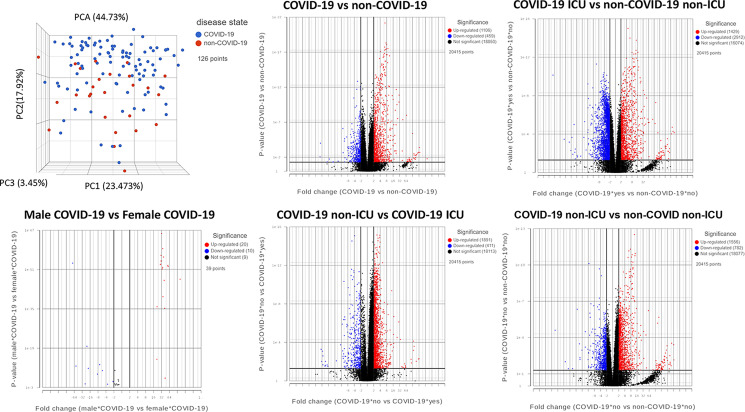
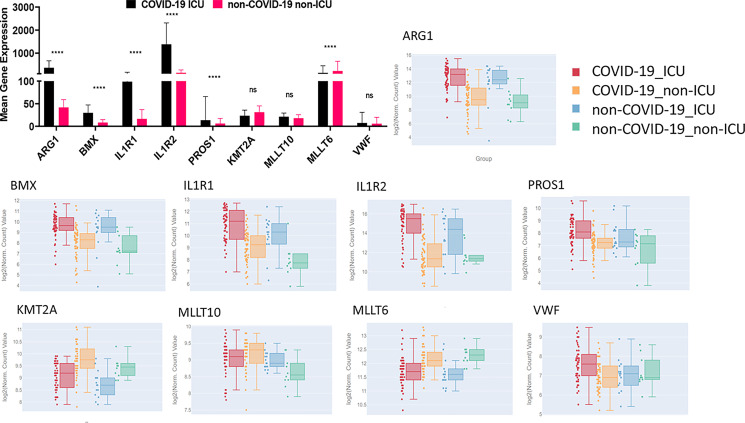
The pandemic of COVID-19 has caused >5 million deaths in the world. One of the leading causes of the severe form of COVID-19 is the production of massive amounts of proinflammatory cytokines. Epigenetic mechanisms, such as histone/DNA methylation, miRNA, and long noncoding RNA, are known to play important roles in the regulation of inflammation. In this study, we investigated if hospitalized COVID-19 patients exhibit alterations in epigenetic pathways in their PBMCs. We also compared gene expression profiles between healthy controls and COVID-19 patients. Despite individual variations, the expressions of many inflammation-related genes, such as arginase 1 and IL-1 receptor 2, were significantly upregulated in COVID-19 patients. We also found the expressions of coagulation-related genes Von Willebrand factor and protein S were altered in COVID-19 patients. The expression patterns of some genes, such as IL-1 receptor 2, correlated with their histone methylation marks. Pathway analysis indicated that most of those dysregulated genes were in the TGF-β, IL-1b, IL-6, and IL-17 pathways. A targeting pathway revealed that the majority of those altered genes were targets of dexamethasone, which is an approved drug for COVID-19 treatment. We also found that the expression of bone marrow kinase on chromosome X, a member of TEC family kinases, was increased in the PBMCs of COVID-19 patients. Interestingly, some inhibitors of TEC family kinases have been used to treat COVID-19. Overall, this study provides important information toward identifying potential biomarkers and therapeutic targets for COVID-19 disease.


Conflict of interest statement

The authors have no financial conflicts of interest.

Figures

FIGURE 1.
FIGURE 1.
Histone methylation profile in PBMCs. H3K4me3 (A) and H3K27me3 (B) in PBMCs from five controls and five COVID-19 patients were examined by ChIP-seq. The methylation marks in the region of Chr:1 0–2 Mb were visualized in IGB genome browser and presented as examples of global histone methylation profile.
FIGURE 2.
FIGURE 2.
Genes with altered histone marks. H3K4me3 (A) and H3K27me3 (B) signals within 5 kb upstream and downstream of TSS in PBMCs of five controls and five COVID-19 patients were quantified by Partek software using normalized sequencing counts. Red dots represent the genes with significantly increased histone mark in the COVID-19 samples, whereas blue dots are genes with reduced mark.
FIGURE 3.
FIGURE 3.
Histone methylation in selected miRNAs. ChIP-seq results from five controls and five COVID-19 patients were combined into two groups (control and COVID-19) for analysis. Histone marks in miR-146a (A), miR181a2HG (B), Let-7bHG (C) and miR-486 (D) were visualized in IGB genome browser.
FIGURE 4.
FIGURE 4.
Gene expression profile in PBMCs of control and COVID-19 patients. Gene expressions in six controls and six COVID-19 patients were determined by RNA-seq. The results were analyzed by DESeq2 software. (A) Sample-to-sample distance was determined by comparing overall gene expression profile. (B) Red dots are genes with significant difference in expression level between in the control and patient group. Adjusted p value <0.05 was considered significant.
FIGURE 5.
FIGURE 5.
Functional enrichment analysis of significantly altered genes in COVID-19 patients. Enrichment analysis of upregulated genes (A) and downregulated genes (B) in PBMCs of a COVID-19 patient was performed using g:GOSt functional profiling in g:Profiler. Pathway enrichment of both upregulated and downregulated genes was performed using Qiagen Ingenuity Pathway Analysis (C).
FIGURE 6.
FIGURE 6.
Downstream analysis of altered genes in COVID-19 patients. The downstream analysis was performed using Qiagen Ingenuity Pathway Analysis. More than one third of upregulated genes are downstream targets of dexamethasone.
FIGURE 7.
FIGURE 7.
Expressions of selected genes in PBMCs of COVID-19 patients. The expressions of selected genes were quantified by real-time RT-PCR in PBMCs of healthy controls and patients with COVID-19 (n = 5). (A) The average amount in the controls was set as 1, and the error bars show SEM. The histone marks in IL-1R2 (B) and PG-endoperoxide synthase 1 (PTGS1) (C) were obtained from ChIP-seq data.
FIGURE 8.
FIGURE 8.
Expression of BMX in PBMCs. (A) The expression of BMX and its downstream genes in the control and COVID-19 samples (n = 5) was quantified by real-time RT-PCR. The average amount in the control was set as 1, and the error bars represent SEM. (B) The protein levels of BMX in PBMCs were determined by Western blotting.
FIGURE 9.
FIGURE 9.
Meta-analysis of COVID-19 and non–COVID-19 patients. PCA of patient samples grouped by disease, COVID-19 (blue) and non–COVID-19 (red). Groups include COVID-19–positive (COVID-19), COVID-19–negative (non–COVID-19), males positive for COVID-19 (Male COVID-19), females positive for COVID-19 (Female COVID-19), COVID-19 patients admitted to the ICU (COVID-19 ICU), COVID-19 patients not admitted to the ICU (COVID-19 non-ICU), non–COVID-19 patients admitted to the ICU (non–COVID-19 ICU), and non–COVID-19 patients not admitted to the ICU (non–COVID-19 non-ICU). Volcano plots of differential gene expression analysis filtered by significance of FDR ≤0.05 for the comparisons shown, where upregulated genes are shown in red, downregulated genes in blue, and not significant genes in black.
FIGURE 10.
FIGURE 10.
Expression of select genes in plasma and leukocytes of COVID-19 patients. Mean gene expression of specific genes of interest in COVID-19 ICU patients (black) and non–COVID-19 non-ICU patients (pink) (top left). Significance represents p values calculated by differential gene analysis (GSA). The Web site–based tool provided [Overmyer et al. (18)] was used to generate the figures representing gene expression trends across all the groups, where COVID-19 ICU is red, COVID-19 non-ICU is yellow, non–COVID-19 ICU is blue, and non–COVID-19 non-ICU is green. Error bars represent SEM.

Similar articles

Cited by

References

    1. Zhou F., Yu T., Du R., Fan G., Liu Y., Liu Z., Xiang J., Wang Y., Song B., Gu X., et al. 2020. Clinical course and risk factors for mortality of adult inpatients with COVID-19 in Wuhan, China: a retrospective cohort study. Lancet 395: 1054–1062. - PMC - PubMed
    1. Chen G., Wu D., Guo W., Cao Y., Huang D., Wang H., Wang T., Zhang X., Chen H., Yu H., et al. 2020. Clinical and immunological features of severe and moderate coronavirus disease 2019. J. Clin. Invest. 130: 2620–2629. - PMC - PubMed
    1. Pedersen S. F., Ho Y. C.. 2020. SARS-CoV-2: a storm is raging. J. Clin. Invest. 130: 2202–2205. - PMC - PubMed
    1. Choudhary S., Sharma K., Silakari O.. 2021. The interplay between inflammatory pathways and COVID-19: a critical review on pathogenesis and therapeutic options. Microb. Pathog. 150: 104673. - PMC - PubMed
    1. Tan L. Y., Komarasamy T. V., Rmt Balasubramaniam V.. 2021. Hyperinflammatory immune response and COVID-19: a double edged sword. Front. Immunol. 12: 742941. - PMC - PubMed