. 2022 Apr 4;13(1):1804.
doi: 10.1038/s41467-022-29412-3.

Loss of Rnf31 and Vps4b sensitizes pancreatic cancer to T cell-mediated killing

Affiliations

Loss of Rnf31 and Vps4b sensitizes pancreatic cancer to T cell-mediated killing

Nina Frey et al. Nat Commun. .

Abstract

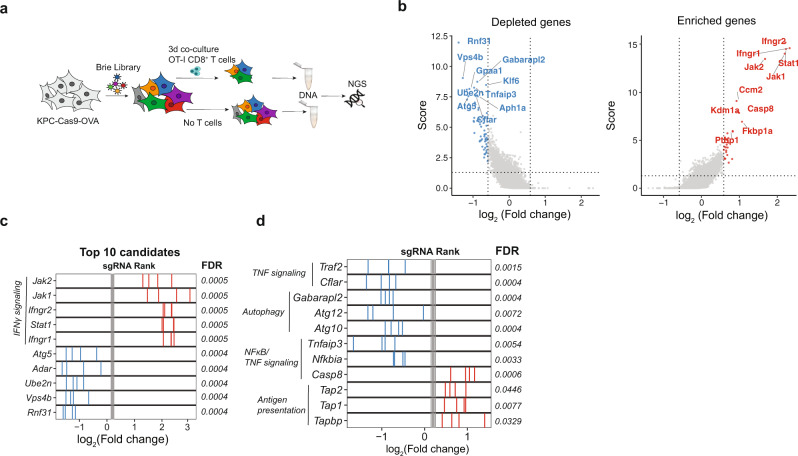
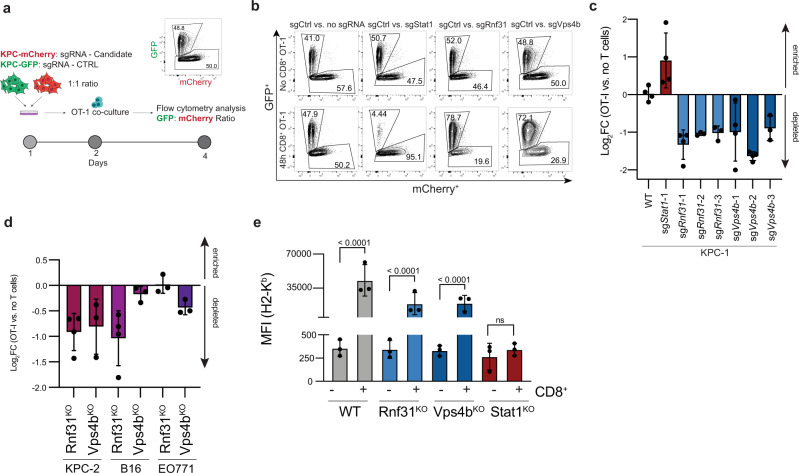
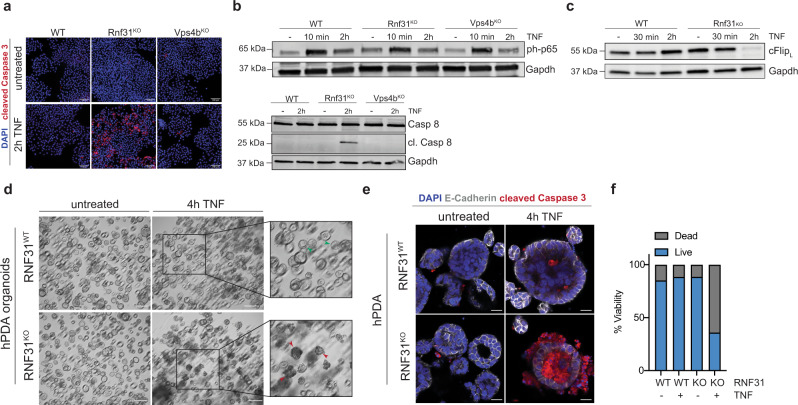
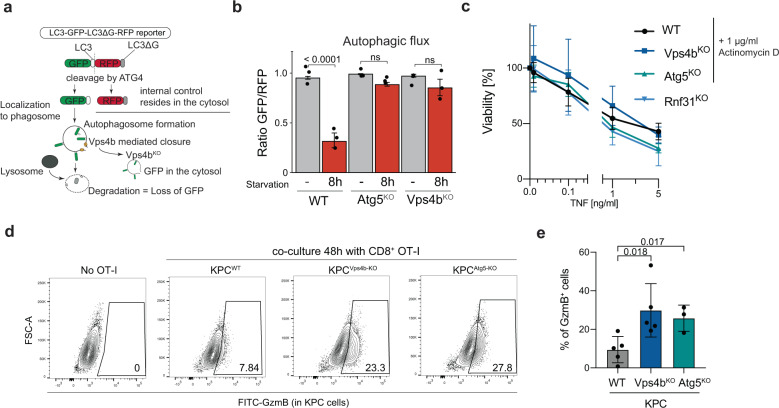
Pancreatic ductal adenocarcinoma (PDA) is an inherently immune cell deprived tumor, characterized by desmoplastic stroma and suppressive immune cells. Here we systematically dissect PDA intrinsic mechanisms of immune evasion by in vitro and in vivo CRISPR screening, and identify Vps4b and Rnf31 as essential factors required for escaping CD8+ T cell killing. For Vps4b we find that inactivation impairs autophagy, resulting in increased accumulation of CD8+ T cell-derived granzyme B and subsequent tumor cell lysis. For Rnf31 we demonstrate that it protects tumor cells from TNF-mediated caspase 8 cleavage and subsequent apoptosis induction, a mechanism that is conserved in human PDA organoids. Orthotopic transplantation of Vps4b- or Rnf31 deficient pancreatic tumors into immune competent mice, moreover, reveals increased CD8+ T cell infiltration and effector function, and markedly reduced tumor growth. Our work uncovers vulnerabilities in PDA that might be exploited to render these tumors more susceptible to the immune system.


Conflict of interest statement

The authors declare no competing interests.

Figures

Fig. 1
Fig. 1. Genome-wide CRISPR screen in PDA cells reveals immune evasion mechanisms in vitro.
a Schematic of genome-wide in vitro CRISPR screen. b Volcano plot of top ten depleted (blue) and enriched (red) genes. Screening analysis was performed with MaGeCK RRA. c sgRANK of the top (red) and bottom (blue) five depleted genes are represented. Gray bars represent non-targeting sgRNAs. d sgRANK of the enriched (red) and depleted (blue) genes of different immune evasion pathways. Gray bars represent non-targeting sgRNAs. MaGeCK RRA analysis can be found in Supplementary Table 1. The genome-wide CRISPR screening data shown were derived from three independent biological replicates (n = 3).
Fig. 2
Fig. 2. A targeted CRISPR library screen validates candidates in vivo.
a Schematic of the secondary CRISPR screen in vivo. b Heatmap of normalized read counts of sgRNAs across ten individual mice (M1–M10). c Bar diagram of sublibrary genes in comparison to their predicted phenotype (from in vitro screen). d Volcano plot of depleted (blue dots) genes of the sublibrary in vivo screen when comparing the pool of preinjected KPC cells to OT-I CD8+ T cell treated tumors. Sublibrary screening data were derived from a total of ten individual tumors (transplanted mice n = 10), transplanted in two experiments. Source data are provided as a Source Data file.
Fig. 3
Fig. 3. Arrayed validation of selected screening hits in vitro.
a Schematic of in vitro competition assay. Tumor cell:T cell co-cultures were carried out with an E:T ratio of 1:1 in all experiments. b Representative flow cytometry plots (GFP vs. mCherry) of the arrayed hit validation with and without T cell co-culture. c Log2 Fold change of mCherry+ KPC population before and after OT-I co-culture with different sgRNAs targeting candidates Rnf31 and Vps4b. n = 3 for Rnf31-2; Rnf31-3 and Vps4b-3, all other conditions n = 4. d Log2 Fold change of mCherry+ KPC population before and after OT-I co-culture in an alternative KPC cell line, B16-F10 melanoma cells and EO771 breast cancer cells. n = 4 for KPC-2 Rnf31 and B16-F10 Rnf31, all other conditions n = 3. e Mean fluorescence intensity (MFI) of Pan-H2-Kb. n = 3 independent experiments. Significance was determined with a one-way ANOVA analysis. Non-significant, p > 0.05. Values represent mean±SD, data are derived from three independent experiments. Source data are provided as a Source Data file.
Fig. 4
Fig. 4. Rnf31KO sensitizes PDA to TNF-triggered apoptosis.
a Immunofluorescence staining of KPC-1 candidate lines after 2 h of 100 ng/ml TNF. Cleaved caspase 3 (red) and DAPI (blue). Scale bar represents 100 µm. b Western Blot analysis of KPC cell lines after TNF treatment (100 ng/ml) for active NFκB signaling (phospho-p65; upper panel) and cleaved caspase 8/caspase 8 (bottom panel). Gapdh was included as loading control. c Western Blot analysis of KPC WT and Rnf31KO cell lines after TNF treatment (100 ng/ml) overtime for c-FlipL. Gapdh was included as loading control. Western plots in (b, c) were repeated three times independently. Representative images are shown. d Brightfield images of human PDA organoids in the presence of 100 ng/ml TNF for 4 h. Boxes highlight viable (green arrows) and dying organoids (red arrows). Scale bar represents 200 µm. e Whole-mount staining of human PDA organoids after 4 h TNF (100 ng/ml) treatment with cleaved caspase 3 (red), E-cadherin (white), and DAPI (blue). Scale bar represents 20 µm. Immunofluorescence stainings and bright-field images in (a), (d), and (e) were repeated twice on independent samples. Representative images are shown. f Relative organoid viability, individual organoids were counted and classified in ‘live’ or ‘dead’. Percentage dead/live of the counted area of all organoids is displayed. Values represent mean, n = 2 independent experiments. Source data are provided as a Source Data file.
Fig. 5
Fig. 5. Disruption of Vps4b leads to impaired autophagy and granzyme B accumulation in tumor cells.
a Schematic of autophagic flux reporter based on the LC3-GFP-LC3ΔG-RFP probe adapted from Kaizuka et al.. b Quantification of autophagic flux by flow cytometry in different KPC lines under normal and starvation conditions (8 h in PBS + 2% FBS). Bars represent the ratio of GFP to RFP expressing cells with n = 3 independent experiments. c Assessment of TNF sensitivity threshold in different KPC cells in the presence of 1 µg/ml actinomycin D, except for Rnf31KO; here no Actinomycin D was present. Crystal violet staining was used for the quantification of viable cells. Represented data are relative to untreated control cells. Data are from n = 4 independent experiments. d Flow cytometric analysis of intracellular granzyme B in KPC-1 cells. Cells were gated on FSC/SCC—viability—CD8- negative. e Quantification of granzyme B positive cancer cells and T cells based on (d) n = 5 for WT and Vps4b and n = 3 for Atg5. Significance in (b) was determined with one-way ANOVA. Significance in (e) was determined with an unpaired, two-tailed t-test. ns, non-significant, p > 0.05. Values represent mean ±SD, data are derived from at least three independent experiments. Source data are provided as a Source Data file.
Fig. 6
Fig. 6. Rnf31KO and Vps4bKO enhances CD8+ T cell function in vivo.
a Schematic of in vivo experimental set up. b Tumor weight (left panel; n for WT = 6; Rnf31KO = 7; Vps4bKO = 8) and survival (right panel; n = 7 per group) after orthotopic transplantation into C57BL/6 mice. Log-Rank test was performed to assess statistical significance in Kaplan–Meier plot. c Flow cytometry analysis of effector function of CD8+ T cells within tumors; n in WT = 6; Rnf31KO = 7; Vps4bKO = 8; panels Eomes+ and Ki67+ n = 5 per group for all genotypes). d Assessment CD8+ T cell effector function and tumor weight (right panel) in Rnf31KO or Vps4bKO tumors with or without immune checkpoint inhibition (ICB); n = 8 per group). Significance in (b, left panel), (c, d) was determined with unpaired two-tailed t tests; ns, non-significant, p > 0.05. The middle line in the boxplots shows the median, the lower and upper hinges represent the first and third quartiles, and whiskers represent ±1.5× the interquartile range. Source data are provided as a Source Data file.

References

    1. Zhang, Y., Crawford, H. C. & Pasca Di Magliano, M. Epithelial-stromal interactions in pancreatic cancer. Annu. Rev. Physiol. 81, 211–233 (2019). - PubMed
    1. Zhang Y, et al. Regulatory T cell depletion alters the tumor microenvironment and accelerates pancreatic carcinogenesis. Cancer Discov. 2020;10:422–439. doi: 10.1158/2159-8290.CD-19-0958. - DOI - PMC - PubMed
    1. Royal RE, et al. Phase 2 trial of single agent ipilimumab (Anti-CTLA-4) for locally advanced or metastatic pancreatic adenocarcinoma. J. Immunother. 2010;33:828–833. doi: 10.1097/CJI.0b013e3181eec14c. - DOI - PMC - PubMed
    1. Steele NG, Carpenter ES, Kemp SB, Sirihorachai VR. Multimodal mapping of the tumor and peripheral blood immune landscape in human pancreatic cancer. Nat. Cancer. 2020 doi: 10.1038/s43018-020-00121-4. - DOI - PMC - PubMed
    1. Yarchoan M, Hopkins A, Jaffee EM. Tumor mutational burden and response rate to PD-1 inhibition. N. Engl. J. Med. 2017;377:2500–2501. doi: 10.1056/NEJMc1713444. - DOI - PMC - PubMed

MeSH terms

Substances