. 2022 Apr 4;12(1):5611.
doi: 10.1038/s41598-022-09366-8.

Validation and quantification of left ventricular function during exercise and free breathing from real-time cardiac magnetic resonance images

Affiliations

Validation and quantification of left ventricular function during exercise and free breathing from real-time cardiac magnetic resonance images

Jonathan Edlund et al. Sci Rep. .

Abstract

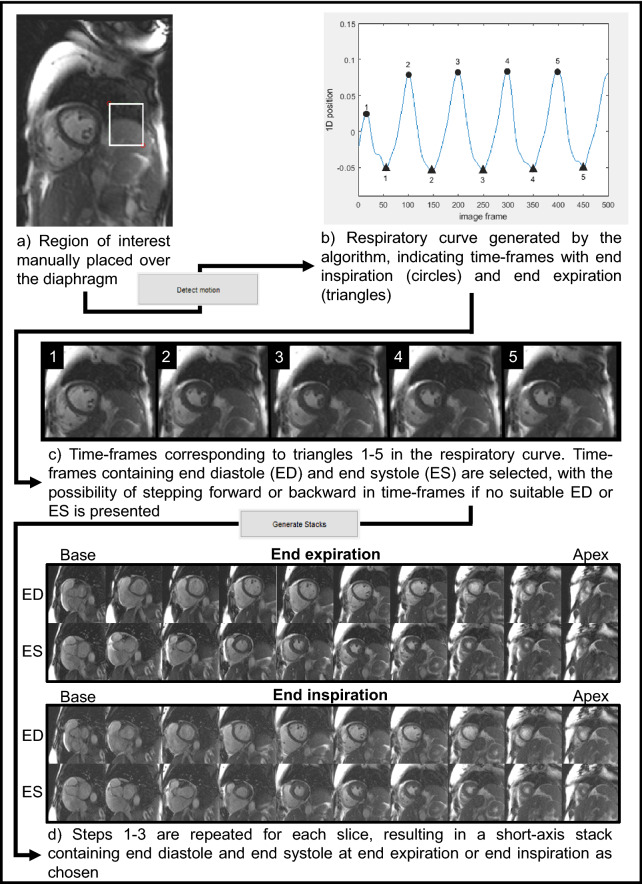
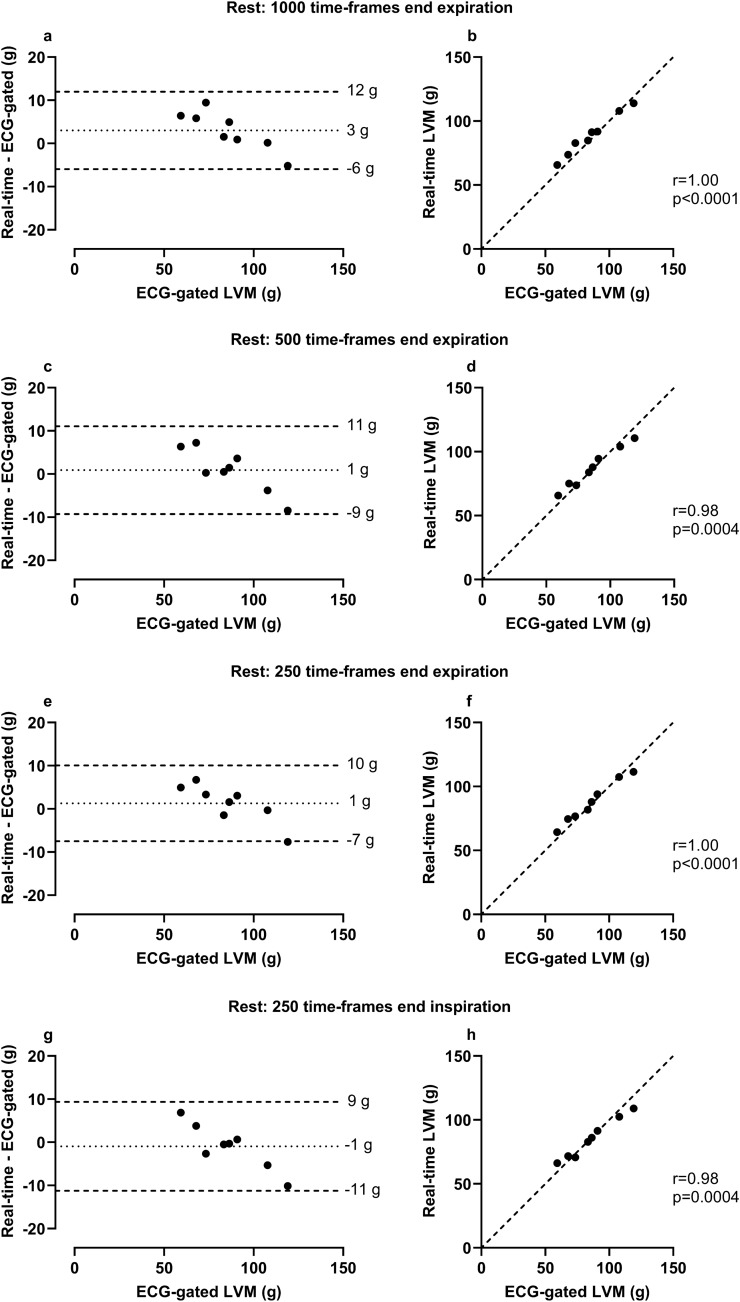
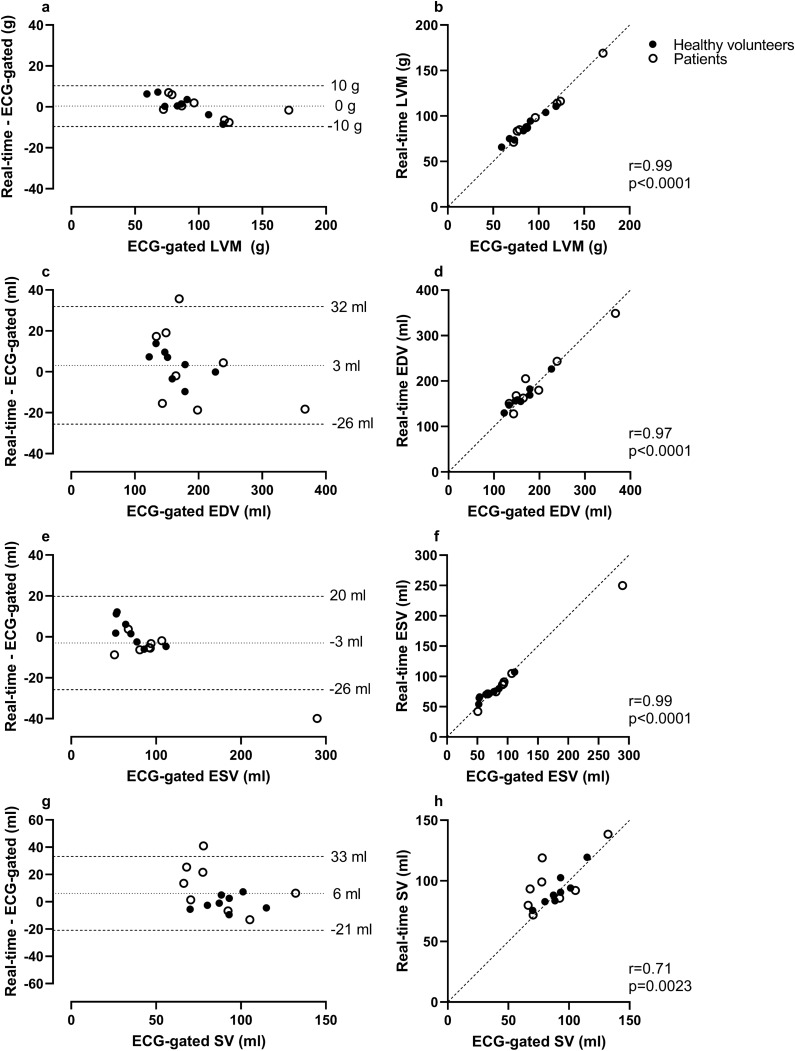
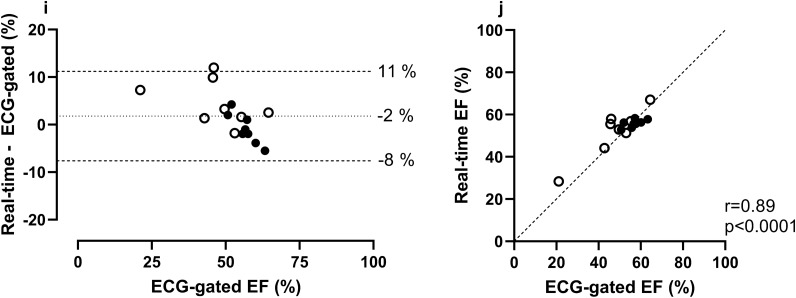
Exercise cardiovascular magnetic resonance (CMR) can unmask cardiac pathology not evident at rest. Real-time CMR in free breathing can be used, but respiratory motion may compromise quantification of left ventricular (LV) function. We aimed to develop and validate a post-processing algorithm that semi-automatically sorts real-time CMR images according to breathing to facilitate quantification of LV function in free breathing exercise. A semi-automatic algorithm utilizing manifold learning (Laplacian Eigenmaps) was developed for respiratory sorting. Feasibility was tested in eight healthy volunteers and eight patients who underwent ECG-gated and real-time CMR at rest. Additionally, volunteers performed exercise CMR at 60% of maximum heart rate. The algorithm was validated for exercise by comparing LV mass during exercise to rest. Respiratory sorting to end expiration and end inspiration (processing time 20 to 40 min) succeeded in all research participants. Bias ± SD for LV mass was 0 ± 5 g when comparing real-time CMR at rest, and 0 ± 7 g when comparing real-time CMR during exercise to ECG-gated at rest. This study presents a semi-automatic algorithm to retrospectively perform respiratory sorting in free breathing real-time CMR. This can facilitate implementation of exercise CMR with non-ECG-gated free breathing real-time imaging, without any additional physiological input.


Conflict of interest statement

EH is the founder of Medviso AB, Lund, Sweden, which sells a commercial version of Segment. The other authors declare that they have no competing interests.

Figures

Figure 1
Figure 1
Flow chart for the respiratory module in Segment. The respiratory module in Segment utilized manual input to construct short-axis image stacks containing end diastole and end systole at end expiration or end inspiration from real-time CMR images. (a) A short-axis image with a respiratory region of interest (ROI, white box) placed over the superior border of the diaphragm. (b) The respiratory curve generated by the algorithm based on calculations from the placed ROI. Here the filled triangles annotate time-frames in which end expiration was identified, filled circles end inspiration. (c) An image gallery of the corresponding time-frames to the annotations in the respiratory curve (end expiration shown in the figure). These images were used for selecting time-frames in which end diastole and end systole coincide with end expiration. It was possible to manually step forward or backward several time-frames in each image if no suitable time-frames for end diastole or end systole were automatically suggested. While stepping forward or backward in time-frames the corresponding annotation moved in the respiratory curve, which allowed the user to ensure the current time-frame was still within end expiration or end inspiration. (d) The resulting short-axis image stacks containing end diastole and end systole at end expiration and end inspiration. The software used for this figure was Segment 3.0 (http://segment.heiberg.se).
Figure 2
Figure 2
Reliability of left ventricular mass (LMV) measurements between real-time image stacks constructed from different numbers of time-frames at rest and during exercise in eight healthy volunteers. Reliability was high between measurements of left ventricular mass in real-time short-axis image stacks originating from 1000, 500, and 250 time-frames at end expiration. Real-time image stacks originating from 1000, 500 and 250 time-frames correspond to image acquisition times of ~ 34, ~ 17 and ~ 8 s respectively. The lines between the different time-frame measurements indicate the same research participants in the groups. 250 exercise shows measurements from images acquired during on-going exercise. ICC intraclass correlation coefficient.
Figure 3
Figure 3
Agreement of left ventricular mass (LVM) measurements in real-time (RT) images versus ECG-gated images in healthy volunteers. Panels a–h show measurements made at rest, panels i–l during exercise and panels m–n regardless of respiratory state at rest. Note that for all panels, ECG-gated LVM was measured at rest. RT measurements were made at rest and end expiration unless otherwise specified. Bias was low and correlation high in all measurements in end-respiratory states, however one extreme value was seen in the two exercise measurements (i, k). In both cases, one basal slice was missing in one RT image stack during exercise. Bias was high in first heart beat measurements made regardless of respiratory state. For Bland–Altman plots the dotted line represents bias, defined as the mean difference between real-time and ECG-gated measurements and the dashed lines represent the upper and lower 95% limits of agreement (bias ± 1.96 SD of the difference). In the scatter plots the dashed line represents a line of identity.
Figure 3
Figure 3
Agreement of left ventricular mass (LVM) measurements in real-time (RT) images versus ECG-gated images in healthy volunteers. Panels a–h show measurements made at rest, panels i–l during exercise and panels m–n regardless of respiratory state at rest. Note that for all panels, ECG-gated LVM was measured at rest. RT measurements were made at rest and end expiration unless otherwise specified. Bias was low and correlation high in all measurements in end-respiratory states, however one extreme value was seen in the two exercise measurements (i, k). In both cases, one basal slice was missing in one RT image stack during exercise. Bias was high in first heart beat measurements made regardless of respiratory state. For Bland–Altman plots the dotted line represents bias, defined as the mean difference between real-time and ECG-gated measurements and the dashed lines represent the upper and lower 95% limits of agreement (bias ± 1.96 SD of the difference). In the scatter plots the dashed line represents a line of identity.
Figure 4
Figure 4
Agreement of left ventricular volumes, mass, and ejection fraction in real-time (RT) images at rest versus ECG-gated images at rest in eight healthy volunteers and eight patients. In all panels, RT measurements were made in stacks with a ~ 17 s image acquisition time per slice (500 time-frames). Bias was low and correlation high for all measurements. In the panels depicting EDV (c), SV (g) and EF (i), one point of measurement from the same patient can be seen outside the limits of agreement. In this case the ECG-gated images contained respiratory artifacts in several basal slices which may have impacted measurements. In the panel depicting ESV (e), one point of measurement from another patient can be seen outside the limits of agreement. In this case the patient had a severely dilated ventricle, making the absolute difference in measurements noticeable while the relative difference was comparable to other ESV measurements. In the Bland–Altman plots the dotted line represents bias, defined as the mean difference between real-time and ECG-gated measurements and the dashed lines represent the upper and lower 95% limits of agreement (bias ± 1.96 SD of the difference). In the scatter plots the dashed line represents a line of identity. LVM = left ventricular mass; EDV = end diastolic volume; ESV = end systolic volume; SV = stroke volume; EF = ejection fraction.
Figure 4
Figure 4
Agreement of left ventricular volumes, mass, and ejection fraction in real-time (RT) images at rest versus ECG-gated images at rest in eight healthy volunteers and eight patients. In all panels, RT measurements were made in stacks with a ~ 17 s image acquisition time per slice (500 time-frames). Bias was low and correlation high for all measurements. In the panels depicting EDV (c), SV (g) and EF (i), one point of measurement from the same patient can be seen outside the limits of agreement. In this case the ECG-gated images contained respiratory artifacts in several basal slices which may have impacted measurements. In the panel depicting ESV (e), one point of measurement from another patient can be seen outside the limits of agreement. In this case the patient had a severely dilated ventricle, making the absolute difference in measurements noticeable while the relative difference was comparable to other ESV measurements. In the Bland–Altman plots the dotted line represents bias, defined as the mean difference between real-time and ECG-gated measurements and the dashed lines represent the upper and lower 95% limits of agreement (bias ± 1.96 SD of the difference). In the scatter plots the dashed line represents a line of identity. LVM = left ventricular mass; EDV = end diastolic volume; ESV = end systolic volume; SV = stroke volume; EF = ejection fraction.
Figure 5
Figure 5
Comparison of stroke volume during exercise quantified by planimetry in real-time (RT) images at end expiration and end inspiration to flow in RT CMR images. Planimetric RT measurements were made in stacks with an ~ 8 s image acquisition time per slice (250 time-frames). Bias was low for left ventricular stroke volume (SV) when comparing planimetric measurements in RT CMR images with flow measurements in the ascending aorta in RT phase-contrast images in eight healthy volunteers. The outlier in each plot represents the same healthy volunteer in which stroke volume measured from flow was lower than from planimetry. No apparent irregularities in either modality were found in this individual. In the Bland–Altman plots the dotted line represents bias, defined as the mean difference between planimetric and flow measurements, and the dashed lines represent the upper and lower 95% limits of agreement (bias ± 1.96 SD). In the scatter plots the dashed line represents a line of identity.

References

    1. Boesiger P, Maier SE, Kecheng L, Scheidegger MB, Meier D. Visualization and quantification of the human blood flow by magnetic resonance imaging. J. Biomech. 1992;25:55–67. - PubMed
    1. Hundley WG, et al. Quantitation of cardiac output with velocity-encoded, phase-difference magnetic resonance imaging. Am. J. Cardiol. 1995;75:1250–1255. - PubMed
    1. Leiner T, et al. SCMR Position Paper (2020) on clinical indications for cardiovascular magnetic resonance. J. Cardiovasc. Magn. Reson. 2020;22:76. - PMC - PubMed
    1. Craven TP, Tsao CW, La Gerche A, Simonetti OP, Greenwood JP. Exercise cardiovascular magnetic resonance: Development, current utility and future applications. J. Cardiovasc. Magn. Reson. 2020;22:65. - PMC - PubMed
    1. Gusso S, et al. Design and testing of an MRI-compatible cycle ergometer for non-invasive cardiac assessments during exercise. Biomed. Eng. Online. 2012;11:13. - PMC - PubMed

Publication types