. 2022 Apr 4;12(1):5644.
doi: 10.1038/s41598-022-09593-z.

A mouse model with widespread expression of the C9orf72-linked glycine-arginine dipeptide displays non-lethal ALS/FTD-like phenotypes

Affiliations

A mouse model with widespread expression of the C9orf72-linked glycine-arginine dipeptide displays non-lethal ALS/FTD-like phenotypes

Brandie Morris Verdone et al. Sci Rep. .

Abstract

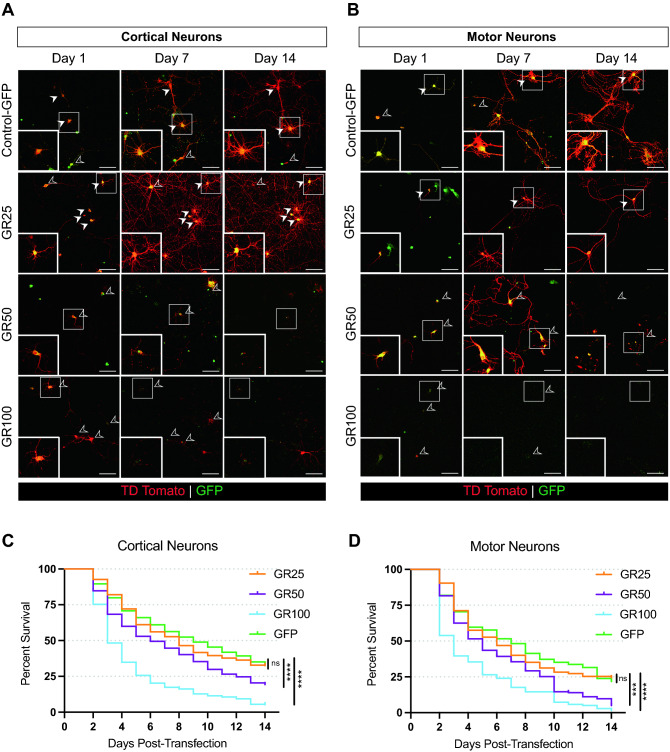
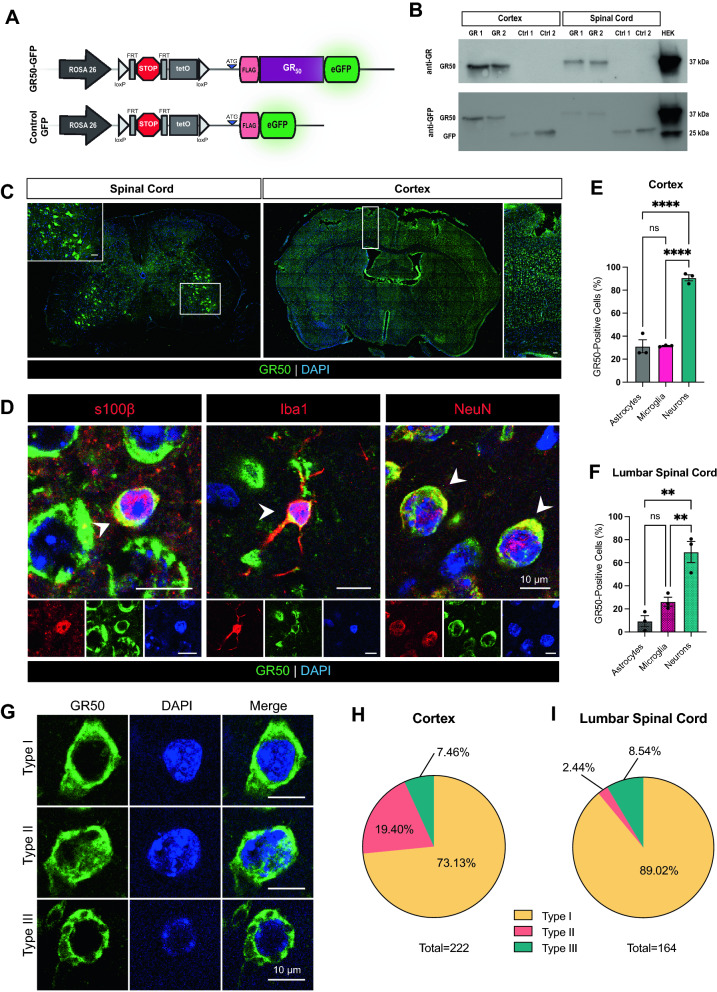
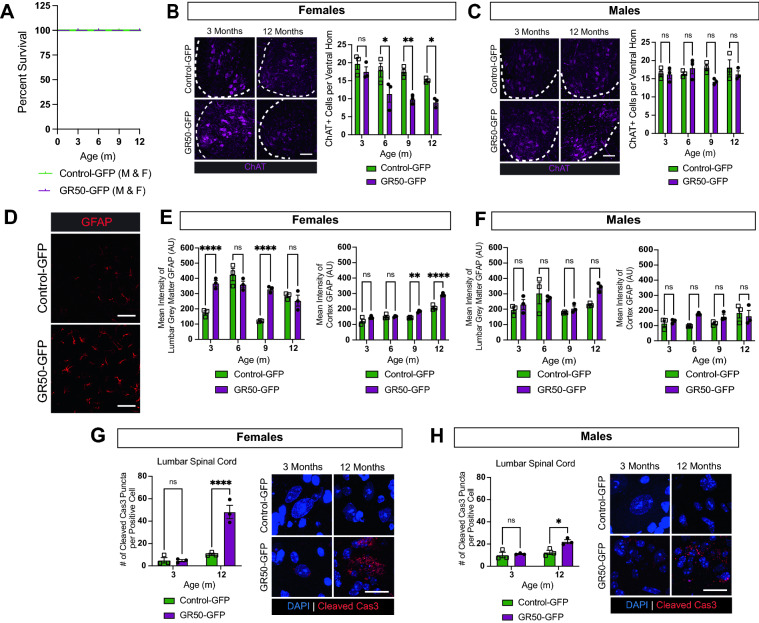
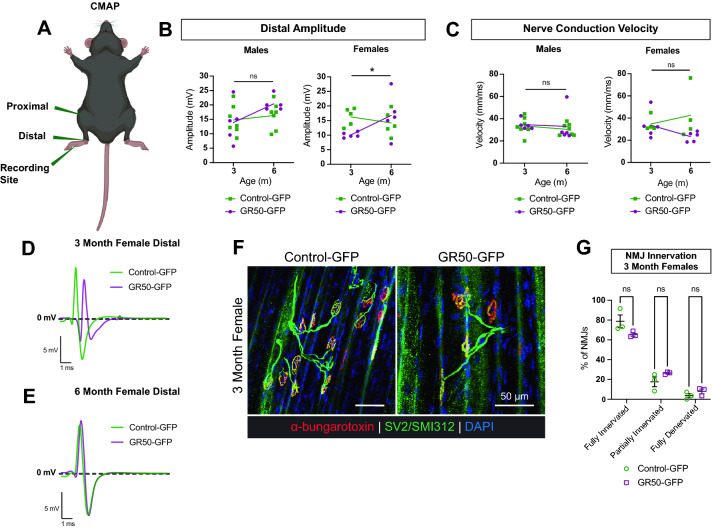
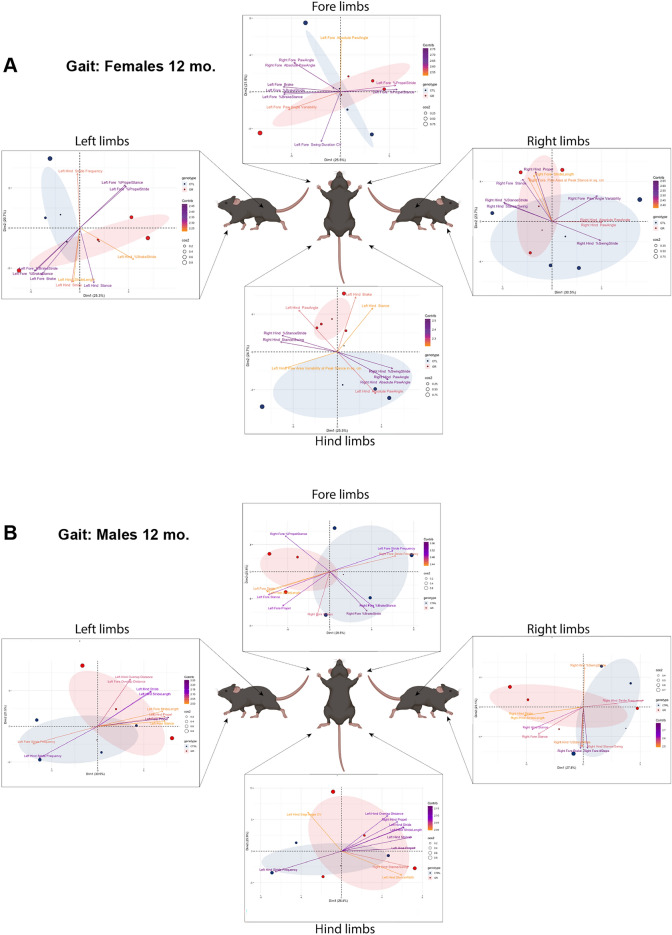
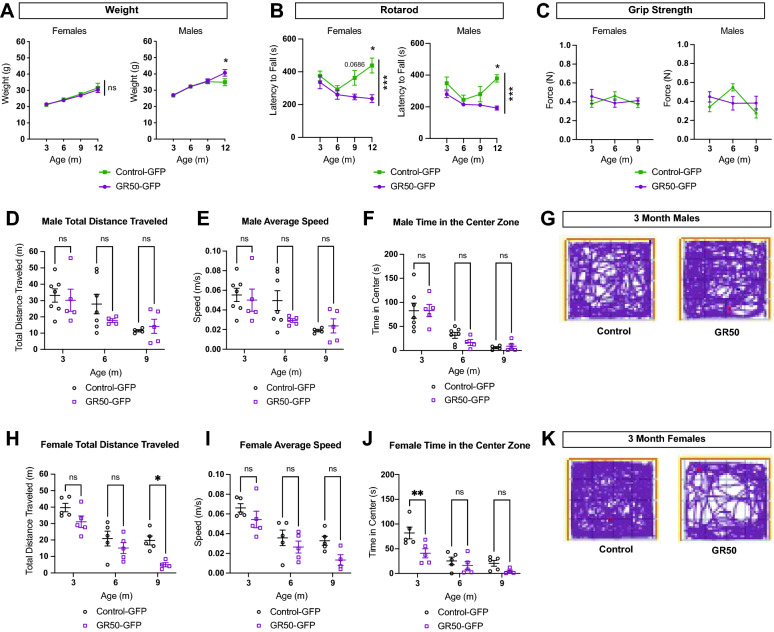
Translation of the hexanucleotide G4C2 expansion associated with C9orf72 amyotrophic lateral sclerosis and frontotemporal dementia (ALS/FTD) produces five different dipeptide repeat protein (DPR) species that can confer toxicity. There is yet much to learn about the contribution of a single DPR to disease pathogenesis. We show here that a short repeat length is sufficient for the DPR poly-GR to confer neurotoxicity in vitro, a phenomenon previously unobserved. This toxicity is also reported in vivo in our novel knock-in mouse model characterized by widespread central nervous system (CNS) expression of the short-length poly-GR. We observe sex-specific chronic ALS/FTD-like phenotypes in these mice, including mild motor neuron loss, but no TDP-43 mis-localization, as well as motor and cognitive impairments. We suggest that this model can serve as the foundation for phenotypic exacerbation through second-hit forms of stress.


Conflict of interest statement

The authors declare no competing interests.

Figures

Figure 1
Figure 1
GR50 neurotoxic profile in vitro. Primary cortical neurons (A) and motor neurons (B) co-transfected with 125 ng td-tomato and 400 ng of GFP-tagged GR constructs of length 25, 50, 100, or GFP. Scale bar 100 µm. Inset shows cells that are double-positive for td-tomato and GFP-tagged construct of interest. Closed arrows indicate cells that survive over the 14-day observation period. Open arrows indicate cells that die over the time-course of the experiment. Log-rank longitudinal survival assessment of co-transfected td-tomato and GFP-GR25, 50, 100, or GFP alone quantified for primary corticals in (C) and motor neurons (D) over 14 days. Cells (m) pooled from n = 3 independent experiments. Primary cortical neurons m = 319 (GFP), 302 (GR25), 348 (GR50), and 263 (GR100). ****p < 0.0001. Primary motor neurons m = 149 (GFP), 105 (GR25), 163 (GR50), and 169 (GR100). ***p = 0.0001, ****p < 0.0001. Cell counts, p-values, and hazard ratios summarized in Tables 1 and 2.
Figure 2
Figure 2
Establishment of in vivo mouse model of GR50 expression under a ubiquitous promoter system. (A) Schematic of the FAST cassette used to encode ATG-driven FLAG-GR50-GFP or FLAG-GFP in mice at the Rosa26 locus under the ROSA26 promoter. (B) Representative western blot probing for GR (top) or GFP (bottom) in either GR50-GFP or control-GFP mice. Lysate from human embryonic kidney (HEK) cells transiently transfected with FLAG-GR50-GFP used as a positive control. (C) Representative image of endogenous expression of GR50-GFP in the lumbar spinal cord and cortex of a 3-month-old GR50-GFP mouse. Enlargement scale bars = 50 µm. Selected cortex area approximates region used for subsequent quantifications. (D) Representative images of S100β-, Iba1-, or NeuN-positive CNS cells expressing GR50-GFP in 3-month-old mice. Percentage of astrocytes, microglia, and neurons positive for GR50-GFP within cortical layers (E) and lumbar spinal cord (F). One-way ANOVA, Tukey’s multiple comparison’s test. (E) Cortex: n = 3 mice; mean ± s.e.m. Astrocytes vs. microglia p = 0.9972, neurons vs. astrocytes p < 0.0001, neurons vs. microglia p < 0.0001. (F) Lumbar Spinal Cord: n = 3 mice; mean ± s.e.m. Astrocytes vs. microglia p = 0.2246, neurons vs. astrocytes p = 0.0013, neurons vs. microglia p = 0.0071. (G) Representative images of the localization patterns of GR50 within CNS at 3-months-old. Type I: diffuse, cytosolic. Type II: cytosolic with evidence of perinuclear accumulation. Type III: cytosolic, aggregated. Percent distribution of localization types within the cortex and lumbar spinal cord quantified in (H), (I), n = 222 cells from cortex, 164 cells from lumbar spinal cord from 4 mice (2m, 2f). Localization types were scored manually with experimenter blinded to the genotype of the mice.
Figure 3
Figure 3
Histopathological changes in GR50 expressing mice. (A) Kaplan–Meier analysis of survival of GR50-GFP and control-GFP male and female mice over 12 months; n = 37 control-GFP mice, 29 GR50-GFP mice. (B) Representative image of ChAT-staining in the ventral horn of the lumbar spinal cord in female mice at 3 and 12 months. Scale bar = 100 µm. Quantification of chat-positive cells at 3-, 6-, 9- and 12-months. n = 3 mice per time-point, min. 6 fields per mouse for quantification, mean ± s.e.m. Two-way ANOVA, Sidak’s multiple comparisons test. 3-months p = 0.7329, 6-months p = 0.0163, 9-months p = 0.0051, 12-months p = 0.0269. (C) Same as in (B) but for male mice. 3-months p = 0.9997, 6-months p = 0.8340, 9-months p = 0.1198, 12-months p = 0.7119. (D) Representative image of GFAP fluorescence within the lumbar ventral grey matter in female control-GFP and GR50-GFP mice at 3-months-old. Scale bar = 50 µm (E) Quantification of lumbar ventral gray (left) and cortical GFAP expression (right) in female mice at 3-, 6-, 9- and 12-months-old. n = 3 mice per time-point, min 6 fields per mouse for quantification, mean ± s.e.m. Two-way ANOVA, Sidak’s multiple comparisons test. Female Lumbar: 3-months p < 0.0001, 6-months p = 0.2401, 9-months p < 0.0001, 12-months p = 0.8294. Female Cortex: 3-months p = 0.1654, 6-months p > 0.9999, 9-months p = 0.0059, 12-months p < 0.0001. (F) Same as in (E) but for male mice. Male Lumbar: 3-months p = 0.8662, 6-months p = 0.9017, 9-months p = 0.9442, 12-months p = 0.0551. Male Cortex: 3-months p = 0.9886, 6-months p = 0.0559, 9-months p = 0.4431, 12-months p = 0.9192. (G) Quantification of cleaved caspase-3 puncta accumulation within cleaved caspase-3 positive cells of the lumbar spinal cord in female control-GFP and GR50-GFP mice at 3- and 12-months-old. n = 3 mice per time-point, min 6 fields per mouse for quantification, mean ± s.e.m. Two-way ANOVA, Sidak’s multiple comparisons test. 3-months p = 0.9974, 12-months p < 0.0001. Right: representative images of cleaved caspase-3 puncta in control-GFP and GR50-GFP female lumbar spinal cord at 3- and 12-months-old. Scale bar = 20 µm. (H) Same as in (G) but for males. 3-months p = 0.9102, 12-months p = 0.0110. Right: representative images of cleaved caspase-3 puncta in control-GFP and GR50-GFP male lumbar spinal cord at 3- and 12-months-old. Scale bar = 20 µm.
Figure 4
Figure 4
Female mice demonstrate CMAP functional differences absent of abnormal NMJ morphology. (A) Schematic of CMAP stimulating and recording electrode placement along the sciatic nerve within the hindlimb of test mice. (B) Distal amplitude recordings in male (left) and female (right) control-GFP and GR50-GFP mice at 3- and 6- months old. Males: n = 5 GR50-GFP, 7 control-GFP; time x genotype p = 0.2385. Females: n = 5 mice per genotype; time x genotype p = 0.0386. Two-way ANOVA, Sidak’s multiple comparisons test. (C) Nerve conduction velocity in male (left) and female (right) control-GFP and GR50-GFP mice at 3- and 6- months old. Males: n = 5 GR50-GFP, 7 control-GFP; time x genotype p = 0.8522. Females: n = 5 GR50-GFP, 4 control-GFP; time x genotype p = 0.7671. Two-way ANOVA, Sidak’s multiple comparisons test. (D) Representative distal CMAP stimulus trace of a female control-GFP and GR50-GFP mouse at 3 months and (E) 6 months. Dashed line indicates 0 mV. (F) Representative images of the neuromuscular junctions of the extensor digitorum longus muscle of female control-GFP and GR50-GFP mice at 3-months-old stained for presynaptic SV2 and postsynaptic alpha-bungarotoxin. Scale bar = 50 µm. (G) Quantification of the innervation status of NMJs of the soleus and extensor digitorum longus muscles of female control-GFP and GR50-GFP mice at 3-months-old. n = 3 mice per time-point, mean ± s.e.m. Two-way ANOVA, Sidak’s multiple comparisons test. Fully Innervated: p = 0.0717, Partially Innervated: p = 0.3016, Fully Denervated: p = 0.7910.
Figure 5
Figure 5
PCA identifies difference in hindlimb gait dynamics. Principal component analysis of the Digigait gait performance of left, right, fore, and hindlimbs in female (A) and male (B) control-GFP (blue) and GR50-GFP (red) mice at 12 months old. n = 4 mice per sex and genotype. Ellipses indicate spread of variance. Size of dot representing each mouse defines its overall contribution to the spread of the variance. Arrows list top 10 Digigait measurements, or indices, that contribute to the principal component space. The color of each arrow is scaled according to the indices’ contribution to the first two dimensions of the principal component space (Contrib. purple-orange scale).
Figure 6
Figure 6
Motor and behavioral phenotypes in GR50 expressing mice. (A) Weight of female (left) and male (right) control-GFP and GR50-GFP mice at 3, 6, 9, and 12 months. Females: control-GFP n = 15, 15, 13, 6; GR50-GFP n = 14, 11, 11, 6. Males: control-GFP n = 12, 13, 11, 5; GR50-GFP n = 14, 11, 11, 6. Mean ± s.e.m. Females: 3-months p = 0.9945, 6-months p = 0.9934, 9-months p = 0.9184, 12-months p = 0.9373. Males: 3-months p = 0.9997, 6-months p > 0.9999, 9-months p = 0.9976, 12-months p = 0.0473. (B) Rotarod performance of female (left) and male (right) control-GFP and GR50-GFP mice at 3, 6, 9, and 12 months. Females: control-GFP n = 14, 9, 9, 4; GR50-GFP n = 14, 11, 11, 6. Males: control-GFP n = 12, 13, 10, 5; GR50-GFP n = 10, 9, 8, 3. Mean ± s.e.m. Females: 3-months p = 0.8103, 6-months p = 0.9430, 9-months p = 0.0686, 12-months p = 0.0177. Males: 3-months p = 0.1998, 6-months p = 0.8804, 9-months p = 0.3002, 12-months p = 0.0117. (C) Hindlimb grip strength measurements of female (left) and male (right) control-GFP and GR50-GFP mice at 3, 6, and 9 months. Females: n = 5 per genotype; Males: n = 7 control-GFP, 5 GR50-GFP. Mean ± s.e.m. Females: time x genotype p = 0.4314. Males: time x genotype p = 0.5490. (D) Male total distance traveled in Open Field Assessment. Control-GFP n = 7, 7, 4; GR50-GFP n = 5, 4, 5. Mean ± s.e.m. 3-months p = 0.9654, 6-months p = 0.4424, 9-months p = 0.9810. (E) Male average speed in Open Field Assessment. Control-GFP n = 7, 7, 4; GR50-GFP n = 5, 5, 5. Mean ± s.e.m. 3-months p = 0.9535, 6-months p = 0.2208, 9-months p = 0.9759. (F) Male time spent in the center zone in Open Field Assessment. Control-GFP n = 7, 7, 4; GR50-GFP n = 5, 4, 5. Mean ± s.e.m. 3-months p > 0.9999, 6-months p = 0.7245, 9-months p = 0.9974. (G) Representative track plots of male control-GFP and GR50-GFP mice at 3-months. (H) Female total distance traveled in Open Field Assessment. Control-GFP n = 5, 5, 5; GR50-GFP n = 5, 5, 4. Mean ± s.e.m. 3-months p = 0.1890, 6-months p = 0.5160, 9-months p = 0.0158. (I) Female average speed in Open Field Assessment. Control-GFP n = 5, 5, 5; GR50-GFP n = 5, 5, 4. Mean ± s.e.m. 3-months p = 0.4798, 6-months p = 0.6563, 9-months p = 0.1392. (J) Female time spent in the center zone in Open Field Assessment. Control-GFP n = 5, 5, 5; GR50-GFP n = 5, 5, 4. Mean ± s.e.m. 3-months p = 0.0056, 6-months p = 0.8140, 9-months p = 0.4907. (K) Representative track plots of female control-GFP and GR50-GFP mice at 3-months. For all datasets, Two-way ANOVA with Sidak’s multiple comparisons test was used for statistical analysis.

References

    1. Chia R, Chio A, Traynor BJ. Novel genes associated with amyotrophic lateral sclerosis: Diagnostic and clinical implications. Lancet Neurol. 2018;17:94–102. doi: 10.1016/S1474-4422(17)30401-5. - DOI - PMC - PubMed
    1. DeJesus-Hernandez M, et al. Expanded GGGGCC hexanucleotide repeat in noncoding region of C9ORF72 causes chromosome 9p-linked FTD and ALS. Neuron. 2011;72:245–256. doi: 10.1016/j.neuron.2011.09.011. - DOI - PMC - PubMed
    1. Renton AE, et al. A hexanucleotide repeat expansion in C9ORF72 is the cause of chromosome 9p21-linked ALS-FTD. Neuron. 2011;72:257–268. doi: 10.1016/j.neuron.2011.09.010. - DOI - PMC - PubMed
    1. Gitler AD, Tsuiji H. There has been an awakening: Emerging mechanisms of C9orf72 mutations in FTD/ALS. Brain Res. 2016;1647:19–29. doi: 10.1016/j.brainres.2016.04.004. - DOI - PMC - PubMed
    1. Tang D, et al. Cryo-EM structure of C9ORF72-SMCR8-WDR41 reveals the role as a GAP for Rab8a and Rab11a. Proc. Natl. Acad. Sci. U.S.A. 2020;117:9876–9883. doi: 10.1073/pnas.2002110117. - DOI - PMC - PubMed

Publication types