. 2022 Apr;19(4):486-495.
doi: 10.1038/s41592-022-01426-1. Epub 2022 Apr 4.

SLEAP: A deep learning system for multi-animal pose tracking

Affiliations

SLEAP: A deep learning system for multi-animal pose tracking

Talmo D Pereira et al. Nat Methods. 2022 Apr.

Erratum in

  • Publisher Correction: SLEAP: A deep learning system for multi-animal pose tracking.
    Pereira TD, Tabris N, Matsliah A, Turner DM, Li J, Ravindranath S, Papadoyannis ES, Normand E, Deutsch DS, Wang ZY, McKenzie-Smith GC, Mitelut CC, Castro MD, D'Uva J, Kislin M, Sanes DH, Kocher SD, Wang SS, Falkner AL, Shaevitz JW, Murthy M. Pereira TD, et al. Nat Methods. 2022 May;19(5):628. doi: 10.1038/s41592-022-01495-2. Nat Methods. 2022. PMID: 35468969 Free PMC article. No abstract available.

Abstract

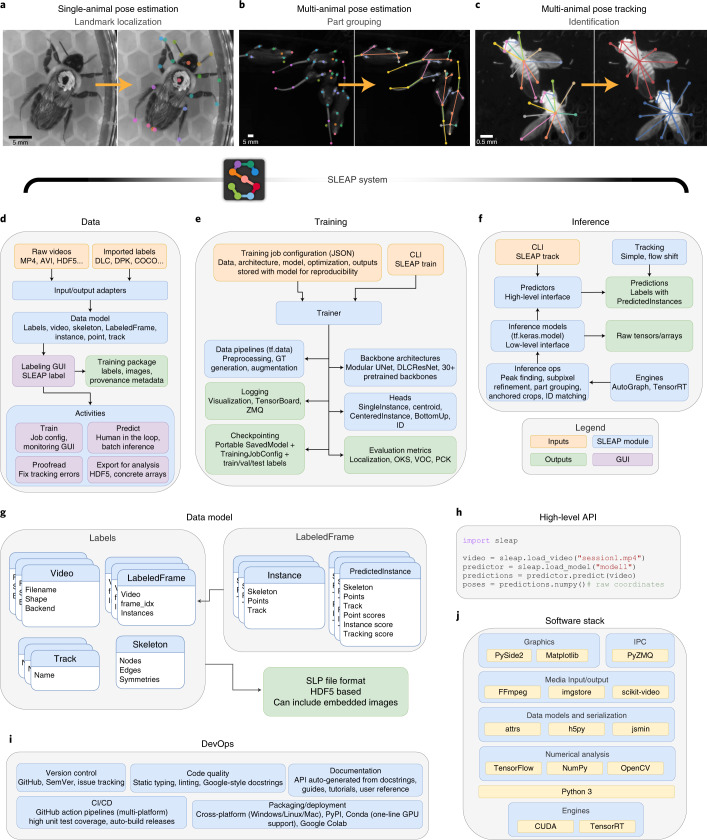
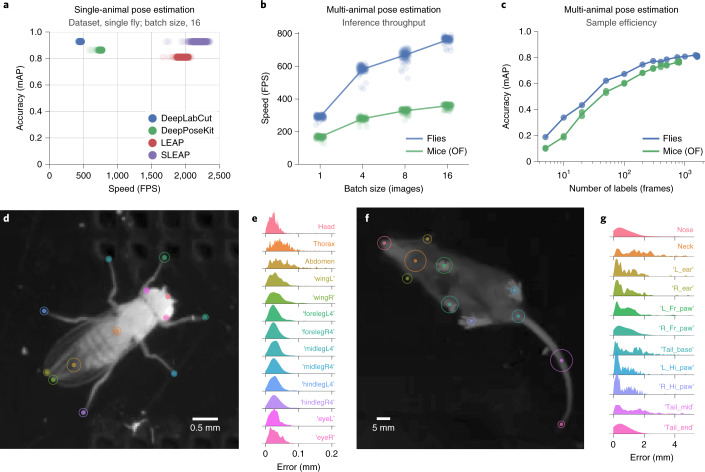
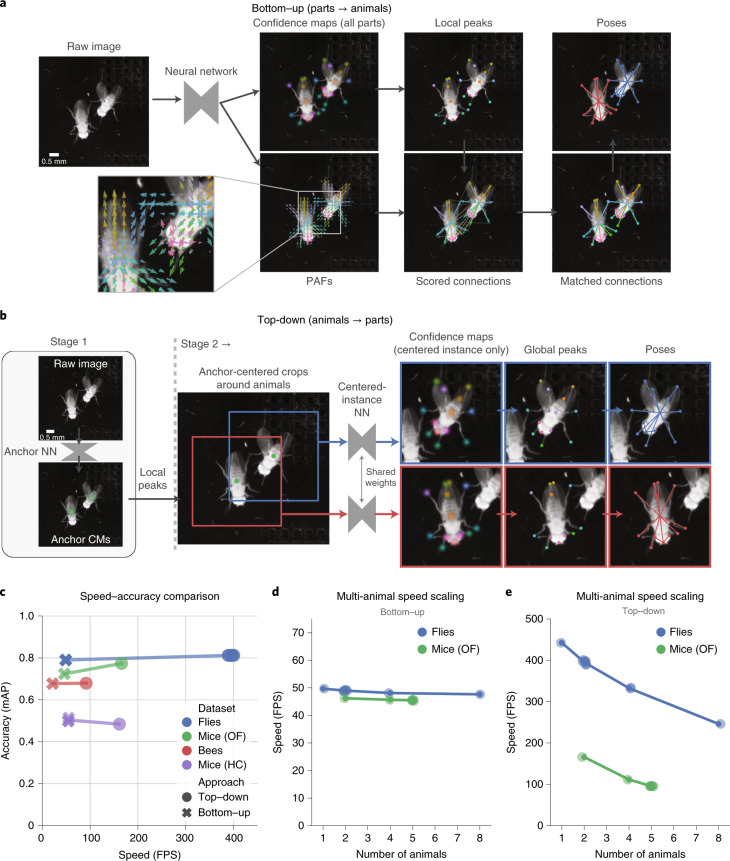
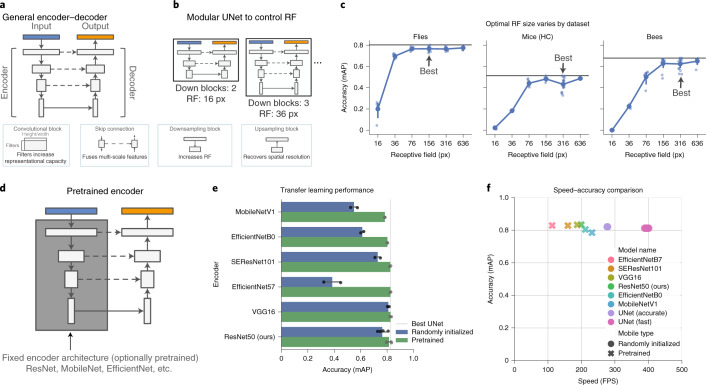
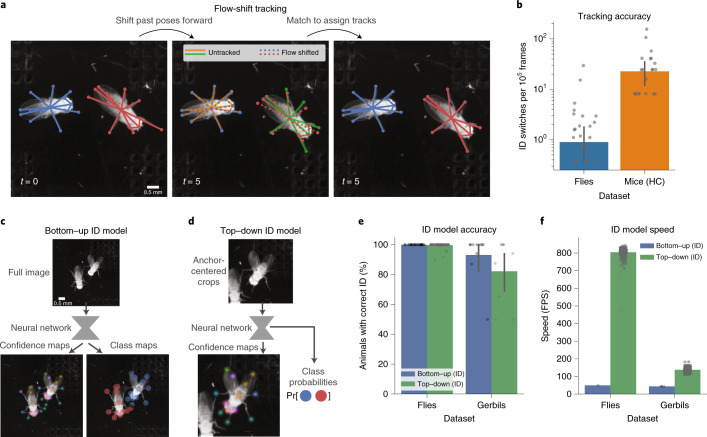
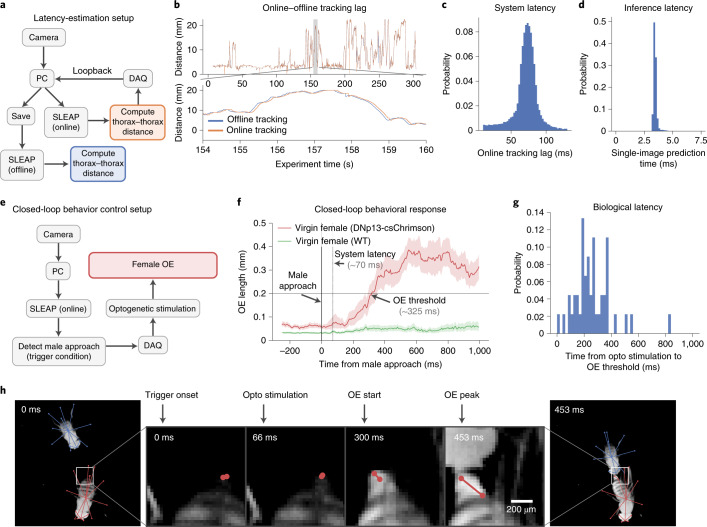
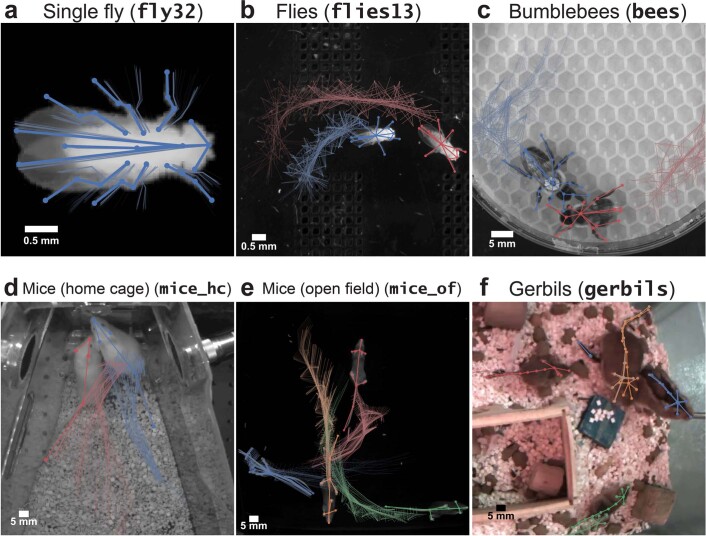
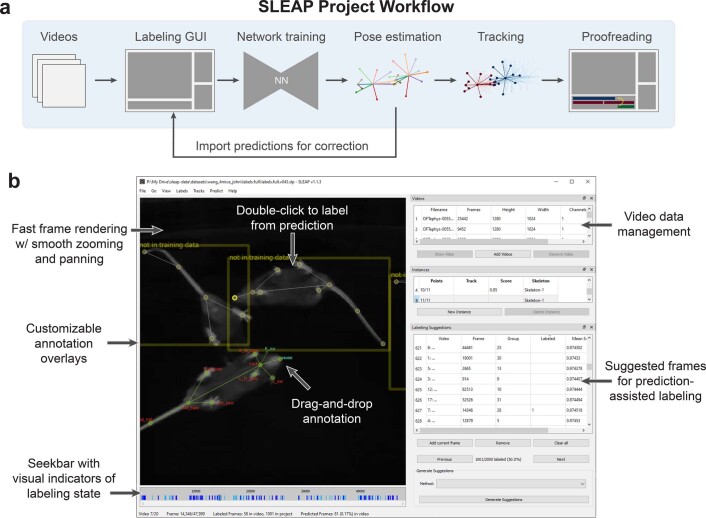
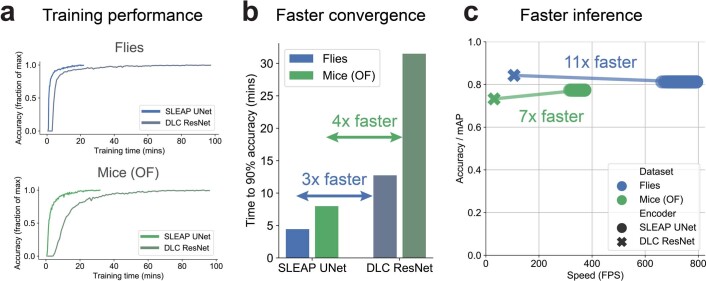
The desire to understand how the brain generates and patterns behavior has driven rapid methodological innovation in tools to quantify natural animal behavior. While advances in deep learning and computer vision have enabled markerless pose estimation in individual animals, extending these to multiple animals presents unique challenges for studies of social behaviors or animals in their natural environments. Here we present Social LEAP Estimates Animal Poses (SLEAP), a machine learning system for multi-animal pose tracking. This system enables versatile workflows for data labeling, model training and inference on previously unseen data. SLEAP features an accessible graphical user interface, a standardized data model, a reproducible configuration system, over 30 model architectures, two approaches to part grouping and two approaches to identity tracking. We applied SLEAP to seven datasets across flies, bees, mice and gerbils to systematically evaluate each approach and architecture, and we compare it with other existing approaches. SLEAP achieves greater accuracy and speeds of more than 800 frames per second, with latencies of less than 3.5 ms at full 1,024 × 1,024 image resolution. This makes SLEAP usable for real-time applications, which we demonstrate by controlling the behavior of one animal on the basis of the tracking and detection of social interactions with another animal.


Conflict of interest statement

A pending patent application (US application 17/282,818) was filed on 5 April 2021 by Princeton University on behalf of the inventors (T.D.P., J.W.S. and M.M.) on the system described here for multi-animal pose tracking. The remaining authors declare no competing interests.

Figures

Fig. 1
Fig. 1. SLEAP is a general-purpose multi-animal pose-tracking system.
a, Illustration of the part-localization problem. Single-animal pose estimation is equivalent to the landmark-localization task in which there exists a unique coordinate corresponding to each body part. b, Illustration of the part-grouping problem. In multi-animal pose estimation, there may be multiple detections of each body part, which must be grouped into sets that correspond to distinct animals. c, Illustration of the identity-tracking problem. In multi-animal pose tracking, pose detections must be associated with a unique animal ID that persists across frames. df, Diagram of the submodules in SLEAP, including all major machine learning system components: data annotation, data processing, model configuration (config), model training, model evaluation and inference. DLC, DeepLabCut; DPK, DeepPoseKit; COCO, common objects in context; I/O, input–output; train/val/test, training, validation and test; ops, operations. g, Diagram of SLEAP’s data model for describing the structure of both training annotations and predictions in multi-animal pose tracking. h, Example of SLEAP’s high-level API for data loading, model configuration, pose prediction and conversion to concrete numeric arrays. i, Diagram of development operations (DevOps) practices and components employed in SLEAP’s engineering workflow. CI, continuous integration; CD, continuous deployment. j, Diagram of the stack of open-source and modern software libraries that power functionality in SLEAP. IPC, inter-process communication.
Fig. 2
Fig. 2. SLEAP is fast, efficient and accurate.
a, Speed versus accuracy of different animal pose-estimation frameworks on a single-animal dataset. Points correspond to sampled measurements of batch-processing speed over 1,280 images with the highest-accuracy model replicate from each framework. Accuracy was evaluated on a held-out test set of 150 images. b, Speed versus batch size for multi-animal datasets. Points correspond to sampled measurements of batch-processing speed over 1,280 images and five replicates. OF, open field. c, Sample efficiency across multi-animal datasets. Points indicate accuracy of model training replicates on the held-out test set. dg, Body part-wise landmark-localization accuracy. Circles denote the 95th percentile of localization errors, and histograms correspond to full error distribution evaluated on held-out test sets (n = 150 frames for flies, n = 100 frames for mice). L, left; R, right; hi, hind; fr, front. Source data
Fig. 3
Fig. 3. Multi-animal pose-estimation approaches in SLEAP.
a, Workflow for the bottom–up approach. From left to right: a neural network takes an uncropped image as input and outputs confidence maps and PAFs; these are then used to detect body parts as local peaks in the confidence maps and score all potential connections between them; on the basis of connection scores, a matching algorithm then assigns the connections to distinct animal instances. b, Workflow for the top–down approach. From left to right: the first-stage neural network (NN) takes an uncropped image as input and outputs confidence maps for an anchor point on each animal; the anchors are detected as local peaks in the confidence maps (CMs); a centered crop is performed around each anchor point and provided as parallel inputs to the second-stage neural network; the network outputs confidence maps for all body parts only for the centered instance, which are then detected as global peaks. c, Speed versus accuracy of models trained using the two approaches across datasets. Points denote individual model replicates and accuracy evaluated on held-out test sets. Top–down models were evaluated here without TensorRT optimization for direct comparison to the bottom–up models. HC, home cage. d, Inference speed scaling with the number of animals in the frame for bottom–up models. Points correspond to sampled measurements of batch-processing speed (batch size of 16) over 1,280 images with the highest-accuracy model for each dataset. e, Inference speed scaling with the number of animals in the frame for top–down models. Points correspond to sampled measurements of batch-processing speed (batch size of 16) over 1,280 images with the highest-accuracy model for each dataset. Top–down models were evaluated here without TensorRT optimization for direct comparison to the bottom–up models. Source data
Fig. 4
Fig. 4. Neural network architectures are highly configurable in SLEAP.
a, Schematic of the general encoder–decoder neural network architecture, which is composed of standard blocks with different properties (bottom). b, Schematic of the modular version of UNet in SLEAP, which can be configured to control the maximum RF of the network by varying the number of downsampling blocks at the cost of more computations. px, pixels. c, Accuracy of UNets configured at different RFs across datasets. Points correspond to model training replicates, and the black line denotes the maximum accuracy achieved across all replicates (n = 3–5 per RF size per dataset, total of n = 115 models). Accuracy was evaluated on held-out test sets. d, Schematic of how SLEAP can use fixed network architectures as the encoder backbone to enable transfer learning. e, Accuracy of encoders with commonly used network architectures initialized with random or pretrained weights (transfer learning). Bars and error whiskers (mean and 95% confidence interval) correspond to top–down model training replicates (n = 3–5 per model architecture) on a held-out test set of the fly dataset. The gray line denotes the randomly initialized modular UNet baseline. MobileNetV1, MobileNet version 1. f, Speed versus accuracy comparison of the pretrained encoder and UNet model variants. Points correspond to average speed evaluated over 1,280 images for the most accurate model of each category. Accuracy was evaluated on the held-out test set of the fly dataset. Source data
Fig. 5
Fig. 5. Tracking and identification using temporal and appearance models in SLEAP.
a, Schematic of flow-shift tracking in which SLEAP associates poses across frames by using temporal context to predict where past poses will be in the current frame, allowing identities to be matched across time. b, ID-switching accuracy of flow-shift tracking over entire proofread datasets. Points correspond to ID-switching rate per 100,000 frames for individual videos in each dataset (n = 11.7 million frames over 87 videos for flies; n = 367,000 frames over 30 videos for mice). Bars and error whiskers correspond to mean and 95% confidence intervals. c, Schematic of the bottom–up ID approach, in which each distinct animal ID is treated as a class that is characterized by distinctive appearance features. d, Schematic of the top–down ID approach (only the second stage is shown), in which crops are used to predict confidence maps for the centered instance as well classification probabilities for matching instances to IDs (probability vector denotes with Pr[] in schematic). e, ID model accuracy across approaches and datasets. Points correspond to the fraction of animals identified correctly in each video in the held-out test sets (n = 150 frames for flies, n = 42 frames for gerbils). Bars and error whiskers correspond to the mean and 95% confidence intervals. f, Inference speed of each approach across datasets. Points correspond to sampled measurements of batch-processing speed over 1,280 images with the highest-accuracy model for each approach and dataset. The fastest batch size for each approach was selected (32, bottom–up; 16, top–down). Source data
Fig. 6
Fig. 6. SLEAP can detect social behavior for real-time control.
a, Schematic of hardware setup for detecting poses, calculating thorax–thorax distance and estimating round-trip latency through a DAQ loopback. PC, personal computer. b, Lag between online and offline distance traces estimates round-trip system latency. c, Distribution of round-trip system latency estimated by aligning 1-s segments between offline and online traces (mean = 71.0 ms, s.d. = 17.0 ms, n = 50,000 1-s segments). d, Distribution of end-to-end top–down ID model inference latency for single images (mean = 3.45 ms, s.d. = 0.16 ms, n = 1,280 images over five replicates). e, Hardware setup for detecting poses, trigger condition (male approach), optogenetic stimulation (of DNp13) and control of virgin female behavior (OE). f, Female behavioral response (change in OE length) to male approach-triggered optogenetic activation of DNp13 neurons expressing csChrimson (red) or in virgin WT females (green). The line and shaded regions denote mean and 95% confidence intervals (n = 48 bouts, DNp13; n = 282 bouts, WT). g, Distribution of latency from optogenetic (opto) stimulation onset to OE threshold, indicating the biological latency of the system (mean = 249.0 ms, s.d. = 148.1 ms, n = 48 bouts). h, Example closed-loop behavioral control event. From left to right: male in approach pose at condition trigger onset; optogenetic stimulation onset; start of female OE response to optogenetic stimulation; peak of female OE response with male still in close proximity. Source data
Extended Data Fig. 1
Extended Data Fig. 1. Datasets.
a, Single fly prealigned. b, Flies in 3D printed acoustic recording chamber. c, Bees in a behavioral chamber with honeycomb flooring. d, Mice in a home cage imaged from above. e, Mice in an open field chamber imaged from below. f, Gerbils in long-term monitoring home cage.
Extended Data Fig. 2
Extended Data Fig. 2. SLEAP labeling workflow.
a, Schematic of the SLEAP labeling workflow, from raw data to tracked videos. b, Screenshot of interactive SLEAP labeling interface. This interface can also be used for inspection and proofreading.
Extended Data Fig. 3
Extended Data Fig. 3. Troubleshooting workflows.
a, Schematics of starting stage workflows. Before the first training round, it is important to select the appropriate model type and adjust basic training parameters as needed. b, Schematics of early stage workflows. Poor performance is expected with few labeled frames, but certain types of errors may be mitigated by adjusting basic model parameters, such as receptive field size. c, Schematics of late stage workflows. Fine tuning performance once enough frames are labeled may be accomplished by trading off speed for accuracy, such as by increasing the resolution of the model features.
Extended Data Fig. 4
Extended Data Fig. 4. Receptive field sizes.
a, Receptive field sizes overlaid on example frame from flies dataset. b, Receptive field sizes overlaid on example frame from mice dataset. c, Receptive field sizes overlaid on example frame from bees dataset. Source data
Extended Data Fig. 5
Extended Data Fig. 5. Pretrained encoder backbone models.
a, Transfer learning performance across all tested pretrained encoder model architectures. Accuracy evaluated on held-out test set of flies dataset using the top-down approach (n = 2-5 models per architecture and condition; 125 total models). b, Speed versus accuracy trade-off across all tested pretrained encoder model architectures as compared to optimal UNet. Accuracy evaluated on held-out test set of flies dataset using the top-down approach. Model floating point operations (GFLOPS) derived directly from configured architectures (n = 2-5 models per architecture and condition; 68 total models). c, Relationship between inference speed and computations. Points correspond to speed of the best model replicate for each architecture. Line and shaded area denotes linear fit and 95% confidence interval. d, Accuracy of our implementation of DLC ResNet50 with different decoder architectures. Points denote model training replicates (n = 3-5 models per condition; 30 total models). Source data
Extended Data Fig. 6
Extended Data Fig. 6. SLEAP UNet versus DeepLabCut ResNet performance for multi-animal pose estimation.
a, Relative accuracy as a function of training time for flies and mice (OF) datasets. Accuracy evaluated on a held-out test set by using model checkpoints saved at every epoch (checkpointing time not included). Accuracy is normalized to the maximum accuracy (mAP) achieved over all epochs. b, Summary of training efficiency across different model types and datasets. Time is the minimum training time from (a) required to reach 90% peak accuracy. c, Speed versus accuracy trade-off of using SLEAP UNet versus DLC ResNet models for multi-instance pose estimation. Points denote benchmark replicates and lines connect means per condition. DLC ResNet in all panels refers to an implementation of a ResNet50-based architecture configured to mimic the default configuration in DeepLabCut.

Comment in

References

    1. Altmann J. Observational study of behavior: sampling methods. Behaviour. 1974;49:227–267. doi: 10.1163/156853974X00534. - DOI - PubMed
    1. Datta SR, Anderson DJ, Branson K, Perona P, Leifer A. Computational neuroethology: a call to action. Neuron. 2019;104:11–24. doi: 10.1016/j.neuron.2019.09.038. - DOI - PMC - PubMed
    1. Pereira, T. D., Shaevitz, J. W. & Murthy, M. Quantifying behavior to understand the brain. Nat. Neurosci.23, 1537–1549 (2020). - PMC - PubMed
    1. Christin S, Hervet É, Lecomte N. Applications for deep learning in ecology. Methods Ecol. Evol. 2019;10:1632–1644. doi: 10.1111/2041-210X.13256. - DOI
    1. Mathis A, et al. DeepLabCut: markerless pose estimation of user-defined body parts with deep learning. Nat. Neurosci. 2018;21:1281–1289. doi: 10.1038/s41593-018-0209-y. - DOI - PubMed

Publication types