. 2022 Sep;40(9):1378-1387.
doi: 10.1038/s41587-022-01256-8. Epub 2022 Apr 4.

CRISPR-free base editors with enhanced activity and expanded targeting scope in mitochondrial and nuclear DNA

Affiliations

CRISPR-free base editors with enhanced activity and expanded targeting scope in mitochondrial and nuclear DNA

Beverly Y Mok et al. Nat Biotechnol. 2022 Sep.

Abstract

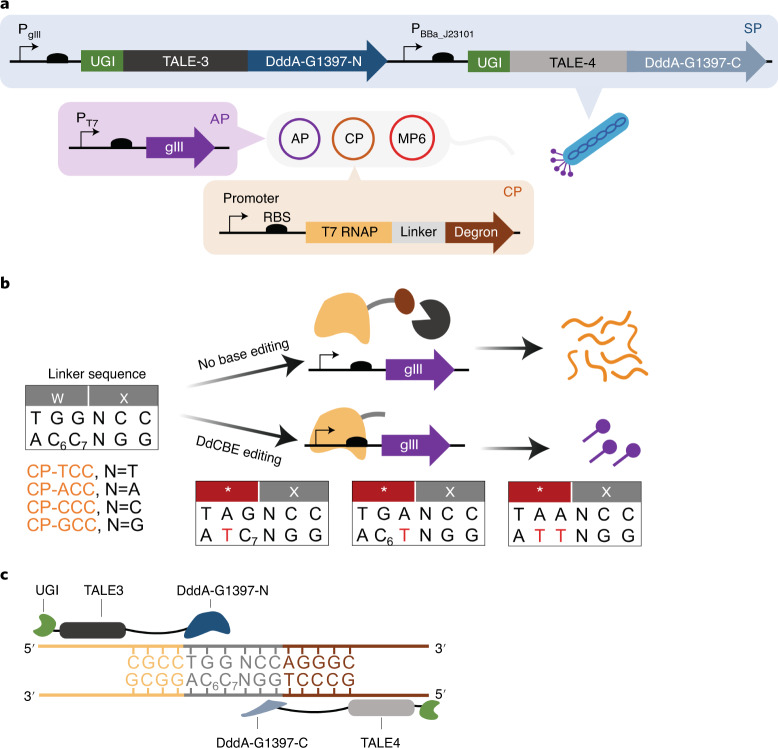
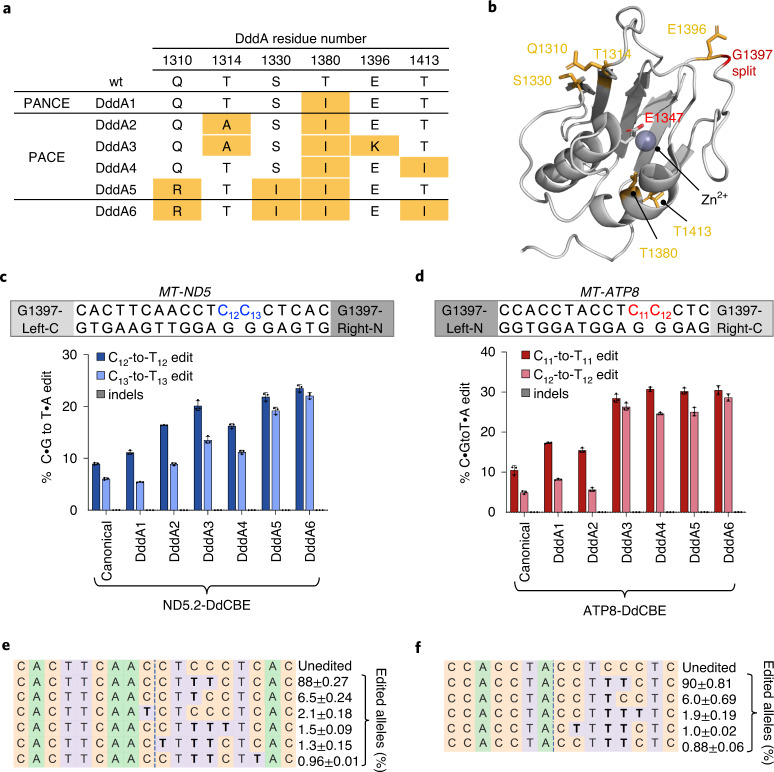
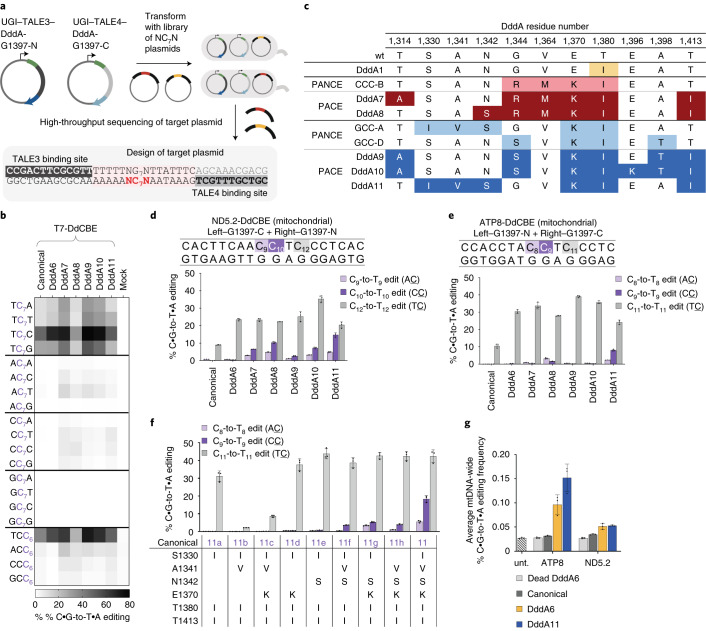
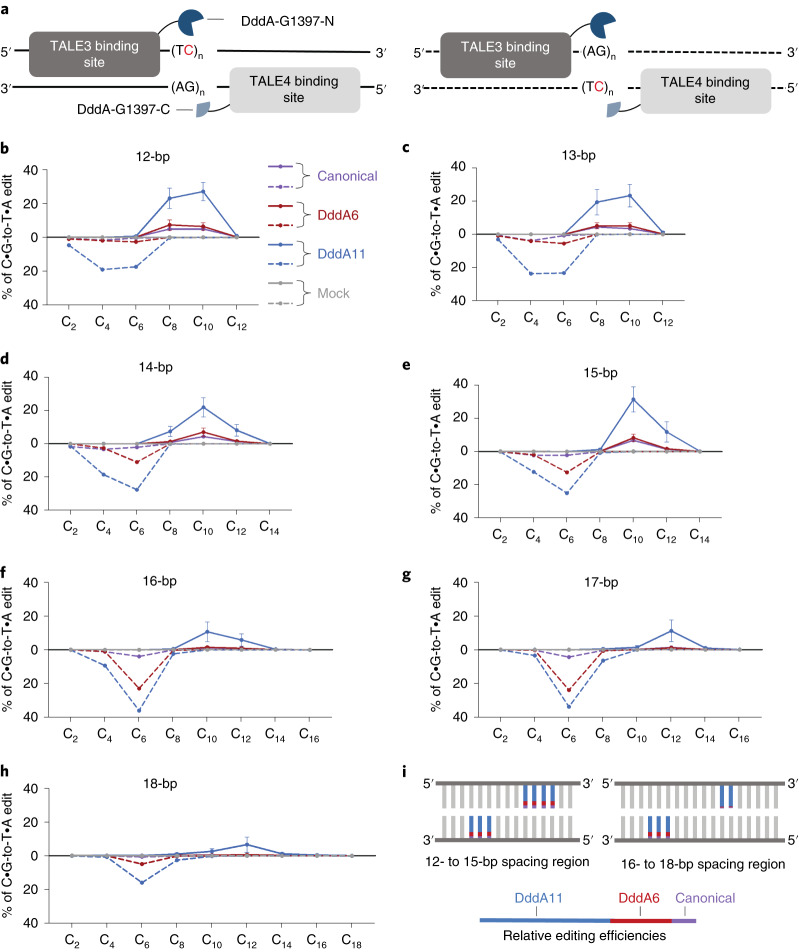
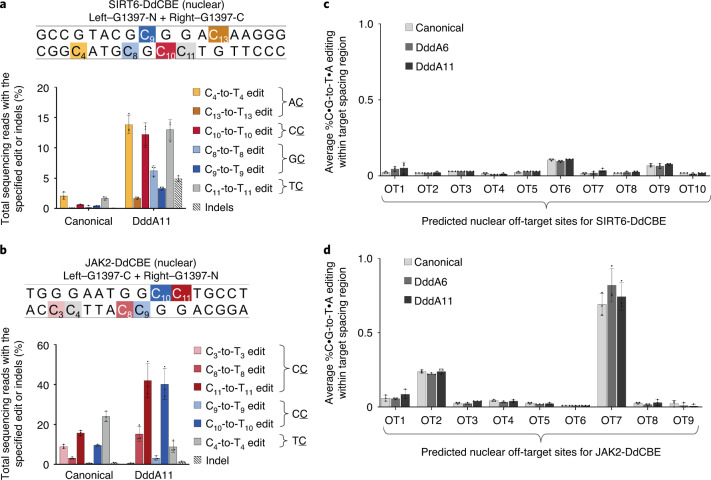
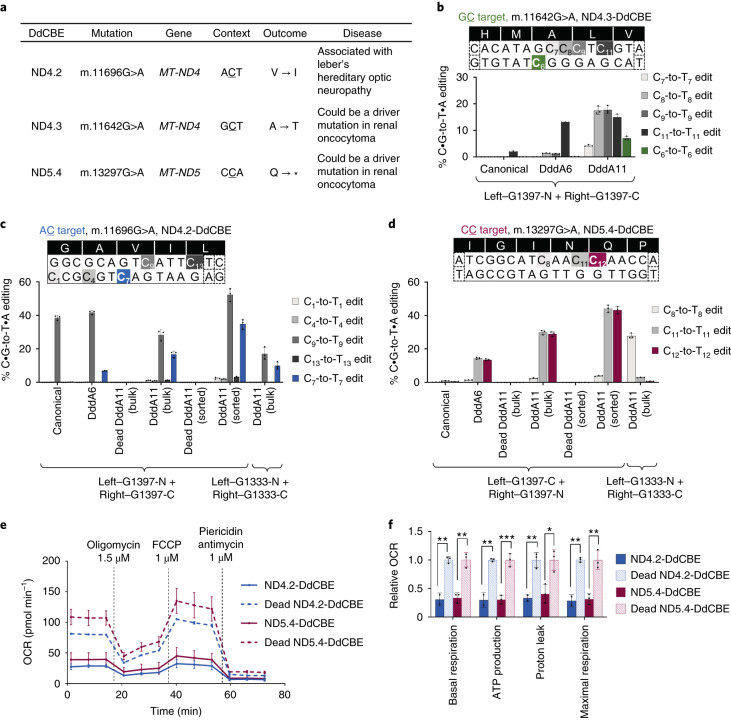
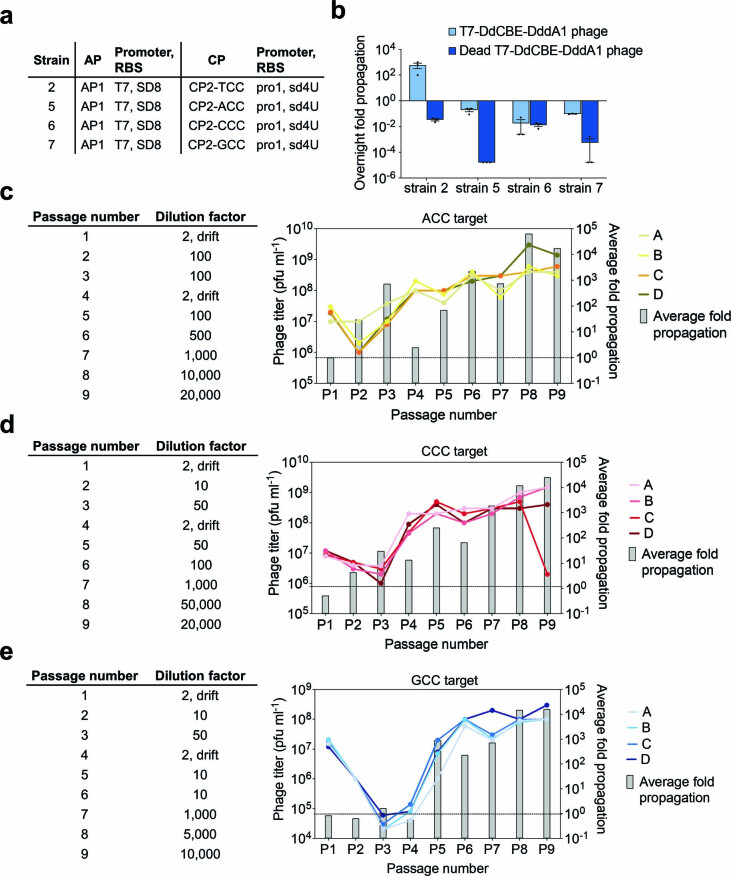
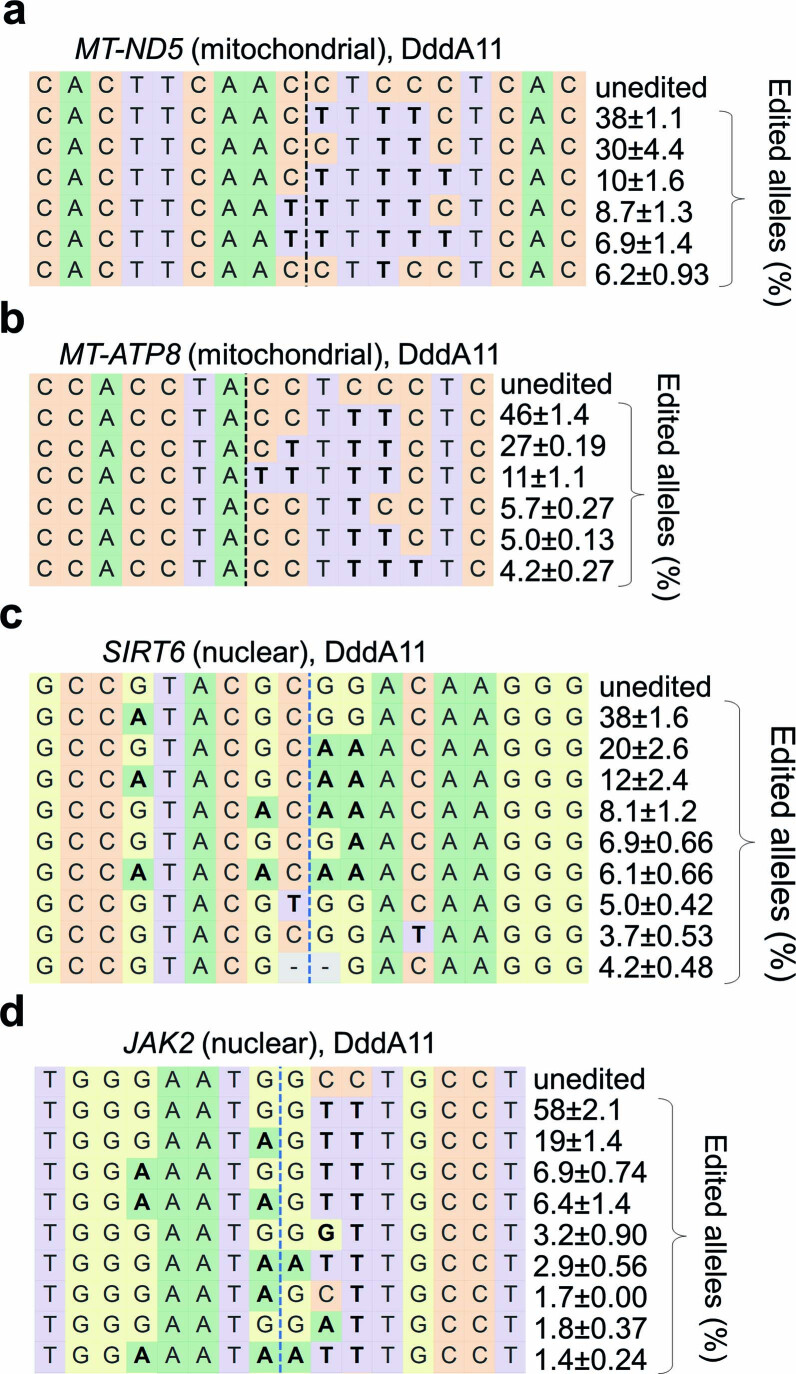
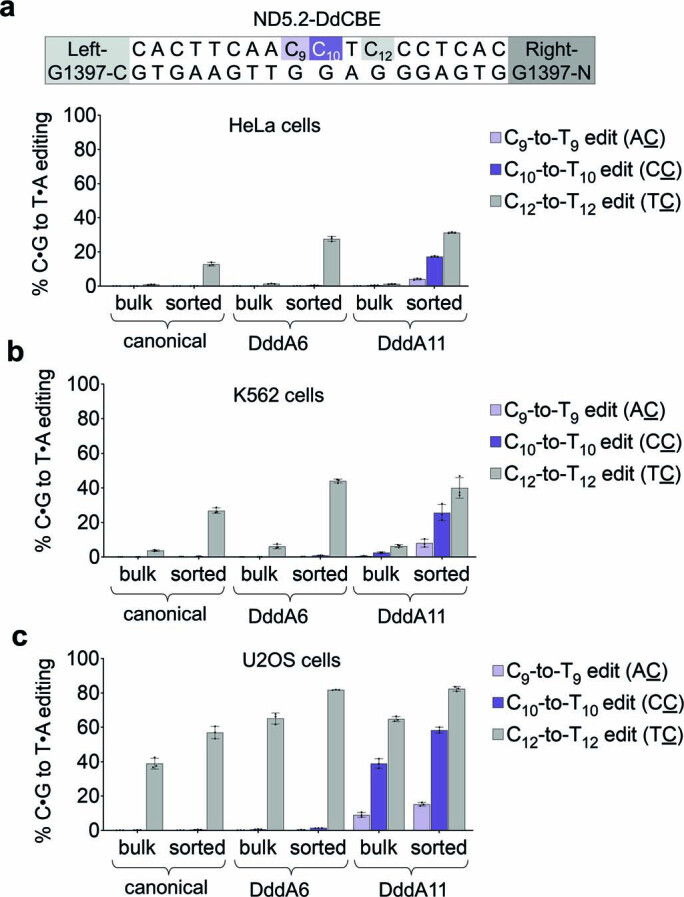
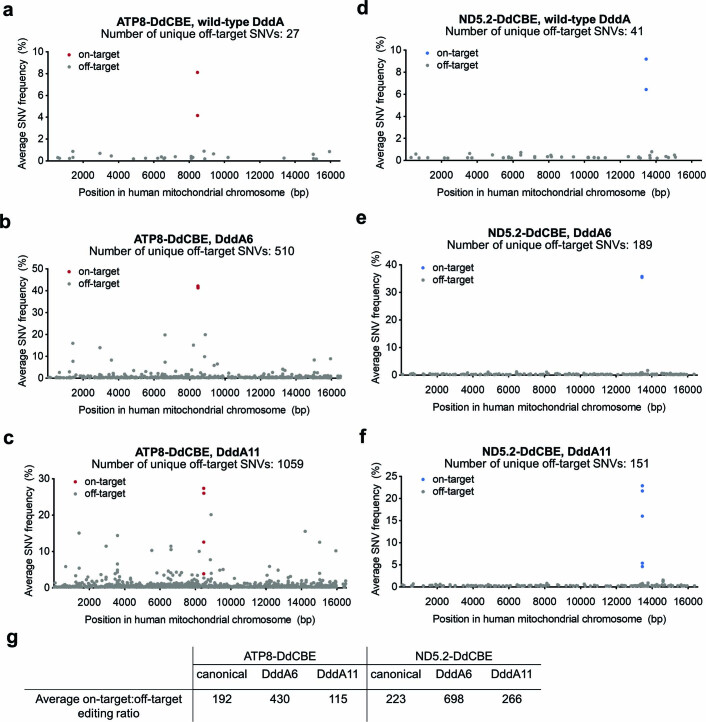
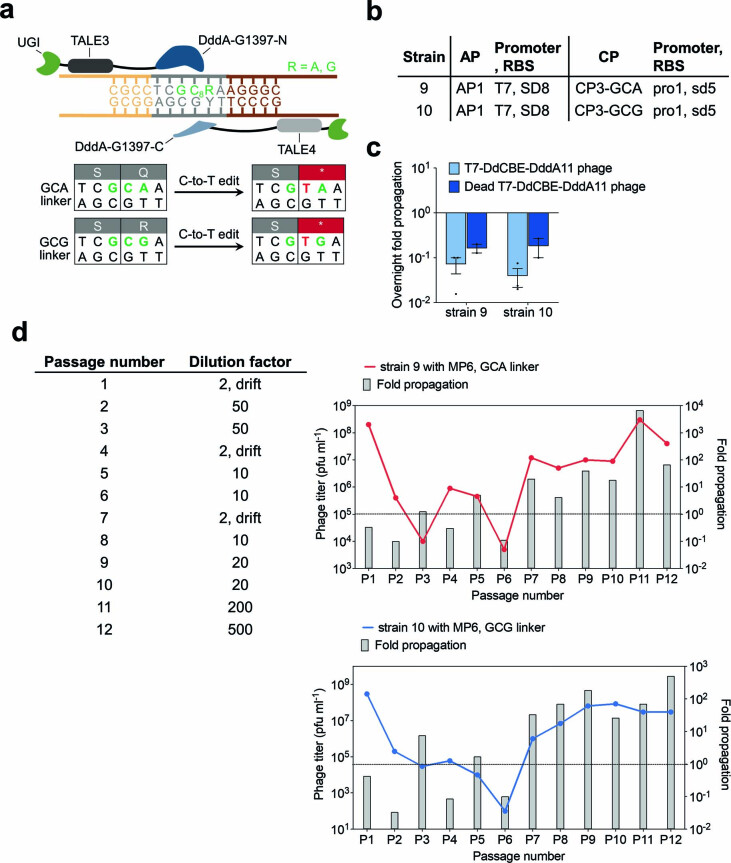
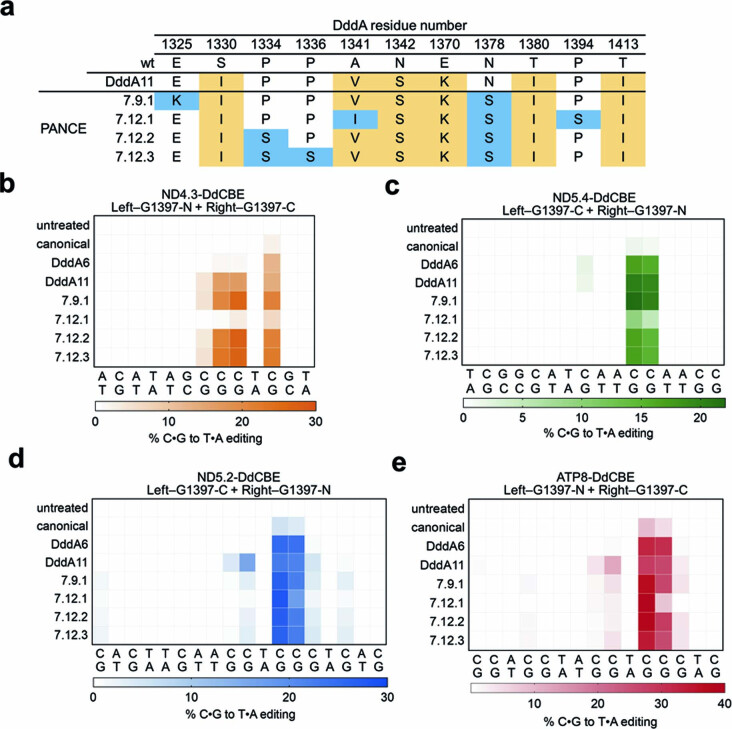
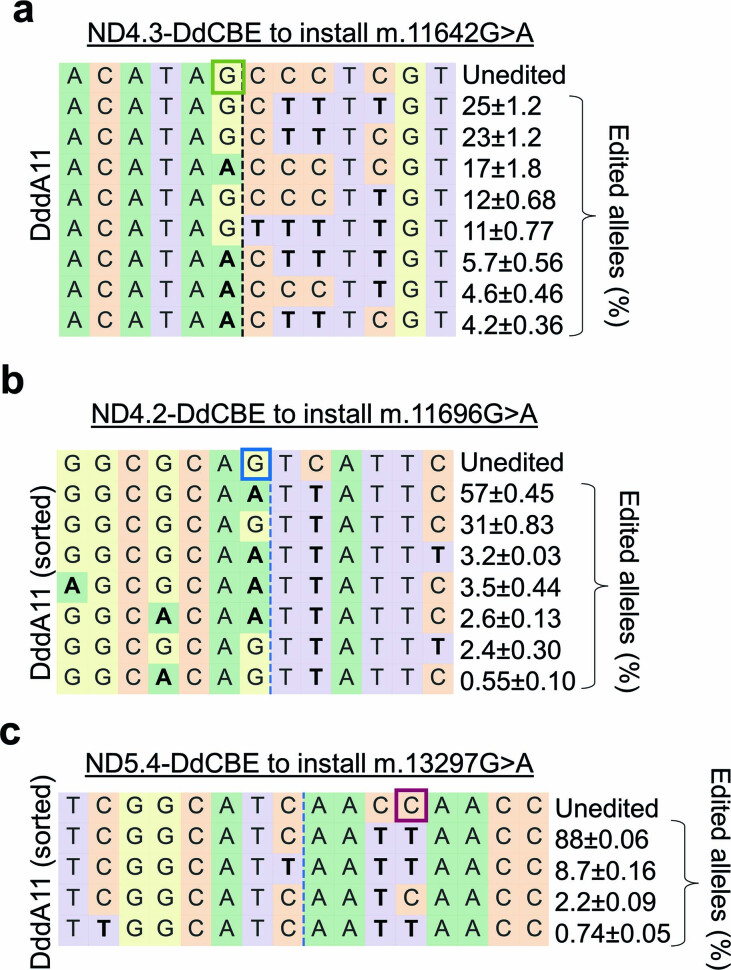
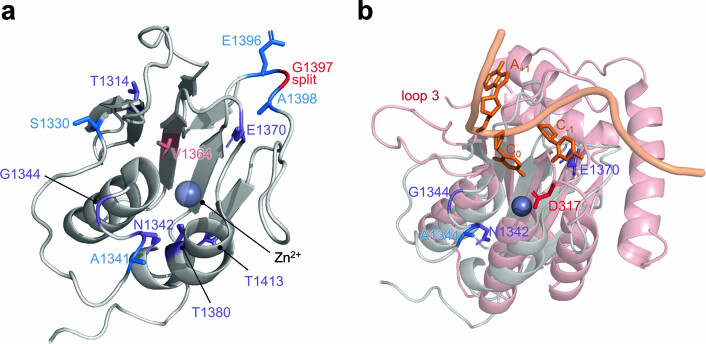
The all-protein cytosine base editor DdCBE uses TALE proteins and a double-stranded DNA-specific cytidine deaminase (DddA) to mediate targeted C•G-to-T•A editing. To improve editing efficiency and overcome the strict TC sequence-context constraint of DddA, we used phage-assisted non-continuous and continuous evolution to evolve DddA variants with improved activity and expanded targeting scope. Compared to canonical DdCBEs, base editors with evolved DddA6 improved mitochondrial DNA (mtDNA) editing efficiencies at TC by 3.3-fold on average. DdCBEs containing evolved DddA11 offered a broadened HC (H = A, C or T) sequence compatibility for both mitochondrial and nuclear base editing, increasing average editing efficiencies at AC and CC targets from less than 10% for canonical DdCBE to 15-30% and up to 50% in cell populations sorted to express both halves of DdCBE. We used these evolved DdCBEs to efficiently install disease-associated mtDNA mutations in human cells at non-TC target sites. DddA6 and DddA11 substantially increase the effectiveness and applicability of all-protein base editing.


Conflict of interest statement

The authors declare competing financial interests: B.Y.M., A.R. and D.R.L have filed patent applications on this work. D.R.L. is a consultant for Prime Medicine, Beam Therapeutics, Pairwise Plants, Chroma Medicine, and Resonance Medicine, which are companies that use genome editing, genome engineering, or PACE, and owns equity in these companies. V.K.M. is a consultant to 5am Ventures and Janssen Pharmaceuticals. Direct correspondence to drliu@fas.harvard.edu.

Figures

Fig. 1
Fig. 1. Phage-assisted evolution of DddA-derived cytosine base editor for improved activity and expanded targeting scope.
a, Selection to evolve DdCBE using PANCE and PACE. An AP (purple) contains gIII driven by the T7 promoter. The CP (orange) expresses a T7 RNAP–degron fusion. The evolving T7-DdCBE containing DddA split at G1397 is encoded in the SP (blue). Where relevant, the promoters are indicated. b, A 2-amino-acid linker connects T7 RNAP to the degron. The linker sequence contains cytidines C6 and C7 that are targets for DdCBE editing. The nucleotide at position 8 can be varied to T, A, C or G to form plasmids CP-TCC, CP-ACC, CP-CCC and CP-GCC, respectively. In the absence of target C-to-T editing, expression of degron (brown) results in proteolysis of T7 RNAP (orange) and inhibition of gIII expression. Active T7-DdCBE edits one or both target cytidines to install a stop codon (*) within the linker, thus restoring active T7 RNAP to mediate gIII expression. c, Architecture of T7-DdCBE and the 15-bp target spacing region. Nucleotides corresponding to DNA sequences within T7 RNAP, linker and degron genes are colored in orange, gray and brown, respectively.
Fig. 2
Fig. 2. Evolved DddA variants improve mitochondrial base editing activity at 5′-TC.
a, Mutations within the DddA gene of T7-DdCBE. Variants were isolated after evolution of canonical T7-DdCBE using PANCE and PACE in strain 4 transformed with MP6 (Extended Data Fig. 1a). DddA6 was rationally designed by incorporating the T1413I mutation into DddA5. b, Crystal structure of DddA (gray, PDB 6U08) complexed with DddI immunity protein (not shown). Positions of mutations enriched after PANCE and PACE are colored in orange. The catalytic residue E1347 is shown. DddA was split at G1397 (red) to generate T7-DdCBE. c, d, mtDNA editing efficiencies and indel frequencies of HEK293T cells treated with ND5.2-DdCBE (c) or ATP8-DdCBE (d). The genotypes of DddA variants correspond to a. For each base editor, the DNA spacing region, target cytosines and DddA split orientation are shown. e, Frequencies of MT-ND5 alleles produced by DddA6 in c. f, Frequencies of MT-ATP8 alleles produced by DddA6 in d. For e and f, tables are representative of n = 3 independent biological replicates. For cf, values and errors reflect the mean ± s.d. of n = 3 independent biological replicates.
Fig. 3
Fig. 3. Evolved DddA variants show enhanced editing at TC and non-TC target sequences in mtDNA.
a, Bacterial plasmid assay to profile sequence preferences of evolved DddA variants. T7-DdCBE edits the NC7N sequence of the target plasmid library. b, Heat map showing C•G-to-T•A editing efficiencies of NC7N sequence in each target plasmid, including the second cytosine in NCC6 sequences. Genotypes of listed variants correspond to Figs. 2a and 3c. Mock-treated cells did not express T7-DdCBE and contained only the library of target plasmids. Shading levels reflect the mean of n = 3 independent biological replicates. c, Genotypes of DddA variants after evolving T7-DdCBE-DddA1 using context-specific PANCE and PACE. Mutations enriched for activity on a CCC linker or GCC linker are highlighted in red and blue, respectively. d, e, Mitochondrial C•G-to-T•A editing efficiencies of HEK293T cells treated with canonical and evolved variants of ND5.2-DdCBE (d) or ATP8-DdCBE (e). Target spacing regions and split DddA orientations are shown for each base editor. Cytosines highlighted in light purple and dark purple are in non-TC contexts. f, Mitochondrial base editing efficiencies of reversion mutants from ATP8-DdCBE-DddA11 (labeled as 11) in HEK293T cells. Reversion mutants are designated 11a–11h. Amino acids that differ from those in canonical ATP8-DdCBE are indicated, so the absence of an amino acid indicates a reversion to the corresponding canonical amino acid in the first column. g, Average percentage of genome-wide C•G-to-T•A off-target editing in mtDNA for indicated DdCBE and controls in HEK293T cells. For dg, values and error bars reflect the mean ± s.d. of n = 3 independent biological replicates.
Fig. 4
Fig. 4. Editing windows of canonical and evolved T7-DdCBE.
a, Split orientation of T7-DdCBE and its target spacing region. Each spacing region contains TC repeats within the top strand (left, solid line) or bottom strand (right, dashed line). Lengths of spacing regions ranged from 12 bp to 18 bp. bh, Editing efficiencies mediated by canonical DdCBE (purple), DddA6-containing DdCBE (red) and DddA11-containing DdCBE (blue) are shown for each cytosine positioned within the spacing region length of 12 bp (b), 13 bp (c), 14 bp (d), 15 bp (e), 16 bp (f), 17 bp (g) and 18 bp (h). Subscripted numbers refer to the positions of cytosines in the spacing region, counting the DNA nucleotide immediately after the binding site of TALE3 as position 1. Editing efficiencies associated with the top and bottom strand are shown as solid and dashed lines, respectively. Mock-treated cells contained only the library of target plasmids (gray). For bh, values and error bars reflect the mean ± s.d. of n = 3 independent biological replicates. i, Approximate editing windows for canonical (purple), DddA6 (red) and DddA11 (blue) variants of T7-DdCBE containing the G1397 split. The length of each colored line reflects the approximate relative editing efficiency for each DddA variant.
Fig. 5
Fig. 5. DddA11 expands targeting scope for nuclear DNA editing.
a, b, Nuclear DNA editing efficiencies of HEK293T cells treated with the canonical or DddA11 variant of SIRT6-DdCBE (a) or JAK2-DdCBE (b). Target spacing regions and split DddA orientations are shown for each base editor. Cytosines highlighted in yellow, red or blue are in AC, CC or GC contexts, respectively. The architecture of each nuclear DdCBE half is bpNLS–2xUGI–4-amino-acid linker–TALE–[DddA half]. bpNLS, bipartite nuclear localization signal. c, d, Average frequencies of all possible C•G-to-T•A conversions within a predicted off-target spacing region associated with SIRT6-DdCBE (a) and JAK2-DdCBE (b). See Supplementary Table 6 for ranking of predicted off-target sites and Supplementary Table 8 for off-target site amplicons. For ad, values and error bars reflect the mean ± s.d. of n = 3 independent biological replicates.
Fig. 6
Fig. 6. Application of DddA11 variant to install pathogenic mutations at non-TC targets in HEK293T cells.
a, Use of DdCBEs to install disease-associated target mutations in human mtDNA. (V, valine; I, isoleucine; A, alanine; T, threonine; Q, glutamine; ∗, stop). bd, Mitochondrial base editing efficiencies of HEK293T cells treated with canonical or evolved ND4.3-DdCBE (b), ND4.2-DdCBE (c) and ND5.4-DdCBE (d). On-target cytosines are colored green, blue or red, respectively. Cells expressing the DddA11 variant of DdCBE were isolated by FACS for high-throughput sequencing. The split orientation, target spacing region and corresponding encoded amino acids are shown. Nucleotide sequences boxed in dotted lines are part of the TALE binding site. e, f, Oxygen consumption rate (OCR) (e) and relative values of respiratory parameters (f) in sorted HEK293T cells treated with the DddA11 variant of ND4.2-DdCBE or ND5.4-DdCBE. For bf, values and error bars reflect the mean ± s.d. of n = 3 independent biological replicates, except that ND4.2-DdCBE in e and f reflects n = 2 independent biological replicates. *P < 0.05, **P < 0.01 and ***P < 0.001 by Student’s unpaired two-tailed t-test.
Extended Data Fig. 1
Extended Data Fig. 1. Evolution of canonical T7-DdCBE for improved TC activity using PANCE.
a, Strains for screening selection stringency. Strains were generated by transformation with a variant of an AP and a variant of a CP. All CPs encode a TCC linker. Relative RBS strengths of SD8, sd8, sd2 and sd4U are 1.0, 0.20, 0.010 and 0.00040, respectively. b, Overnight phage propagation of indicated SPs in host strains with increasing stringencies. Dead T7-DdCBE phage contained the catalytically inactivating E1347A mutation in DddA. The fold phage propagation is the output phage titer divided by the input titer. c, Phage passage schedule for canonical T7-DdCBE evolution in PANCE using strain 4 transformed with MP6. Table indicates the dilution factor for the input phage population. Output phage titers for each replicate (A, B, C and D) are shown for each passage. Average fold propagation was obtained by averaging the fold propagation obtained from the four replicates A-D. d, Mitochondrial base editing efficiencies of HEK293T cells treated with canonical DdCBE or with DdCBEs containing the indicated mutations within DddA. For each base editor, the DddA split orientation and target cytosine (purple) within the spacing region is indicated. For b and d, values and error bars reflect the mean±s.d of n = 3 independent biological replicates.
Extended Data Fig. 2
Extended Data Fig. 2. DddA6 is compatible with split-G1333 and split-G1397 DdCBE orientations.
a-d, Mitochondrial base editing efficiencies of HEK293T cells treated with (a) ND1.1-DdCBE, (b) ND1.2-DdCBE, (c) ND2-DdCBE and (d) ND4-DdCBE. Target spacing regions and split DddA orientations are shown above each plot. Values and error bars reflect the mean±s.d of n = 3 independent biological replicates.
Extended Data Fig. 3
Extended Data Fig. 3. Evolution of DddA1-containing T7-DdCBE for expanded targeting scope using PANCE.
a, Strains for overnight phage propagation assays on non-TC linker substrates. b, Overnight fold propagation of indicated SP in host strains encoding TC or non-TC linkers. Strains correspond to Extended Data Fig. 3a. T7-DdCBE-DddA1 phage harbors a T1380I mutation in DddA. Dead T7-DdCBE-DddA1 phage contains an additional catalytically inactivating E1347A mutation in DddA. Values and error bars reflect the mean±s.d of n = 3 independent biological replicates. c-e, Phage passage schedule for T7-DdCBE-DddA1 evolution in PANCE using (c) strain 5 transformed with MP6, (d) strain 6 transformed with MP6 or (e) strain 7 transformed with MP6. Tables indicate the dilution factor for the input phage population (see Methods for drifting procedure) For a given linker target, the output phage titers for each replicate (A, B, C and D) are shown for each passage. Average fold propagations above the dotted line in each graph represent propagation >1-fold. Average fold propagation was obtained by averaging the fold propagation obtained from the four replicates.
Extended Data Fig. 4
Extended Data Fig. 4. Allele compositions from mitochondrial and nuclear editing by DddA11-containing DdCBEs.
a, Frequencies of mitochondrial MT-ND5 alleles produced by DddA11 variant of ND5.2-DdCBE. b, Frequencies of mitochondrial MT-ATP8 alleles produced by DddA11 variant of ATP8-DdCBE. c, Frequencies of nuclear SIRT6 alleles produced by DddA11 variant of SIRT6-DdCBE. d, Frequencies of nuclear JAK2 alleles produced by DddA11 variant of JAK2-DdCBE. Each table is representative of n = 3 independent biological replicates. Values and errors reflect the mean±s.d of n = 3 independent biological replicates.
Extended Data Fig. 5
Extended Data Fig. 5. Evolved DddA variants mediate mitochondrial base editing in multiple human cell lines.
a-c, Mitochondrial DNA editing efficiencies of canonical and evolved ND5.2-DdCBE in (a) HeLa cells, (b) K562 cells, and (c) U2OS cells. Editing efficiencies were measured for unsorted cells (bulk) and isolated DdCBE-expressing cells (sorted). Target spacing region and split DddA orientation are shown. Cytosines highlighted in light purple and dark purple are in non-TC contexts. Values and error bars reflect the mean±s.d of n = 3 independent biological replicates.
Extended Data Fig. 6
Extended Data Fig. 6. Mitochondrial genome-wide off-target C•G-to-T•A mutations.
Average frequency and mitochondrial genome position of each unique C•G-to-T•A single nucleotide variant (SNV) is shown for HEK293T cells treated with (a) canonical ATP8-DdCBE, (b) ATP8-DdCBE containing DddA6, (c) ATP8-DdCBE containing DddA11, (d) canonical ND5.2-DdCBE, (e) ND5.2-DdCBE containing DddA6 and (f) ND5.2-DdCBE containing DddA11. g, Ratio of average on-target:off-target editing for the indicated canonical and evolved DdCBE. The ratio was calculated for each treatment condition as: (average frequency of all on-target C•G base pairs)÷(average frequency of non-target C•G base pairs present in the mitochondrial genome).
Extended Data Fig. 7
Extended Data Fig. 7. Evolution of T7-DdCBE-DddA11 using PANCE for improved GC activity.
a, The sequence encoding the T7 RNAP–degron linker was modified to contain GCA or GCG in an effort to evolve for higher activity on GC targets. T7-DdCBE must convert GC8 to GT8 to install a stop codon in the linker sequence and restore T7 RNAP activity. b, Strains for overnight phage propagation assays on GCA or GCG linkers. c, Overnight fold propagation of indicated SP in host strains encoding GCA or GCG linkers. Strains correspond to Extended Data Fig. 7b. T7-DdCBE-DddA11 phage contains the mutations S1330I, A1341V, N1342S, E1370K, T1380I and T1413I in DddA. Dead T7-DdCBE-DddA11 phage contains an additional inactivating E1347A mutation in DddA. Values and error bars reflect the mean±s.d of n = 3 independent biological replicates. d, Phage passage schedule for T7-DdCBE-DddA11 evolution in PANCE using strain 9 transformed with MP6 (red) or strain 10 transformed with MP6 (blue). The table indicates the dilution factor for the input phage population (see Methods for drifting procedure). Output phage titer and fold propagation are shown for a single replicate. Fold propagations above the dotted line in each graph represent propagation >1-fold.
Extended Data Fig. 8
Extended Data Fig. 8. Mitochondrial editing efficiencies of DdCBE variants evolved from GC-specific PANCE.
a, Enriched mutations within the DddA gene of T7-DdCBE after PANCE against a GCA or GCG linker. T7-DdCBE-DddA11 was used as the input SP for PANCE. DddA mutations in the input SP are shown in beige. Mutations enriched after 9 or 12 PANCE passages are shown in blue. b-e, Heat maps of mitochondrial base editing efficiencies of HEK293T cells treated with canonical and evolved variants of (b) ND4.3-DdCBE, (c) ND5.4-DdCBE (d) ND5.2-DdCBE and (e) ATP8-DdCBE. Target spacing regions and split DddA orientations are shown for each base editor. For b-e, colors reflect the mean of n = 3 independent biological replicates.
Extended Data Fig. 9
Extended Data Fig. 9. Allele compositions at disease-relevant mtDNA sites in HEK293T cells following base editing by DddA11-containing DdCBE variants.
a-c, Allele frequency table of HEK293T cells treated with DddA11-containing (a) ND4.3-DdCBE, (b) ND4.2-DdCBE and (c) ND5.4-DdCBE to install the non-TC mutations m.11642 G > A, m.11696 > A and m.13297 G > A, respectively. On-target cytosines are boxed. Each table is representative of n = 3 independent biological replicates. Values and errors reflect the mean±s.d of n = 3 independent biological replicates.
Extended Data Fig. 10
Extended Data Fig. 10. Structural alignment of DddA with ssDNA-bound APOBEC3G.
a, Crystal structure of DddA (grey, PDB 6U08) complexed with DddI immunity protein (not shown). Positions of mutations common to the CCC- and GCC-specific evolutions are colored in purple. Additional mutations are colored according to Fig. 3c. DddA was split at G1397 (red) to generate T7-DdCBE for PANCE and PACE. b, DddA (PDB 6UO8, grey) was aligned to the catalytic domain of APOBEC3G (PDB 2KBO, red) complexed to its ssDNA 5’-CCA substrate (orange) using Pymol. The target C undergoing deamination by APOBEC3G is indicated as C0. Reversion analysis on the DddA11 mutant indicated that A1341V, N1342S and E1370K are critical for expanding the targeting scope of DddA (see Fig. 3f). D317 (red) confers 5’-CC specificity in APOBEC3G and loop 3 controls the catalytic activity of the APOBEC3G.

References

    1. Bruser C, Keller-Findeisen J, Jakobs S. The TFAM-to-mtDNA ratio defines inner-cellular nucleoid populations with distinct activity levels. Cell Rep. 2021;37:110000. doi: 10.1016/j.celrep.2021.110000. - DOI - PubMed
    1. Kukat C, et al. Super-resolution microscopy reveals that mammalian mitochondrial nucleoids have a uniform size and frequently contain a single copy of mtDNA. Proc. Natl Acad. Sci. USA. 2011;108:13534–13539. doi: 10.1073/pnas.1109263108. - DOI - PMC - PubMed
    1. Robin ED, Wong R. Mitochondrial DNA molecules and virtual number of mitochondria per cell in mammalian cells. J. Cell. Physiol. 1988;136:507–513. doi: 10.1002/jcp.1041360316. - DOI - PubMed
    1. Yuan Y, et al. Comprehensive molecular characterization of mitochondrial genomes in human cancers. Nat. Genet. 2020;52:342–352. doi: 10.1038/s41588-019-0557-x. - DOI - PMC - PubMed
    1. Schapira AH. Mitochondrial diseases. Lancet. 2012;379:1825–1834. doi: 10.1016/S0140-6736(11)61305-6. - DOI - PubMed

Publication types