. 2022 Apr;25(4):458-473.
doi: 10.1038/s41593-022-01043-3. Epub 2022 Apr 4.

Impaired neurogenesis alters brain biomechanics in a neuroprogenitor-based genetic subtype of congenital hydrocephalus

Phan Q Duy #  1   2   3 Stefan C Weise #  4 Claudia Marini  5 Xiao-Jun Li  6   7 Dan Liang  1 Peter J Dahl  8   9 Shaojie Ma  1 Ana Spajic  1 Weilai Dong  10 Jane Juusola  11 Emre Kiziltug  2 Adam J Kundishora  2 Sunil Koundal  12 Maysam Z Pedram  12 Lucia A Torres-Fernández  4 Kristian Händler  13   14   15 Elena De Domenico  13   14   15 Matthias Becker  13   14   15 Thomas Ulas  13   14   15 Stefan A Juranek  16 Elisa Cuevas  17 Le Thi Hao  2 Bettina Jux  4 André M M Sousa  1 Fuchen Liu  1 Suel-Kee Kim  1 Mingfeng Li  1 Yiying Yang  18 Yutaka Takeo  2 Alvaro Duque  1 Carol Nelson-Williams  19 Yonghyun Ha  20 Kartiga Selvaganesan  20 Stephanie M Robert  2 Amrita K Singh  2 Garrett Allington  2 Charuta G Furey  2 Andrew T Timberlake  19 Benjamin C Reeves  2 Hannah Smith  2 Ashley Dunbar  2 Tyrone DeSpenza Jr  2 June Goto  21 Arnaud Marlier  2 Andres Moreno-De-Luca  22 Xin Yu  23 William E Butler  23 Bob S Carter  23 Evelyn M R Lake  20 R Todd Constable  20 Pasko Rakic  1 Haifan Lin  18 Engin Deniz  24 Helene Benveniste  12 Nikhil S Malvankar  8   9 Juvianee I Estrada-Veras  25   26   27 Christopher A Walsh  28   29   30 Seth L Alper  30   31 Joachim L Schultze  13   14   15 Katrin Paeschke  16 Angelika Doetzlhofer  6   7 F Gregory Wulczyn  5 Sheng Chih Jin  32 Richard P Lifton  10 Nenad Sestan  1 Waldemar Kolanus  4 Kristopher T Kahle  33   34   35   36
Affiliations

Impaired neurogenesis alters brain biomechanics in a neuroprogenitor-based genetic subtype of congenital hydrocephalus

Phan Q Duy et al. Nat Neurosci. 2022 Apr.

Abstract

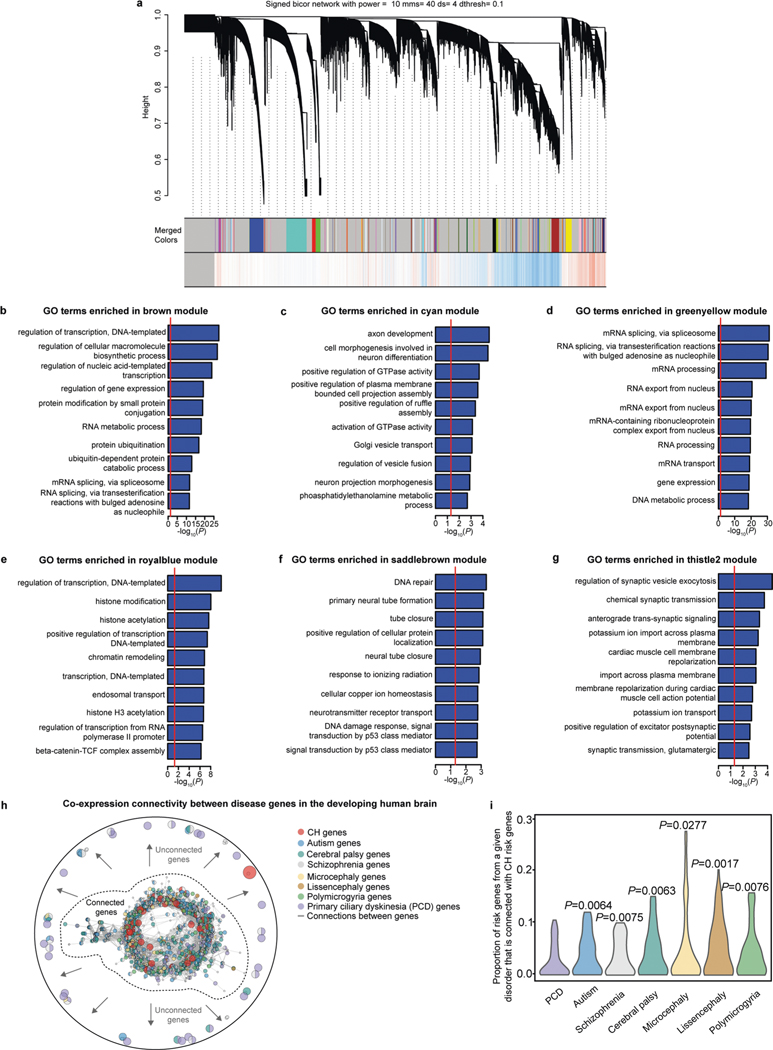
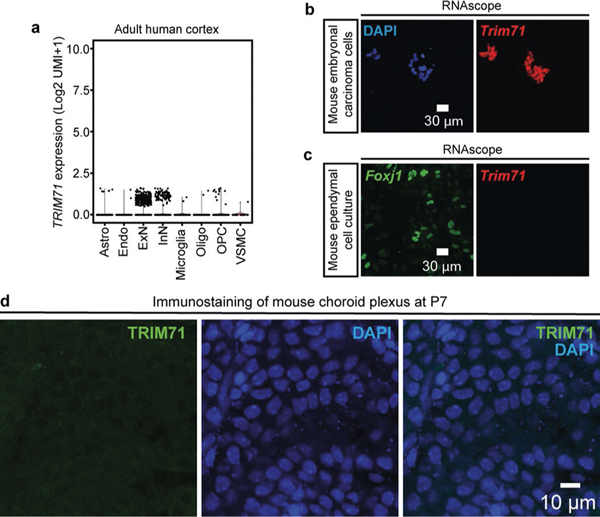
Hydrocephalus, characterized by cerebral ventricular dilatation, is routinely attributed to primary defects in cerebrospinal fluid (CSF) homeostasis. This fosters CSF shunting as the leading reason for brain surgery in children despite considerable disease heterogeneity. In this study, by integrating human brain transcriptomics with whole-exome sequencing of 483 patients with congenital hydrocephalus (CH), we found convergence of CH risk genes in embryonic neuroepithelial stem cells. Of all CH risk genes, TRIM71/lin-41 harbors the most de novo mutations and is most specifically expressed in neuroepithelial cells. Mice harboring neuroepithelial cell-specific Trim71 deletion or CH-specific Trim71 mutation exhibit prenatal hydrocephalus. CH mutations disrupt TRIM71 binding to its RNA targets, causing premature neuroepithelial cell differentiation and reduced neurogenesis. Cortical hypoplasia leads to a hypercompliant cortex and secondary ventricular enlargement without primary defects in CSF circulation. These data highlight the importance of precisely regulated neuroepithelial cell fate for normal brain-CSF biomechanics and support a clinically relevant neuroprogenitor-based paradigm of CH.


Conflict of interest statement

Competing interests

J.J. is an employee of GeneDx, Inc.

Figures

Extended Data Fig. 1 |
Extended Data Fig. 1 |. Integrative genomic analysis of CH genetic risk.
a) Heatmap showing expression of CH risk genes across developmental timepoints and regions of the developing human brain. Analyzed transcriptomic dataset from. b) Enrichment of CH risk genes across developmental timepoints of the human brain in a microarray dataset of the human brain from. PCW: post-conception week, M: month, Y: year. Boxplot (in f): median (line), 25th and 75th percentiles (box), whiskers extend up to 1.5 times the interquartile range from the top (bottom) of the box to the furthest datum within that distance. Significance was calculated by comparing to background expression using one-sided Wilcoxon rank sum test. For detailed statistical information, see Supplementary Table 13. c-e) CH risk gene network connectivity in different layers of the prenatal human frontal neocortex. Analyzed transcriptomic dataset from. c) VZ- and SVZi-specific CH risk gene interaction networks have the highest average connectivity per interaction. d-e) VZ (d) and SVZi (e) have significantly higher CH risk gene interaction network connectivity than expected by chance. The red line indicates the observed connectivity, and the gray histogram shows the null distribution from 1,000 permutations. P values were calculated by permutation tests (see Methods). f) Heatmap showing maximal expression of CH risk genes across different cell types of the developing human cortex. Analyzed transcriptomic dataset from. g) Enrichment of CH risk genes in a prenatal human brain single-cell RNA sequencing data set from. Purple square highlights lack of enrichment in choroid plexus cells. Choroid: choroid plexus, Glyc: glycolysis, IPC: intermediate progenitor cells, MGE: medial ganglionic eminence, OPC: oligodendrocyte precursor cells, RGC: radial glia cells. P values were calculated by hypergeometric test. h) Enrichment of CH risk genes in a postnatal mouse ventricular wall single-cell RNA sequencing data set from. Purple square highlights lack of enrichment in ependymal cells. aNSC: actively dividing neural stem cells, TAC: transit amplifying cells, NB: neuroblasts, OPC: oligodendrocyte progenitor cells, COP: committed oligodendrocyte precursors. P values were calculated by hypergeometric test. i) Enrichment of CH risk genes in a prenatal mouse meninges single-cell RNA sequencing data set from. P values were calculated by hypergeometric tests.
Extended Data Fig. 2 |
Extended Data Fig. 2 |. Gene co-expression network analysis of CH genetic risk.
a) Clustering dendrogram of genes showing module membership in colors. The y axis represents network distance as determined by 1-topological overlap (TO), where values closer to 0 indicate greater similarity of probe expression. Analyzed transcriptomic dataset from. b-g) GO term enrichment analysis of gene co-expression modules that are enriched for CH risk genes. Significance was calculated by two-sided Fisher’s exact test. h-i) Co-expression network connectivity between CH and other developmental disorder risk genes. CH risk genes exhibit greater connectivity to cortical developmental disorder genes than to PCD genes. Significance was tested using one-sided Wilcoxon rank sum test by comparing to the reference group, CH-PCD.
Extended Data Fig. 3 |
Extended Data Fig. 3 |. Macrocephalic appearance of a hydrocephalic Trim71R595H/+
mouse compared to a WT control at P21.
Extended Data Fig. 4 |
Extended Data Fig. 4 |. Characterization of TRIM71 expression.
a) TRIM71 is minimally expressed in the adult human cortex. Analyzed single-nucleus RNA-sequencing data from. b-c) RNAscope in situ hybridization of Trim71 in mouse embryonal carcinoma cells (b) or mouse Foxj1-expressing ependymal cell cultures (c) d) TRIM71 immunostaining in the WT mouse choroid plexus at P7.
Extended Data Fig. 5 |
Extended Data Fig. 5 |. Conditional knockout of Trim71 in embryonic NSCs by Nestin-Cre results in hydrocephalus in a subset of mice.
a) A subset of Nestin-Trim71fl/fl mice develop hydrocephalus with obvious macrocephaly at P21. b) Brain MRI demonstrates severe ventriculomegaly at P21 in a representative hydrocephalic Nestin-Cre;Trim71fl/fl mouse compared to a Trim71fl/fl control. 3D reconstructions of the ventricular system based on MRI scans are shown.
Extended Data Fig. 6 |
Extended Data Fig. 6 |. Mutant TRIM71 leads to reduced cell proliferation upon neural differentiation and an altered transcriptome.
a) Schematic of experimental paradigm of eFluor670 proliferation assay. Fluorescence intensity decreases by half upon every cell division. b,c) Representative histograms of eFluor670-labelled mESCs undergoing neural differentiation. Proliferation defects in mutant (Trim71R595H/+, Trim71R595H/R595H) (b) and Trim71 KO (c) mESC are reflected by slower loss of fluorescence intensity over time than that in WT or Trim71fl/fl control mESCs. d) Heatmap of the bulk RNA-sequencing showing gene expression profiles clustered in modules over mutant Trim71 genotypes.
Extended Data Fig. 7 |
Extended Data Fig. 7 |. Low levels of active caspase 3 (aCASP3) staining in the brains of control and Trim71 mutant mouse models.
a) aCASP3 staining in the neural tube neuroepithelia of WT, Trim71R595H/+, and Trim71R595H/R595H embryos at E9.5. b) aCASP3 staining in the cortices and lateral ventricles of WT and hydrocephalic Trim71R595H/+ mice at P0. c) aCASP3 staining in the cortices and lateral ventricles of Trim71fl/fl and hydrocephalic Nestin-Cre;Trim71fl/fl mice at P0.
Extended Data Fig. 8 |
Extended Data Fig. 8 |. H&E stained images of histological sections throughout the rostrocaudal extent of the midbrain cerebral aqueduct in P0 hydrocephalic Nestin-Trim71fl/fl mouse and a Trim71fl/fl
control, demonstrating anatomical patency of the aqueduct in both genotypes.
Extended Data Fig. 9 |
Extended Data Fig. 9 |. Characterization of ependymal cilia and choroid plexus in hydrocephalic Trim71 mutant mice.
a) Coronal brain sections from control and hydrocephalic mice were stained for ciliary markers (acetyl-α-tubulin and ARL13B), ependymal cell markers (S100B and FOXJ1), and choroid plexus epithelial cell markers (E-Cadherin, OTX2).b-d) Immunostaining for molecular correlates of choroid plexus hypersecretion in WT controls and hydrocephalic Trim71R595H/+ P0 mice. Immunostaining of phosphorylated SLC12A2/NKCC1 (pSLC12A2) (b) and phosphorylated STK39/SPAK (pSTK39) (c) in the choroid plexi of a WT control and hydrocephalic Trim71R595H/+ P0 mouse. d) Immunostaining of SLC12A2/NKCC1 and STK39/SPAK in the choroid plexi of a WT control and hydrocephalic Trim71R595H/+ P0 mouse. e-f) Validation of OCT imaging platform to characterize ependymal cilia-driven CSF flow ex vivo. e). Representative flow polarity maps demonstrating bead trajectories (by temporal color coding) over time in an adult WT mouse brain explant in toxin-naive condition, with ciliobrevin, and after washout of toxin. Color bar represents color versus corresponding frame in the color-coded image. f) Quantitation of local CSF flow speed at the ventricular wall in brain explants from adult WT mouse brains in the different experimental conditions. g-i) CSF flow directionality in WT littermate controls and hydrocephalic Trim71R595H/+ mice at P7. g) Post-Gaussian processing CSF flow maps in a WT littermate control and hydrocephalic Trim71R595H/+ mice at P7. h,i) Quantitation of CSF flow directionality in WT littermate controls and hydrocephalic Trim71R595H/+ mice at P7. Directionality is represented as the distance between the start point and end point (d) divided by the bead pathway (d), see panel (i). Significance was tested by a two-sided paired t-test (f) or two-sided unpaired t-test (h): *: P<0.05, **: P<0.01, ns (not significant): P>0.05. Data represented as boxplots (f,h): median (line), 25th and 75th percentiles (box), whiskers go down to the smallest value and up to the largest, overlaid with individual data points. For detailed statistical information (f, h), see Supplementary Table 13.
Extended Data Fig. 10 |
Extended Data Fig. 10 |. TRIM71 CH-mutations lead to deregulation of Cdkn1a/p21 and Egr1 and loss of interaction to the NMD factor UPF1.
a,b) Representative immunoblots for the CLIP-qPCR assays in a) HEK293T cells and b) mESC. c-e) Protein levels of EGR1 and P21/CDKN1A in WT and mutant TRIM71 mESC. c) Representative immunoblots showing protein levels of EGR1 and P21/CDKN1A. d,e) Quantitation of EGR1 (d) and P21/CDKN1A (e) protein levels from immunoblots in (c). f-i) De-repression of CDKN1A 3′UTR in HEK293T cells overexpressing TRIM71 mutants and in Trim71 mutant mESCs. f) Schematic of luciferase assay to examine RNA target silencing by TRIM71 (CDKN1A as example). g) Luciferase reporter assay for the CDKN1A 3′UTR showing repression ability of the indicated TRIM71 constructs in HEK293T cells. Norm. RLU = normalized relative light units. h) Representative immunoblot showing TRIM71 construct overexpression for the CDKN1A-3′UTR luciferase assays in (g). i) Luciferase reporter assay for the CDKN1A 3′UTR showing repression ability of the indicated mESC line. j,k) CH-causing mutations impair TRIM71 binding to the NMD factor UPF1. Immunoblots show UPF1 enrichment upon co-precipitation with j) different Ig-tagged TRIM71 constructs transfected into HEK293T cells, namely Ig-Ctrl, Ig-TRIM71, Ig-ΔNHL6, Ig-R608H, and Ig-R796H or k) with endogenous FLAG-tagged TRIM71 and TRIM71-R595H in mESC. Statistical significance was tested by a two-sided, one-sample t-test (d, e, g, i): *: P<0.05, **: P<0.01, ***: P<0.001. Data represented as mean±s.e.m., overlaid with individual data points. For detailed statistical information (d, e, g, i), see Supplementary Table 13. Source data are provided.
Fig. 1 |
Fig. 1 |. Convergence of CH genetic risk in discrete gene networks and cell types during human brain development.
a, Overview of functional genomics analyses. See Supplementary Table 3 for published transcriptomic datasets that were used for analyses. b, Number of direct PCNet interactions among CH risk genes (top), total number of CH risk genes that are connected to at least one other CH risk gene (middle) and number of interactions with CH risk genes and any other genes in PCNet (bottom). Red line indicates the observed value, and the gray histogram shows the null distribution of 1,000 permutations. Significance was calculated by permutation tests (Methods). P = 0 for all comparisons. c, GO analysis of CH risk genes, including ranked and selected terms. Significance was calculated by two-sided Fisher’s exact test. d, Enrichment of CH risk genes across developmental time points of the human brain. Analyzed transcriptomic dataset from ref. . Significance was calculated by comparing to background expression using one-sided Wilcoxon rank-sum test: *P < 0.05, **P < 0.01, ***P < 0.001 and NS (not significant): P > 0.05. Cellular processes were based on ref. and ref. . e, Significance of connectivity on BrainSpan layer-specific CH risk gene networks. Analyzed transcriptomic dataset from ref. . Fetal brain image was from the BrainSpan atlas. Significance was calculated by permutation tests (Methods). f, Enrichment of CH risk genes in prenatal human brain cell types. Analyzed transcriptomic dataset from ref. . RGC, radial glia cell; IPC, intermediate progenitor cell; NasN, nascent neuron; InN, inhibitory neuron; Astro, astrocyte; OPC, oligodendrocyte precursor cell; Oligo, oligodendrocyte; Endo, endothelial cell. Significance was calculated by hypergeometric test. g, Average scaled expression of representative CH genes in neuroprogenitor populations (NEC, RGC and IPC). Analyzed transcriptomic dataset from ref. . h, Module-level enrichment for disease risk genes. Modules were constructed via WGCNA of BrainSpan data (Methods). Only modules demonstrating significant enrichment for tested gene sets are shown. Logistic regression for indicator-based enrichment was used to calculate P values. Tiles labeled with −log10(P) and an asterisk represent statistically significant enrichment at the Bonferroni multiple testing cutoff (α = 0.05/88 = 5.68 × 10⁻⁴).
Fig. 2 |
Fig. 2 |. A mouse model that harbors the murine homolog (R595H) of the human CH-associated missense mutation in TRIM71 (R608H) exhibits ventriculomegaly and cortical hypoplasia.
a, Quantile–quantile plot of observed versus expected P values for DNMs in each gene in 289 cases. P values were calculated using a one-sided Poisson test (Methods). b, Ranking of CH risk genes by enrichment in human neuroepithelial cells (NEC) and at PCW5 based on the transcriptomic dataset from ref. . Significance was calculated by two-sided Wilcoxon rank-sum test. c, TRIM71 mutant patients with CH and mutations identified to date. The TRIM71 polypeptide domain schematic shows clustering of all mutations in the RNA-binding NHL domain. d, Brain MRI or ultrasound imaging from TRIM71 mutant patients with CH demonstrating ventriculomegaly phenotype. Prenatal imaging (ultrasound and MRI) is shown for patient KCHYD670–1. eg, Expression analysis of published bulk data (f) and single-cell transcriptomic data (g) of the prenatal human brain ventricular wall (comprising VZ and SVZ) for cell-type-specific markers. Box plot (in f): median (line) and 25th and 75th percentiles (box); whiskers extend up to 1.5 times the interquartile range from the top (bottom) of the box to the furthest datum within that distance (n = 4 brains). Significance was calculated by two-sided unpaired t-test in f. IPC, intermediate progenitor cell; RGC, radial glia cell. h, Generation of Trim71R595H mutant mice by CRISPR–Cas9 (Methods). Sanger sequencing shows substitution of AGG with CAT, encoding a change from R595 to H595. i, j, Brain MRI and 3D reconstructions of the ventricular system based on MRI scans of WT and hydrocephalic Trim71R595H/+ mice at P0 and P21. km, Quantitation of ventricular volume (k), intracranial volume (l) and cortical volume (m) from MRI scans of hydrocephalic Trim71R595H/+ mice compared to WT littermate controls at P0 and P21. Significance was tested by two-sided unpaired t-test (km): *P < 0.05, **P < 0.01, ***P < 0.001, ****P < 0.0001 and NS (not significant): P > 0.05. Data are represented as box plots: median (line) and 25th and 75th percentiles (box); whiskers go down to the smallest value and up to the largest, overlaid with individual data points. For detailed statistical information, see Supplementary Table 13. nq, Exencephaly in Trim71R595H/R595H embryos. No homozygous Trim71 mutants can be recovered by E13.5 with resorption of embryos. Scale bars, 500 μm.
Fig. 3 |
Fig. 3 |. TRIM71 is expressed in neuroepithelial cells and is required in embryonic neuroprogenitors for forebrain morphogenesis.
a, b, Violin plots showing TRIM71 expression across time points and cell types during human brain development. Analyzed transcriptomic dataset from ref. . NEC, neuroepithelial cell; RGC, radial glia cell; IPC, intermediate progenitor cell; NasN, nascent neuron; ExN, excitatory neuron; InN, inhibitory neuron; Astro, astrocyte; OPC, oligodendrocyte precursor cell; Oligo, oligodendrocyte; Endo, endothelial cell. c, d, Violin plots showing Trim71 expression across time points and cell types during mouse brain development. Analyzed transcriptomic dataset from ref. . e, TRIM71 expression throughout the course of in vitro neural differentiation in human iPSCs. Analyzed transcriptomic dataset from ref. . f, TRIM71 immunostaining in NES+ human primary neuroepithelial cells. gi, Schematic of mouse brain tissue sections at different time points. Red squares indicate areas selected for imaging in jo. jl, RNAscope studies of Trim71 mRNA expression in the WT mouse brain. Abundant Trim71 expression was observed in the WT mouse neuroepithelium at E9.5 (j), with rapid reduction in levels by E12.5 (k). Trim71 RNA was not detected in the P28 WT mouse ependyma (l). mo, Immunostaining shows TRIM71 expression in VIM+ neuroepithelial cells in E9.5 WT mouse neuroepithelium (m), followed by rapid reduction thereafter with no detectable expression in E12.5 WT neuroepithelium (n) or in P7 WT mouse ependyma (o). p, Schematic of conditional Trim71 allele and Cre-mediated recombination to delete Trim71 in all embryonic neuroprogenitors by Nestin-Cre driver. q, Schematic of novel conditional Trim71 allele before and after Cre-mediated recombination leading to excision of exon 4, causing conditional KO of Trim71 in neuroprogenitors fated for the dorsal telencephalon directed by Emx1-Cre driver. r, Brain MRI demonstrates severe ventriculomegaly at P0 in a representative hydrocephalic Nestin-Cre;Trim71fl/fl mouse compared to a Trim71fl/fl control. 3D reconstructions of the ventricular system based on MRI scans are shown. s, Brain MRI demonstrates ventriculomegaly at P21 in hydrocephalic Emx1-Trim71fl/ compared to a Trim71fl/+ control. t, Schematic of Tet-On system to conditionally KO Trim71 upon the administration of dox (Methods). u, Exencephaly in E12.5 Trim71 KO (TetO-cre tg;R26rtTA*M2/+;Trim71fl/fl) embryos but not in control embryos (R26rtTA*M2/+;Trim71fl/fl) after dox administration at E5.5. v, Brain MRI of P30 Trim71 KO (TetO-cre tg;R26rtTA*M2/+;Trim71fl/fl) and control (R26rtTA*M2/+;Trim71fl/fl) mice after dox administration at birth (P0.5).
Fig. 4 |
Fig. 4 |. Mutant TRIM71 alters neural stem cell progression, leading to premature differentiation with reduced proliferation.
a, Immunostaining of pH3 (marker of cell proliferation) cells and DCX (marker of immature neuroblasts) in the neuroepithelia of WT, Trim71R595H/+ and Trim71R595H/R595H embryos at E9.5. b, Quantitation of pH3+ cells and DCX+ cells in the E9.5 neural tube neuroepithelia of WT, Trim71R595H/+ and Trim71R595H/R595H embryos. c, d, WT and Trim71 mutant mESC divisions upon neural differentiation. e, Principal component analysis of bulk RNA sequencing data from Trim71fl/fl, Trim71 KO, WT, Trim71R595H/+ and Trim71R595H/R595H mESCs. Trim71 KO and Trim71R595H/R595H replicates cluster with respect to their controls in PC2. Trim71R595H/+ transcriptomes cluster together with their WT controls. Each point represents a replicate. f, CIBERSORT cell deconvolution with the RNA sequencing data over all genotypes shows a distinct shift from mESC to NEC pattern in Trim71R595H/R595H and Trim71 KO mESCs compared to their respective controls. NEC, neuroepithelial cell; RGC, radial glia cell. g, h, Gene ontology enrichment analysis (GOEA) with neural-related terms of genes reduced (steelblue module) (g) or increased (gold module) (h) in Trim71 KO and Trim71R595H/R595H. P values were calculated by hypergeometric test with Benjamini–Hochberg correction. i, j, Gene networks of highlighted GO terms in g and h of genes reduced (i) or increased (j) in Trim71 KO and Trim71R595H/R595H mESCs. kp, Immunostaining of POU3F2/BRN2 (layer II–III cortical neurons), BCL11B/CTIP2 (layer V cortical neurons) and TBR1 (layer VI cortical neurons) in cortices of control (WT and Trim71fl/fl) and hydrocephalic Trim71 mutant mouse models (Trim71R595H/+ and Nestin-Cre;Trim71fl/fl) at P0 with associated cell counts and layer thickness. qt, Immunostaining of MKI67 (marker of cell proliferation) in the SVZs of control (WT and Trim71fl/fl) and hydrocephalic Trim71 mutant mouse models (Trim71R595H/+ and Nestin-Cre;Trim71fl/fl) at P0 with associated cell counts. Statistical significance was tested by a two-sided unpaired t-test (bd, l, m, o, p, r, t): *P < 0.05, **P < 0.01, ***P < 0.001, ****P < 0.0001 and NS (not significant): P > 0.05. Data are represented as a box plot (b): median (line) and 25th and 75th percentiles (box); whiskers go down to the smallest value and up to the largest. Data are represented as mean ± s.e.m. (c, d, l, m, o, p, r, t). Individual data points were overlaid. For detailed statistical information (bd, l, m, o, p, r, t), see Supplementary Table 13.
Fig. 5 |
Fig. 5 |. Development of secondary aqueductal stenosis due to forebrain ventriculomegaly in hydrocephalic Trim71R595H/+ mice.
a, Measurement of ICP in P7 hydrocephalic Trim71R595H/+ mice and WT controls. b, Schematic of live imaging paradigm to characterize CSF outflow. A fluorescent CSF tracer (1% Evans blue) is injected into a lateral ventricle of a P0 mouse pup. The tracer diffuses throughout the entire ventricular system and then drains into the cisterna magna (CM) and spinal cord (SC). Tracer outflow from the ventricles is visualized by in vivo optical imaging. c, Images of pseudo-color fluorescence superimposed on a white light image from a P0 hydrocephalic Trim71R595H/+ mouse and a WT control at different time points (in minutes) after ventricular injection of 1% Evans blue. The purple arrowheads show CM and SC regions. d, e, Quantitation of fluorescence intensities (mean intensity) of Evans blue distribution to CM (d) or SC (e) 1 hour after ventricular dye injection in P0 hydrocephalic Trim71R595H/+ and WT control mice. f, Dorsal and ventral views of brains dissected from a P0 hydrocephalic Trim71R595H/+ mouse and a WT control 1 hour after ventricular injection of the CSF tracer. LV, lateral ventricle; 3rd V, third ventricle; Aq, cerebral aqueduct. g, H&E-stained images of histological sections throughout the rostrocaudal extent of the midbrain cerebral aqueduct in a P0 hydrocephalic Trim71R595H/+ mouse and a WT control. h, Representative images of the midbrain cerebral aqueduct from hydrocephalic Trim71R595H/+ mice and WT controls at P0 (top panels) and P21 (bottom panels). i, j, Quantitation of aqueduct volume from hydrocephalic Trim71R595H/+ mice and WT controls at P0 (i) and P21 (j). k, Brain MRI showing the cerebral aqueduct from a TRIM71 mutant (top panels) or L1CAM mutant (bottom panels) patient with CH before and after neurosurgical CSF diversion. 4th V, fourth ventricle. Statistical significance was tested by a two-sided unpaired t-test (a, d, e, i, j): *P < 0.05, **P < 0.01, ****P < 0.0001 and NS (not significant): P > 0.05. Data are represented as box plots: median (line) and 25th and 75th percentiles (box); whiskers go down to the smallest value and up to the largest, overlaid with individual data points. For detailed statistical information (a, d, e, i, j), see Supplementary Table 13.
Fig. 6 |
Fig. 6 |. Abnormal brain biomechanics facilitates secondary ventricular dilation in hydrocephalic Trim71R595H/+ mice.
a, Schematic of assay to characterize cilia-driven CSF flow in mouse brain sections using OCT imaging. b, Representative flow polarity maps demonstrating bead trajectories (by temporal color coding) over time in WT mouse brain explants at P0 and at P21. Color bar represents color versus corresponding frame in the color-coded image. c, Quantitation of local CSF flow speeds at ventricular walls of WT mice at P0 (n = 5 mice), P1 (n = 4 mice), P3 (n = 4 mice), P7 (n = 4 mice), P14 (n = 4 mice) and P90 (n = 4 mice). d, Representative flow polarity maps demonstrating bead trajectories over time in mouse brain explants from a hydrocephalic Trim71R595H/+ mouse and a WT control at P7. Color bar represents color versus corresponding frame in the color-coded image. e, Quantitation of local CSF flow speeds at ventricular walls of P7 hydrocephalic Trim71R595H/+ mice and WT controls. f, Schematic of AFM indentation experiments to characterize biomechanics of brain tissue. A summary of findings from hydrocephalic Trim71R595H/+ mice is shown in the box. gi, Quantitation of brain stiffness (g), viscoelasticity (h) and compliance (i) in cortical tissues from P7 hydrocephalic Trim71R595H/+ mice and WT controls. j, Proposed pathophysiological mechanism of ventriculomegaly due to impaired brain biomechanics in TRIM71-mutant CH. CSF normally generates a positive pressure in the ventricles that must be counteracted by the surrounding brain parenchyma. In the setting of cortical hypoplasia, altered brain biomechanics results in a floppy brain that is unable to resist the pressure exerted by CSF, facilitating secondary ventricular dilation in the absence of a primary defect in CSF. Continued expansion of the floppy brain parenchyma eventually compresses the midbrain, leading to secondary aqueductal stenosis. MRI of control adult human brain was obtained from OpenNeuro Dataset ds000221. Statistical significance was tested by a two-sided unpaired t-test (e, gi): **P < 0.01 and NS (not significant): P > 0.05. Data are represented as box plots: median (line) and 25th and 75th percentiles (box); whiskers go down to the smallest value and up to the largest, overlaid with individual data points. For detailed statistical information (e, gi), see Supplementary Table 13.
Fig. 7 |
Fig. 7 |. CH mutations impair TRIM71 binding to its RNA targets, including the novel target Spred1.
a, The TRIM71 polypeptide domain schematic shows clustering of all mutations in the RNA-binding NHL domain. b, TRIM71 immunostaining in the E9.5 forebrain neuroepithelia of WT and Trim71R595H/R595H. c, TRIM71 immunoblot in WT, Trim71R595H/+ and Trim71R595H/R595H mESCs. d, Immunoblots showing ubiquitin and SHCBP1 signals of SHCBP1-IP from Trim71fl/fl, Trim71-KO, WT and Trim71R595H/R595H mESCs differentiated with RA. SHCBP1 showed two bands; the upper band coincides with the ubiquitin signal. e, Quantitation of the SHCBP1 bands from SHCBP1-IP. Top SHCBP1 was normalized to total immunoprecipitated SHCBP1 (top + bottom bands). Trim71 KO and Trim71R595H/R595H values were then normalized to their respective controls. f, Autoradiograph of PAR-CLIP samples from control (negative), FLAG-TRIM71-WT, FLAG-TRIM71-R595H and DHX36 (positive control) showing protein-bound RNA. Boxes indicate expected size of TRIM71 protein or DHX36 protein. gi, CLIP-qRT–PCR enrichment of CDKN1A or EGR1 upon co-precipitation with Flag-Ctrl and human Flag-TRIM71-WT, −ΔNHL6, −R608H and -R796H in HEK293T cells (g, h) or with endogenous mESC FLAG-TRIM71 and FLAG-TRIM71-R595H (I). Precipitated mRNA levels were normalized to input and to enrichment of housekeeping. j, qRT–PCR showing Cdkn1a and Egr1 levels of mutant mESCs relative to respective controls. k, Stepwise approach to identify novel RNA targets of TRIM71. Significance was calculated by two-sided Fisher’s exact test (GO analysis) or hypergeometric test (cell type enrichment analysis). Box plot (in k3): median (line) and 25th and 75th percentiles (box); whiskers extend up to 1.5 times the interquartile range from the top (bottom) of the box to the furthest datum within that distance, with outliers plotted as individual points. Analyzed datasets from ref. and ref. . For detailed statistical information (k3), see Supplementary Table 13. l, qRT–PCR of the six predicted TRIM71 targets from k of mutant mESCs relative to respective controls. m, CLIP-qRT–PCR enrichment of Inhbb, Cbfa2t2 and Spred1 upon co-precipitation with endogenous FLAG-TRIM71-WT and FLAG-TRIM71-R595H. Precipitated mRNA levels were normalized to input and to enrichment of housekeeping. Statistical significance was tested by one-sample t-test (e, gj, l, m): *P < 0.05, **P < 0.01, ***P < 0.001, ****P < 0.0001 and NS (not significant): P > 0.05. Data are represented as mean ± s.e.m., overlaid with individual data points. For detailed statistical information (e, gj, l, m), see Supplementary Table 13. Source data are provided.
Fig. 8 |
Fig. 8 |. Graphical summary of findings.
Integrative genomics combining exome sequencing data from the largest international cohort of human patients with CH to date with large-scale transcriptomic atlases of the developing human brain identified neuroepithelial cells lining the embryonic brain ventricles as a point of disease convergence. TRIM71 harbors the most DNMs and is the CH risk gene most specifically expressed in neuroepithelial cells. CH-associated mutations in TRIM71 impair RNA binding and subsequent degradation, which lead to the accumulation of pro-neural differentiation signals. The combination of reduced proliferation and premature neuronal differentiation depletes the available neuroprogenitor pool. This results in neural tube closure defects and embryonic lethality of homozygous mouse mutants. Heterozygous mutations in either human or mouse result in a thinned cortical wall marked by reduced stiffness and elasticity, which facilitates secondary ventricular dilation and prenatal-onset hydrocephalus. Altogether, these findings suggest that some, or potentially many, forms of CH are, in fact, a congenital brain malformation with secondarily enlarged ventricles rather than a primary defect in CSF circulation. The identification of neuroprogenitor-based genetic subtypes of CH has major implications for clinical decision-making in the care of patients, such as the stratification of treatment strategies. In the long term, molecularly targeted gene therapies or pharmacological interventions may be developed to directly address the developmental pathology of CH.

References

    1. Aristotle. The History of Animals http://classics.mit.edu/Aristotle/history_anim.mb.txt
    1. Duy PQ et al. Brain ventricles as windows into brain development and disease. Neuron 110, 12–15 (2022). - PMC - PubMed
    1. Persson EK, Hagberg G. & Uvebrant P. Disabilities in children with hydrocephalus—a population-based study of children aged between four and twelve years. Neuropediatrics 37, 330–336 (2006). - PubMed
    1. Tully HM & Dobyns WB Infantile hydrocephalus: a review of epidemiology, classification and causes. Eur. J. Med. Genet 57, 359–368 (2014). - PMC - PubMed
    1. Greenberg MS Handbook of Neurosurgery, 9th edition (Thieme, 2019).

Publication types

Substances