. 2022 Apr;27(8):083010.
doi: 10.1117/1.JBO.27.8.083010.

SIMPA: an open-source toolkit for simulation and image processing for photonics and acoustics

Affiliations

SIMPA: an open-source toolkit for simulation and image processing for photonics and acoustics

Janek Gröhl et al. J Biomed Opt. 2022 Apr.

Abstract

Significance: Optical and acoustic imaging techniques enable noninvasive visualisation of structural and functional properties of tissue. The quantification of measurements, however, remains challenging due to the inverse problems that must be solved. Emerging data-driven approaches are promising, but they rely heavily on the presence of high-quality simulations across a range of wavelengths due to the lack of ground truth knowledge of tissue acoustical and optical properties in realistic settings.

Aim: To facilitate this process, we present the open-source simulation and image processing for photonics and acoustics (SIMPA) Python toolkit. SIMPA is being developed according to modern software design standards.

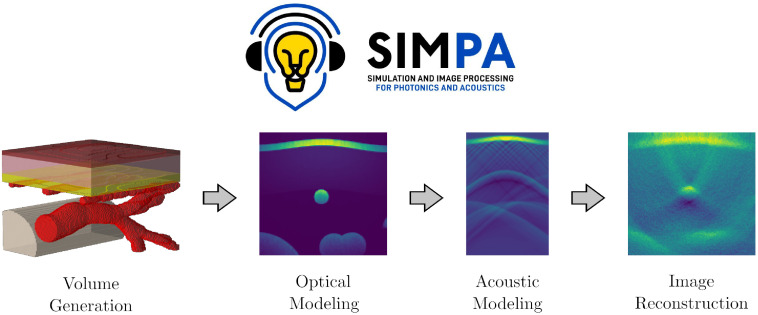
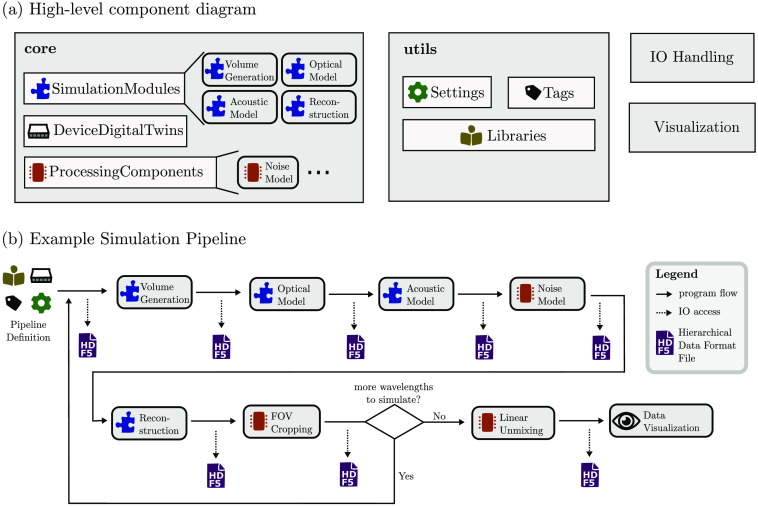
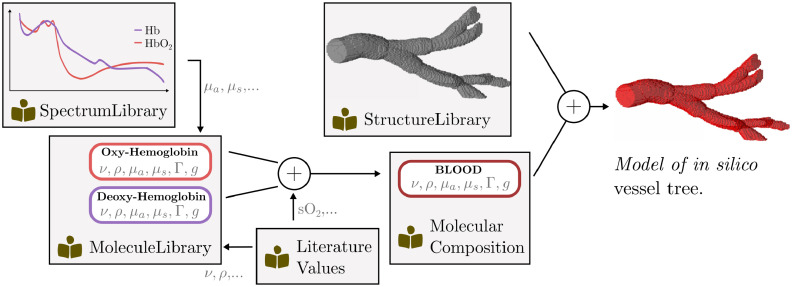
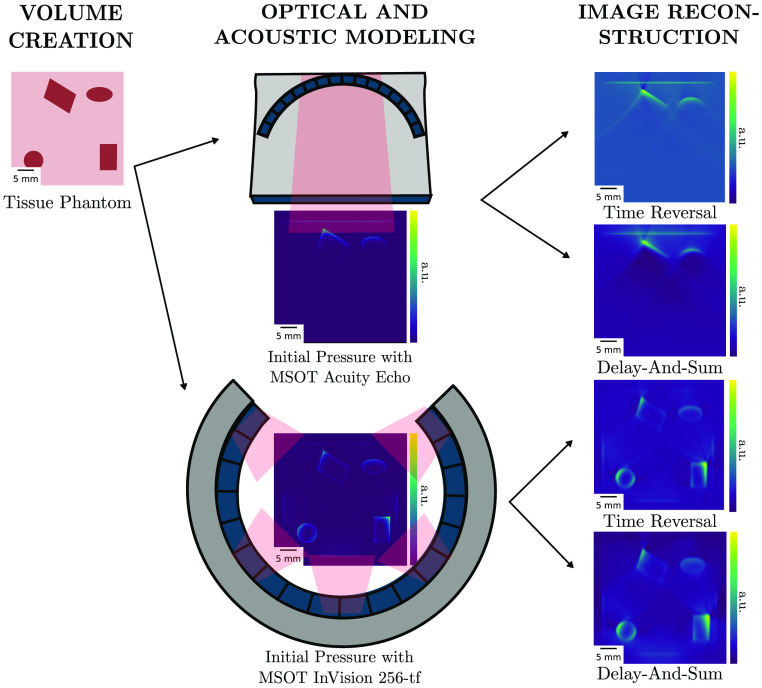
Approach: SIMPA enables the use of computational forward models, data processing algorithms, and digital device twins to simulate realistic images within a single pipeline. SIMPA's module implementations can be seamlessly exchanged as SIMPA abstracts from the concrete implementation of each forward model and builds the simulation pipeline in a modular fashion. Furthermore, SIMPA provides comprehensive libraries of biological structures, such as vessels, as well as optical and acoustic properties and other functionalities for the generation of realistic tissue models.

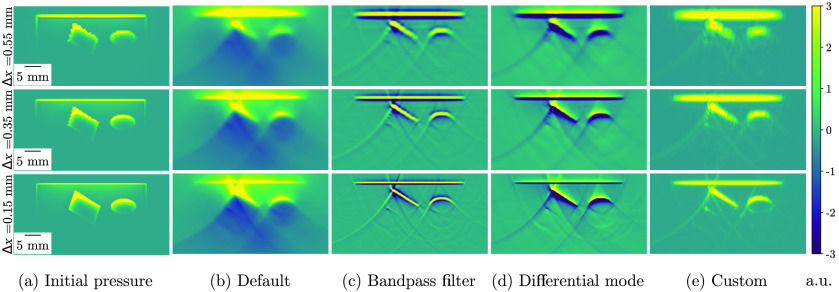
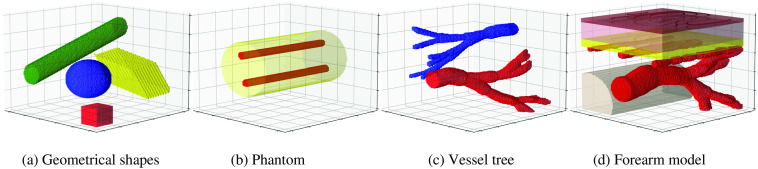
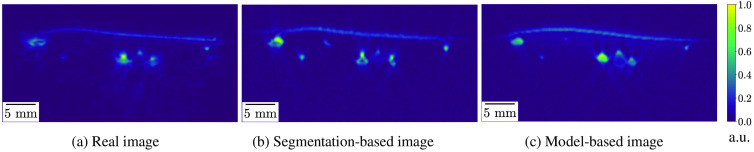
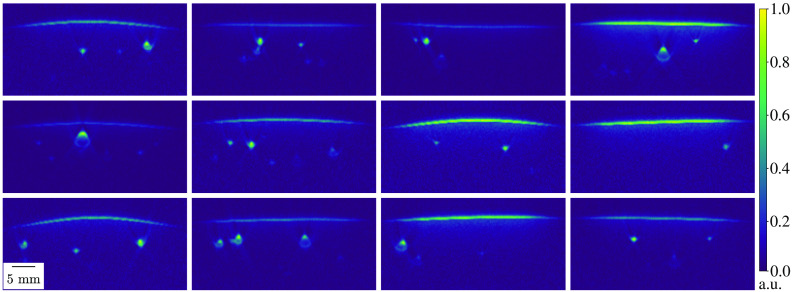
Results: To showcase the capabilities of SIMPA, we show examples in the context of photoacoustic imaging: the diversity of creatable tissue models, the customisability of a simulation pipeline, and the degree of realism of the simulations.

Conclusions: SIMPA is an open-source toolkit that can be used to simulate optical and acoustic imaging modalities. The code is available at: https://github.com/IMSY-DKFZ/simpa, and all of the examples and experiments in this paper can be reproduced using the code available at: https://github.com/IMSY-DKFZ/simpa_paper_experiments.

Keywords: acoustic imaging; open-source; optical imaging; photoacoustics; simulation.


Figures

Fig. 1
Fig. 1
The simulation and image processing for photonics and acoustics (SIMPA) toolkit.
Fig. 2
Fig. 2
Software components of SIMPA. (a) The main software components of SIMPA’s software architecture. The toolkit consists of two main components, core and utils, as well as several smaller components (e.g., io_handling, visualisation), which are each composed of several subcomponents. The core contains all SimulationModules, DeviceDigitaltwins, and ProcessingComponents. The utils component contains the Settings dictionary, a standardized list of Tags, various Libraries, and other utility and helper classes to facilitate using the toolkit. (b) An example simulation pipeline. The pipeline is defined via a Settings dictionary using a standardized list of Tags. During the pipeline execution, each pipeline element (which can be either a SimulationModule or a ProcessingComponent) is called sequentially. After each step, the new results are amended to a hierarchical data format 5 (HDF5) file. The pipeline is repeated for each wavelength; afterwards, all multispectral ProcessingComponents are executed, and the results can be visualised. In this example, the included pipeline elements are volume generation, optical modeling, acoustic modeling, noise modeling, image reconstruction, field of view (FOV) cropping, linear unmixing, and result visualisation.
Fig. 3
Fig. 3
The SIMPA file data structure is hierarchical. The output file of SIMPA uses the Hierarchical Data Format 5 (HDF5). The top-level fields are (1) Settings in which the input parameters for the global simulation pipeline as well as for all pipeline elements are stored in. (2) The Device describes the digital device twin with which the simulations are performed. (3) The Simulations field stores all of the simulation property maps that serve as input for the pipeline elements, such as the optical absorption (μa), scattering (μa), and anisotropy (g). These properties are wavelength-dependent and therefore are saved for each wavelength respectively. The density (ρ), acoustic attenuation (α), speed of sound (ν), Grüneisen parameter (Γ) or blood oxygen saturation (sO2) are wavelength-independent and therefore only stored once. The Simulations field also stores the outputs for each wavelength of each processing component and simulation module such as optical fluence (ϕ), initial pressure (p0), time series pressure data (p(t)), or the reconstructed image (p0recon). (4) The simulation pipeline is a list that stores the specific module adapters that have been combined and their order to form the simulation pipeline.
Fig. 4
Fig. 4
Unified modeling language (UML) class diagram of the digital device representation in SIMPA. Each box represents a class with the class name in bold. The first set of elements are the fields defined by these classes with their types shown in red, and the italic fields refer to abstract methods. A PA device comprises a detection geometry and an illumination geometry. All classes inherit from the DigitalDeviceTwinBase class, which defines common attributes: the device position and the FOV.
Fig. 5
Fig. 5
Overview of the steps involved for modeling an in silico vessel tree with SIMPA. The diagram shows the resources that SIMPA provides for users to create custom tissue models. Wavelength-dependent properties such as the optical absorption (μa), scattering (μs), or scattering anisotropy (g) are provided in the SpectrumLibrary, whereas wavelength-independent properties such as the speed of sound (ν), the tissue density (ρ), or the Grüneisen parameter (Γ) are provided by the LiteratureValues. A MolecularComposition corresponds to a linear mixture of Molecules that can be used in combination with a geometrical molecular distribution from the StructureLibrary to create an in silico model.
Fig. 6
Fig. 6
Simulation results with different hyperparameter configurations using a digital device twin of the MSOT Acuity Echo (iThera Medical GmbH, Munich, Germany). The results are shown for three spacings (Δx) in three rows (0.15, 0.35, and 0.55 mm), and from left to right, the columns show the following: (a) the ground truth initial pressure distribution; (b) the default pipeline with delay-and-sum reconstruction of the time-series pressure data (pressure mode); (c) delay-and-sum reconstruction with a bandpass filter (Tukey window with an alpha value of 0.5 and 1 kHz as high-pass and 8 MHz as low-pass frequencies) applied to the time-series data; (d) delay-and-sum reconstruction with the first derivative of the time-series data (differential mode); and (e) delay-and-sum reconstruction with a bandpass filter with the same configuration as in (c), the first derivative of the time-series data and envelope detection.
Fig. 7
Fig. 7
Demonstration of the versatility of the toolkit. From the same tissue phantom, two initial pressure distributions and time-series data are simulated using completely different PA digital device twin [in this case, the MSOT Acuity Echo and the MSOT InVision 256-TF (iThera Medical GmbH, Munich, Germany)]. The simulated time-series data are then reconstructed using different reconstruction algorithms (time reversal and delay-and-sum), resulting in four distinct simulation results.
Fig. 8
Fig. 8
Examples of chromophore distributions that can be created using the SIMPA volume generation module. (a) Arbitrarily placed and oriented geometrical structures, i.e., a tube (green), a sphere (blue), a parallelepiped (yellow), and a cuboid (red); (b) a cylindrical phantom (yellow) with two tubular inclusions (red); (c) a vessel tree with high blood oxygen saturation (red) and a vessel tree with lower blood oxygen saturation (blue); and (d) a forearm model including the epidermis (brown), dermis (pink), fat (yellow), vessels (red), and a bone (gray).
Fig. 9
Fig. 9
Comparison of simulations using SIMPA with a real PA image of a human forearm. From left to right, the panels show: (a) the normalized reconstructed PA image of a real human forearm acquired with the MSOT Acuity Echo; (b) a simulated image using SIMPA’s segmentation-based volume creator with a reference segmentation map of (a); and (c) a simulated image using SIMPA’s model-based volume creator. For both volume creators, a digital device twin of the MSOT Acuity Echo was used. For easier comparison, all images were normalized from 0 to 1 in arbitrary units.
Fig. 10
Fig. 10
Example of a diverse dataset of simulated PA images. With randomized settings of amount, location, size, shape, and blood oxygen saturation of vessels as well as the curvature of the skin, 12 diverse PA images were generated and normalized between 0 and 1 in arbitrary units (a.u.). The spacing of all images was 0.15 mm. For all simulations, a digital device twin of the MSOT Acuity Echo was used.

References

    1. Wilson R. H., et al. , “Review of short-wave infrared spectroscopy and imaging methods for biological tissue characterization,” J. Biomed. Opt. 20(3), 030901 (2015). 10.1117/1.JBO.20.3.030901 - DOI - PMC - PubMed
    1. Macé E., et al. , “Functional ultrasound imaging of the brain,” Nat. Methods 8(8), 662–664 (2011). 10.1038/nmeth.1641 - DOI - PubMed
    1. Yang C., et al. , “Review of deep learning for photoacoustic imaging,” Photoacoustics 21, 100215 (2021). 10.1016/j.pacs.2020.100215 - DOI - PMC - PubMed
    1. Hauptmann A., Cox B. T., “Deep learning in photoacoustic tomography: current approaches and future directions,” J. Biomed. Opt. 25(11), 112903 (2020). 10.1117/1.JBO.25.11.112903 - DOI
    1. Gröhl J., et al. , “Deep learning for biomedical photoacoustic imaging: a review,” Photoacoustics 22, 100241 (2021). 10.1016/j.pacs.2021.100241 - DOI - PMC - PubMed

Publication types