. 2022 Sep;28(10):1591-1605.
doi: 10.1177/13524585221083194. Epub 2022 Apr 5.

Long-term efficacy and safety of siponimod in patients with secondary progressive multiple sclerosis: Analysis of EXPAND core and extension data up to >5 years

Affiliations

Long-term efficacy and safety of siponimod in patients with secondary progressive multiple sclerosis: Analysis of EXPAND core and extension data up to >5 years

Bruce Ac Cree et al. Mult Scler. 2022 Sep.

Abstract

Background: Siponimod significantly reduced the risk of confirmed disability progression (CDP), worsening in cognitive processing speed (CPS), relapses, and magnetic resonance imaging (MRI) measures of brain atrophy and inflammation versus placebo in secondary progressive multiple sclerosis (SPMS) patients in the Phase 3 EXPAND study.

Objective: The aim of this study was to assess long-term efficacy and safety of siponimod 2 mg/day from the EXPAND study including the extension part, up to > 5 years.

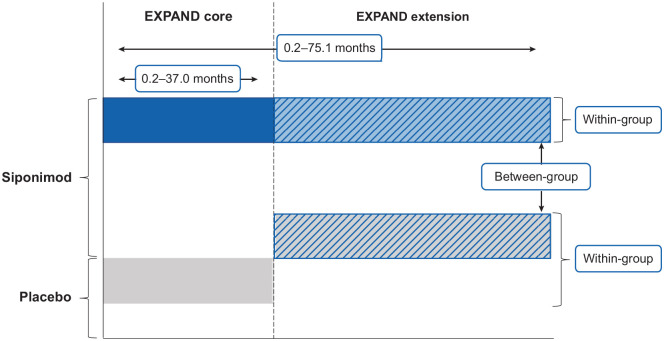
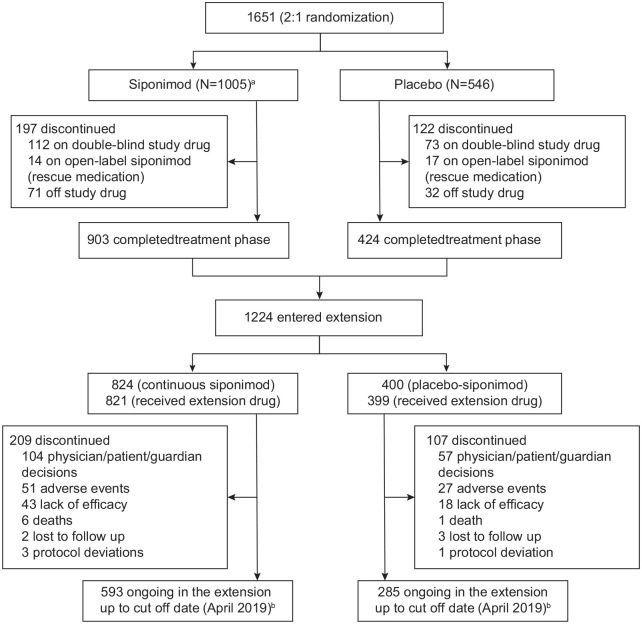
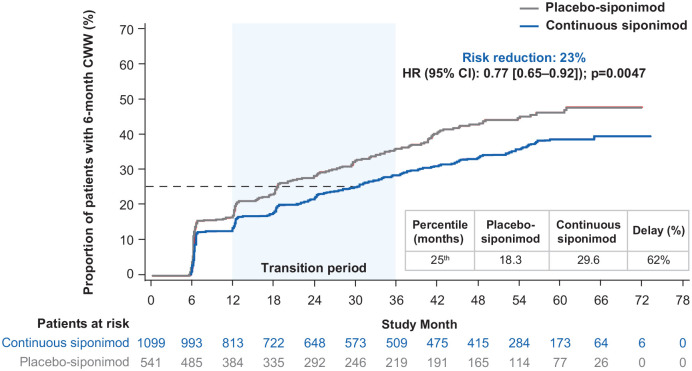
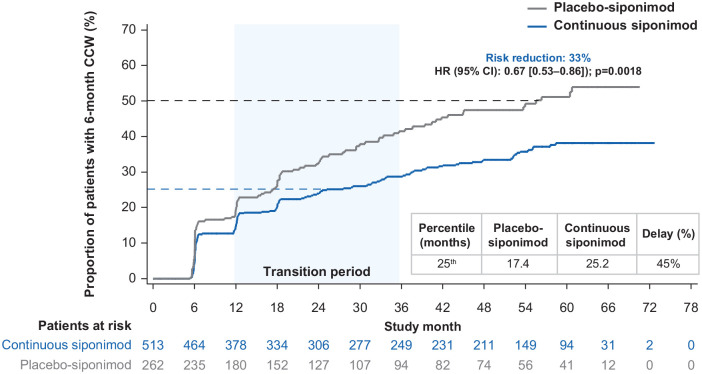
Methods: In the open-label extension part, participants receiving placebo during the core part were switched to siponimod (placebo-siponimod group) and those on siponimod continued the same treatment (continuous siponimod group).

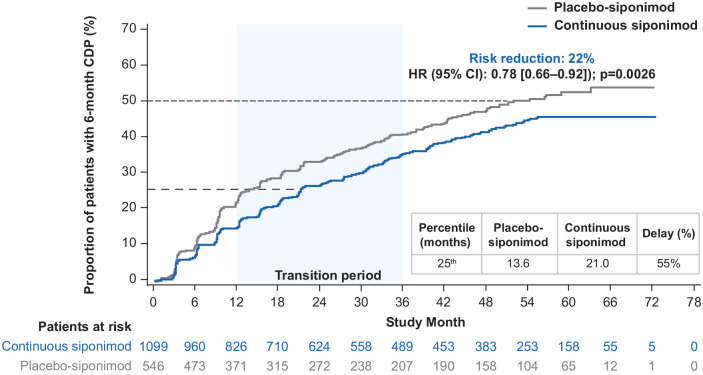
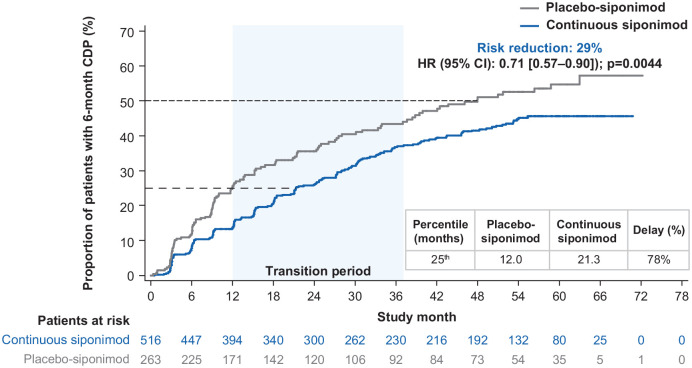
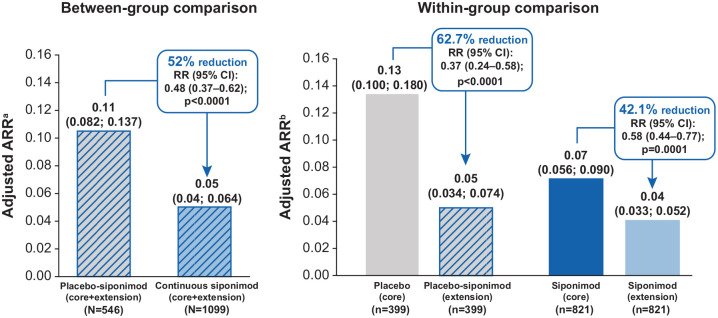
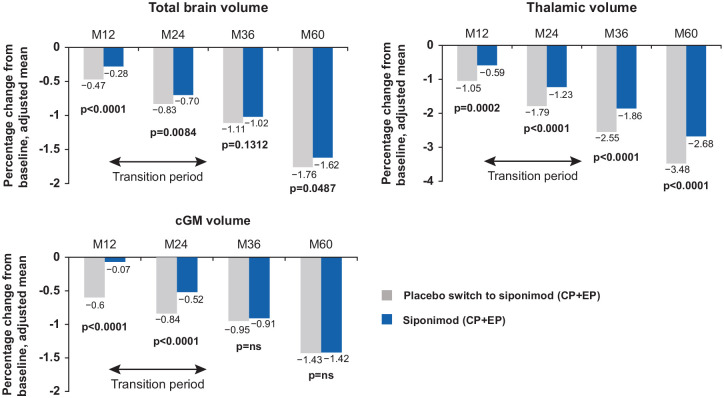
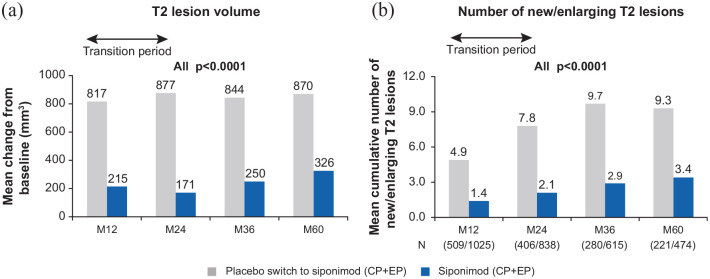
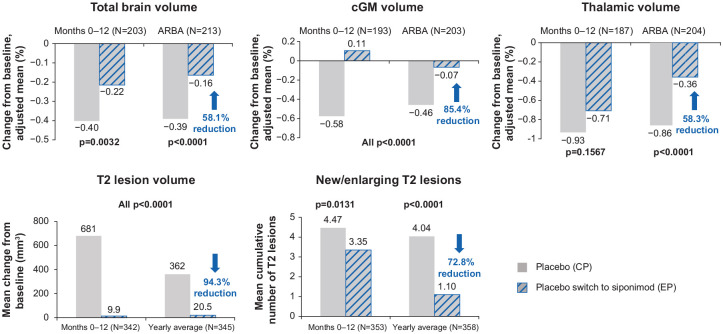
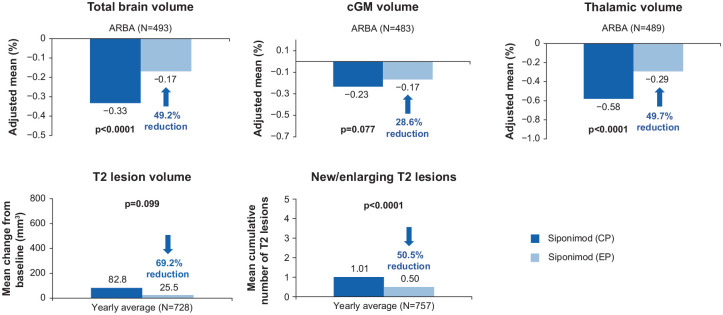
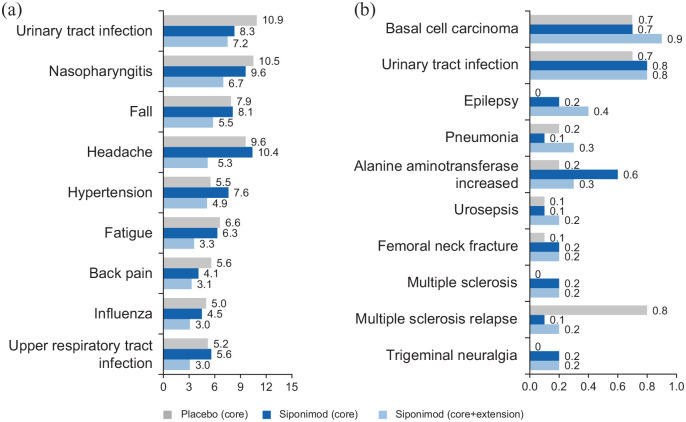
Results: Continuous siponimod reduced the risk of 6-month CDP by 22% (hazard ratio (HR) (95% confidence interval (CI)): 0.78 (0.66-0.92) p = 0.0026) and 6-month confirmed worsening in CPS by 23% (HR (95% CI): 0.77 (0.65-0.92) p = 0.0047) versus the placebo-siponimod group. Sustained efficacy on annualized relapse rate, total and regional brain atrophy, and inflammatory disease activity was also observed. No new, unexpected safety signals for siponimod were identified over the long term.

Conclusion: The sustained efficacy and consistent long-term safety profile of siponimod up to > 5 years support its clinical utility for long-term treatment of SPMS. Benefits in the continuous siponimod versus placebo-siponimod group highlight the significance of earlier treatment initiation.

Trial registration number: NCT01665144.

Keywords: Confirmed disability progression; S1P modulator; confirmed cognitive worsening; cortical gray matter; secondary progressive multiple sclerosis; siponimod.


Conflict of interest statement

Declaration of Conflicting Interests: The author(s) declared the following potential conflicts of interest with respect to the research, authorship, and/or publication of this article: B.A.C.C. has received personal compensation for consulting from Alexion, Atara, Autobahn, EMD Serono, Novartis, Sanofi, Therini Bio, and TG Therapeutics and received research support from Genentech. D.L.A. has received compensation from Alexion, Biogen, Celgene, Frequency Therapeutics, GENeuro, Genentech, Merck, Novartis, Receptos/Celgene, Roche, and Sanofi and has received stock or ownership interest from NeuroRx. His institution has received research support from Novartis and Immunotec. R.J.F. has received compensation for serving as a consultant or speaker from Allozyne, Avanir, Biogen, Novartis, Questcor and Teva Pharmaceutical Industries. He, or the institution he works for, has received research support from Novartis. R.G. has received compensation for serving as a consultant or speaker from Bayer HealthCare, Biogen Idec, Merck Serono, Novartis, and Teva Neuroscience. He, or the institution he works for, has received research support from Bayer HealthCare, Biogen Idec, Merck Serono, Novartis, and Teva Neuroscience. He has also received honoraria as a Journal Editor from SAGE and Thieme Verlag. P.V. has received honoraria and consulting fees from Biogen, Sanofi, Teva, Novartis, Merck, Imcyse, and AB Science and research support from Biogen, Sanofi, Bayer, and Merck. R.H.B.B. has received fees from Acorda Therapeutics, Biogen, EMD Serono, Roche/Genentech, Mallinckrodt, National Multiple Sclerosis Society, Novartis Pharmaceuticals Corporation, and Sanofi Genzyme. A.B.-O. has participated as a speaker in meetings sponsored by, and received consulting fees and/or grant support from, Accure, Atara Biotherapeutics, Biogen, BMS/Celgene/Receptos, GlaxoSmithKline, Gossamer, Janssen/Actelion, Medimmune, Merck/EMD Serono, Novartis, Roche/Genentech, and Sanofi Genzyme. G.G. is a steering committee member on the daclizumab trials for AbbVie, the BG12 and daclizumab trials for Biogen, the fingolimod and siponimod trials for Novartis, the laquinimod trials for Teva and the ocrelizumab trials for Roche. He has also received consultancy fees for advisory board meetings for oral cladribine trials for Merck KGaA, Sanofi Genzyme, and in relation to DSMB activities for Synthon BV, and honoraria for speaking at the Physicians’ Summit and several medical education meetings. He is also the Co-Chief Editor of Multiple Sclerosis and Related Disorders (Elsevier). L.K. has received no personal compensation. His institution (University Hospital Basel) has received the following exclusively for research support: steering committee, advisory board, and consultancy fees (Actelion, Addex, Bayer HealthCare, Biogen Idec, Biotica, Genzyme, Lilly, Merck, Mitsubishi, Novartis, Ono Pharma, Pfizer, Receptos, Sanofi, Santhera, Siemens, Teva, UCB, and XenoPort); speaker fees (Bayer HealthCare, Biogen Idec, Merck, Novartis, Sanofi, and Teva); support for educational activities (Bayer HealthCare, Biogen, CSL Behring, Genzyme, Merck, Novartis, Sanofi, and Teva); license fees for Neurostatus products; and grants (Bayer HealthCare, Biogen Idec, European Union, Innosuisse, Merck, Novartis, Roche Research Foundation, Swiss MS Society, and Swiss National Research Foundation). D.P.-M., N.R., S.R., A.K., and G.K. are employees of Novartis.

Figures

Figure 1.
Figure 1.
Comparison of short-term versus long-term treatment and early versus later treatment initiation with siponimod.
Figure 2.
Figure 2.
Participant disposition (overall population). Of the 1651 participants who were randomized (randomized set), 1646 received ⩾ 1 dose of randomized treatment (siponimod 2 mg or placebo) in the core part and were included in the analysis (full analysis set); 1224 participants entered the extension part; and 1220 received ⩾ 1 dose of open-label siponimod in the extension part. a5 participants did not receive the study drug.bParticipants not included: those with a disposition reason that was not available in the database or an adverse event that occurred after cutoff date (6 April 2019) for 19 participants in the continuous siponimod group and 7 in the placebo-siponimod group.
Figure 3.
Figure 3.
Kaplan–Meier estimate of the time to 6-month confirmed disability progression in the combined core and extension parts (combined FAS—overall population). Combined FAS includes all available EDSS data from the start of the core part to the cutoff date of the extension part. Subjects without baseline EDSS assessment were excluded from the analysis. CDP: confirmed disability progression; CI: confidence interval; EDSS: Expanded Disability Status Scale; FAS: full analysis set; HR: hazard ratio.
Figure 4.
Figure 4.
Kaplan–Meier estimate of the time to 6-month confirmed disability progression in the combined core and extension parts (combined FAS—active SPMS). Combined FAS includes all available EDSS data from the start of the core part to the cutoff date of the extension part. Subjects without baseline EDSS assessment were excluded from the analysis. CDP: confirmed disability progression; CI: confidence interval; EDSS: Expanded Disability Status Scale; FAS: full analysis set; HR: hazard ratio; SPMS: secondary progressive multiple sclerosis.
Figure 5.
Figure 5.
Kaplan–Meier estimate of the time to 6-month confirmed clinically meaningful worsening in CPS in the combined core and extension parts (combined FAS—overall population). Combined FAS includes all available SDMT data from the start of the core part to the cutoff date of the extension part. Subjects without baseline SDMT assessment were excluded from the analysis. CCW: confirmed cognitive worsening; CI: confidence interval; CPS: cognitive processing speed; FAS: full analysis set; HR: hazard ratio; SDMT: Symbol Digit Modalities Test.
Figure 6.
Figure 6.
Kaplan–Meier estimate of the time to 6-month confirmed clinically meaningful worsening in CPS in the combined core and extension parts (combined FAS—active SPMS). Combined FAS includes all available SDMT data from the start of the core part to the cutoff date of the extension part. Subjects without baseline SDMT assessment were excluded from the analysis. CCW: confirmed cognitive worsening; CI: confidence interval; CPS: cognitive processing speed; FAS: full analysis set; HR: hazard ratio; SDMT: Symbol Digit Modalities Test; SPMS: secondary progressive multiple sclerosis.
Figure 7.
Figure 7.
Adjusted ARR for between-group and within-group comparisons (overall population). ARR: annualized relapse rate; CI: confidence interval; EDSS: Expanded Disability Status Scale; Gd+: gadolinium-enhancing; RR: rate ratio; SPMS: secondary progressive multiple sclerosis. aNegative binomial regression model adjusted for the core part treatment group. bPoisson regression model adjusted for the treatment period (core part and extension part). Both models were also adjusted for country, baseline EDSS score, SPMS group (with/without superimposed relapses; baseline definition), and baseline number of T1 Gd+ lesions categories.
Figure 8.
Figure 8.
Mean cumulative percentage change from baseline during the study in total brain, thalamic, and cGM volume (between-group comparison—overall population). Total brain volume: placebo switch to siponimod (N = 457); siponimod (N = 929). Thalamic volume: placebo switch to siponimod (N = 451); siponimod (N = 920). cGM volume: placebo switch to siponimod (N = 448); siponimod (N = 920). MMRM model: percentage change from baseline adjusted for visit, treatment, age, number of Gd+ T1 lesions at baseline, T2 lesion volume (mm3) at baseline, superimposed relapses at baseline, visit by treatment interaction (and baseline normalized brain tissue volume, where applicable). cGM: cortical gray matter; CP: core part; EP: extension part; Gd+: gadolinium-enhancing; M: month; MMRM: mixed model repeated measures; ns: not significant.
Figure 9.
Figure 9.
Mean change from baseline during the study in T2 lesion volume and the cumulative number of new/enlarging T2 lesions (between-group comparison—overall population). (a) Placebo switch to siponimod (N = 496); siponimod (N = 999). MMRM model: percentage change from baseline adjusted for visit, treatment, age, number of Gd+ T1 lesions at baseline, T2 lesion volume (mm3) at baseline, superimposed relapses at baseline, visit by treatment interaction (and baseline normalized brain tissue volume, where applicable) and (b) p-values from the Wilcoxon signed-rank test for the differences between treatment groups. CP: core part; EP: extension part; Gd+: gadolinium-enhancing; M: month.
Figure 10.
Figure 10.
Within-group comparison: MRI outcomes in the placebo-siponimod switch group—overall population. At each time point, only participants with a value both at the core part visit and the corresponding extension part visit are included; percentage change relative to the start of the extension part was derived by accounting for the change during the core part; p-values from the Wilcoxon signed-rank test comparing percentage changes between the core part and the extension part within each group. ARBA is derived from percent change to last visit during the core part (median 21 months) and during the extension part (median 36 months). ARBA: annualized rate of brain atrophy; cGM: cortical gray matter; CP: core part; EP: extension part; M: month.
Figure 11.
Figure 11.
Within-group comparison: MRI outcomes in the continuous siponimod group—overall population. At each time point, only participants with a value both at the core part visit and the corresponding extension part visit are included; the yearly average is derived by standardizing the change to the last visit to 360 days; p-values from the Wilcoxon signed-rank test comparing percentage changes between the core part and the extension part within each group. ARBA is derived from percent change to last visit during the core part (median 21 months) and during the extension part (median 36 months). CP: core part; EP: extension part; M: month.
Figure 12.
Figure 12.
IRs for AEs and SAEs per 100 PY (safety set—overall population). IRs for (a) AEs (reported with IR of at least 3.0 for siponimod) and (b) SAEs (reported with IR of at least 0.1 for siponimod) per 100 PY. SAEs were reported by investigator if MS/MS relapse was unusually severe or medically unexpected as per protocol. IRs were computed as the number of participants with an AE divided by the total exposure for the AE (i.e. cumulative exposure until the first occurrence or 5-year cutoff date (6 April 2019)). AE: adverse event; IR: incidence rate; PY: patient-years; SAE: serious adverse event.

References

    1. Scalfari A, Neuhaus A, Daumer M, et al.. Onset of secondary progressive phase and long-term evolution of multiple sclerosis. J Neurol Neurosurg Psychiatry 2014; 85(1): 67–75. - PubMed
    1. Neuenschwander B, Weber S, Schmidli H, et al.. Predictively consistent prior effective sample sizes. Biometrics 2020; 76: 578–587. - PubMed
    1. Tremlett H, Yinshan Z, Devonshire V. Natural history of secondary-progressive multiple sclerosis. Mult Scler 2008; 14: 314–324. - PubMed
    1. Confavreux C, Vukusic S. Natural history of multiple sclerosis: A unifying concept. Brain 2006; 129(Pt 3): 606–616. - PubMed
    1. National Multiple Sclerosis Society. Types of MS, https://www.nationalmssociety.org/What-is-MS/Types-of-MS (accessed October 2019).

Publication types

Associated data