. 2022 Apr;198(4):1019-1029.
doi: 10.1007/s00442-022-05151-6. Epub 2022 Apr 5.

Functional traits of plants and pollinators explain resource overlap between honeybees and wild pollinators

Affiliations

Functional traits of plants and pollinators explain resource overlap between honeybees and wild pollinators

Andree Cappellari et al. Oecologia. 2022 Apr.

Abstract

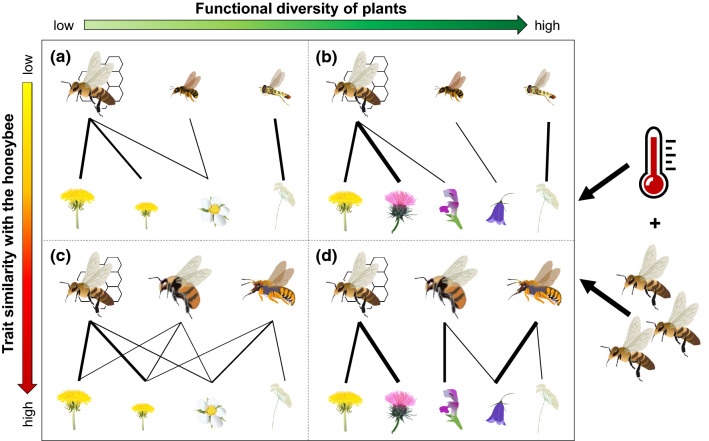
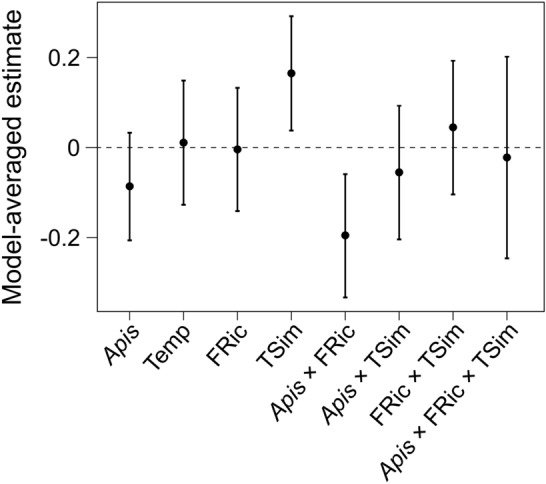
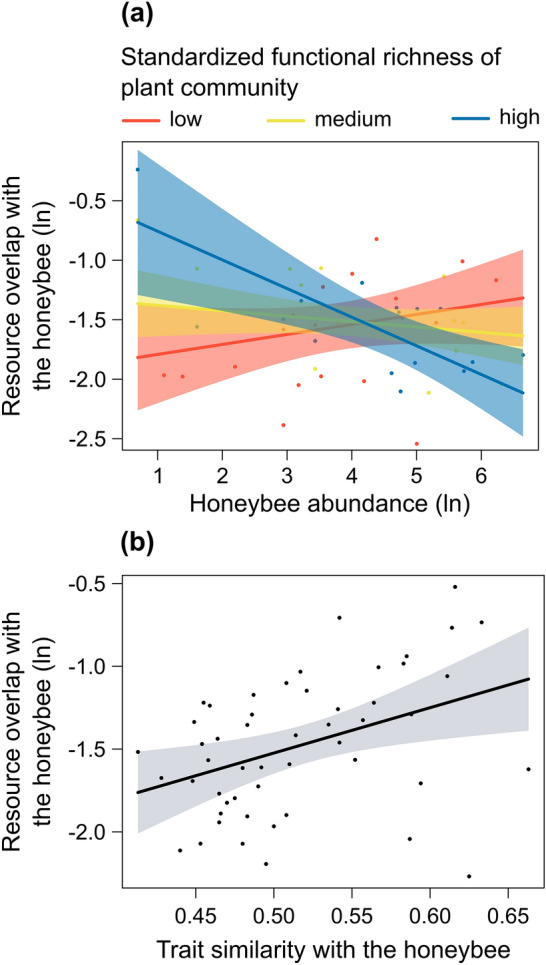
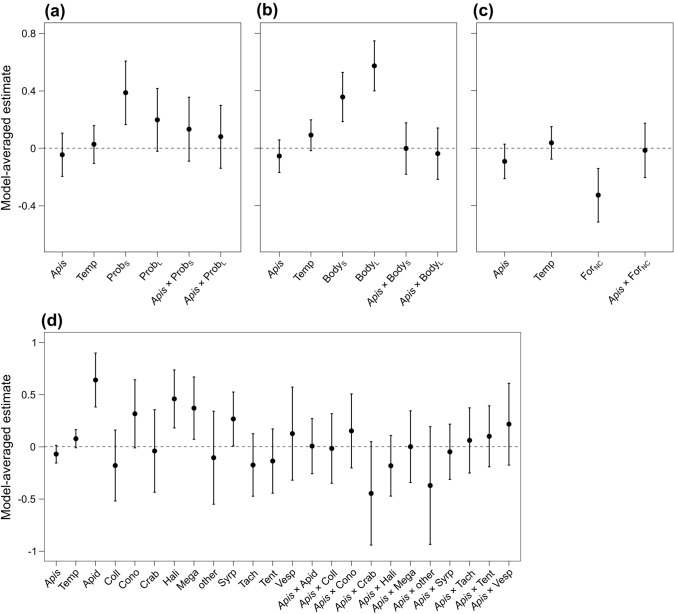
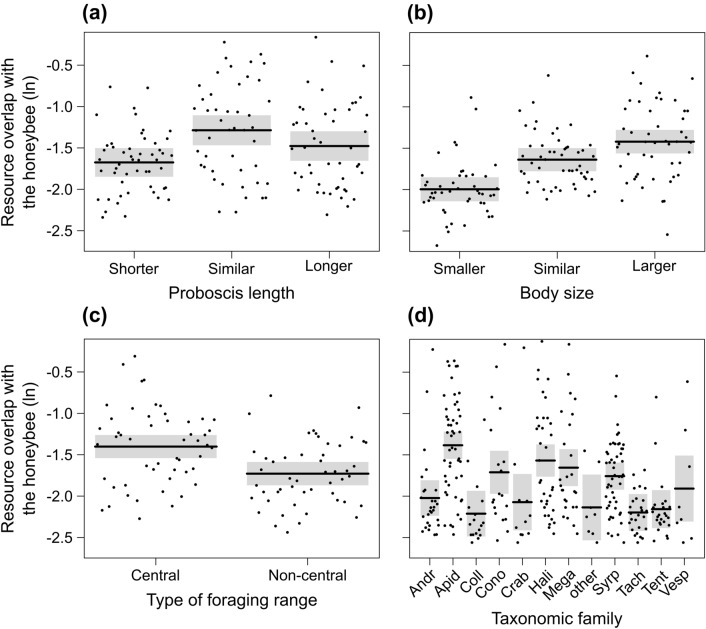
Managed and wild pollinators often cohabit in both managed and natural ecosystems. The western honeybee, Apis mellifera, is the most widespread managed pollinator species. Due to its density and behaviour, it can potentially influence the foraging activity of wild pollinators, but the strength and direction of this effect are often context-dependent. Here, we observed plant-pollinator interactions in 51 grasslands, and we measured functional traits of both plants and pollinators. Using a multi-model inference approach, we explored the effects of honeybee abundance, temperature, plant functional diversity, and trait similarity between wild pollinators and the honeybee on the resource overlap between wild pollinators and the honeybee. Resource overlap decreased with increasing honeybee abundance only in plant communities with high functional diversity, suggesting a potential diet shift of wild pollinators in areas with a high variability of flower morphologies. Moreover, resource overlap increased with increasing trait similarity between wild pollinators and the honeybee. In particular, central-place foragers of family Apidae with proboscis length similar to the honeybee exhibited the highest resource overlap. Our results underline the importance of promoting functional diversity of plant communities to support wild pollinators in areas with a high density of honeybee hives. Moreover, greater attention should be paid to areas where pollinators possess functional traits similar to the honeybee, as they are expected to be more prone to potential competition with this species.

Keywords: Apis mellifera; Competition; Foraging behaviour; Plant–pollinator networks; Trait similarity.


Conflict of interest statement

The authors declare that they have no conflict of interest.

Figures

Fig. 1
Fig. 1
Expected effects of functional diversity of plant community and trait similarity between wild pollinator community and the honeybee on plant–pollinator interactions. We hypothesise that: a in sites with a low functional diversity of plant community and a low trait similarity between wild pollinator community and the honeybee, the resource overlap between wild pollinators and the honeybee would be generally low, as pollinator species with functional traits different from those of the honeybee would exploit different resources; b in sites with a high functional diversity of plant community and a low trait similarity between wild pollinator community and the honeybee, the resource overlap would be even lower, as pollinator species would spread on different floral resources; c in sites with a low functional diversity of plant community and a high trait similarity between wild pollinator community and the honeybee, pollinator species would share an important portion of plants with the honeybee, therefore, resulting in a high resource overlap; d in sites with a high functional diversity of plant community and a high trait similarity between wild pollinator community and the honeybee, the resource overlap would decrease, as pollinator species would have much more resources to forage on. Increasing honeybee abundance and higher temperatures would intensify the observed effects
Fig. 2
Fig. 2
Model estimates from the model-averaging procedure based on the set of models with all functional traits of both plants and pollinators (Model 1). Explanatory variables of the global model are honeybee abundance (Apis, ln-transformed), temperature (Temp), standardized functional richness of plant community (FRic), trait similarity between wild pollinator community and the honeybee (TSim), and the interactions Apis × FRic, Apis × TSim, FRic × TSim, and Apis × FRic × TSim. All explanatory variables were scaled to mean 0 and standard deviation 1. Dots indicate the model estimated means, while error bars indicate the 95% confidence intervals for the expected values of the variables
Fig. 3
Fig. 3
Partial residual plots showing the effect of a the interaction between honeybee abundance (ln-transformed) and standardized functional richness of plant community, with the three standardized functional richness levels representing the 10th, 50th, and 90th percentiles, and b trait similarity between wild pollinator community and the honeybee on resource overlap between wild pollinator community and the honeybee (ln-transformed) (Model 1). The shaded areas indicate the 95% confidence intervals for the expected values
Fig. 4
Fig. 4
Model estimates from the model-averaging procedure based on the four sets of models considering single traits of pollinators, i.e., a proboscis length (Model 3), b body size (Model 4), c type of foraging range (Model 5), and d taxonomic family (Model 6). Explanatory variables of the four global models are honeybee abundance (Apis, ln-transformed), temperature (Temp), the levels of the four trait categories (ProbS proboscis similar to the honeybee, ProbL proboscis longer than the honeybee, BodyS body size similar to the honeybee, BodyL body size larger than the honeybee, ForNC non-central forager, Apid Apidae, Coll Colletidae, Cono Conopidae, Crab Crabronidae, Hali Halictidae, Mega Megachilidae, other other families, i.e., Cimbicidae, Megalodontesidae, Melittidae, and Scoliidae, Syrp Syrphidae, Tach Tachinidae, Tent Tenthredinidae, Vesp Vespidae) and the interactions between honeybee abundance and each levels of the traits. All continuous explanatory variables were scaled to mean 0 and standard deviation 1. Dots indicate the model estimated means, while error bars indicate the 95% confidence intervals for the expected values of the variables
Fig. 5
Fig. 5
Partial residual plots showing the effect of a proboscis length (Model 3), b body size (Model 4), c type of foraging range (Model 5), and d taxonomic family (Model 6) on resource overlap between wild pollinator community and the honeybee (ln-transformed). The shaded areas indicate the 95% confidence intervals for the expected values

References

    1. Abrahamczyk S, Kluge J, Gareca Y, et al. The influence of climatic seasonality on the diversity of different tropical pollinator groups. PLoS ONE. 2011;6:e27115. doi: 10.1371/journal.pone.0027115. - DOI - PMC - PubMed
    1. Albrecht M, Schmid B, Hautier Y, Müller CB. Diverse pollinator communities enhance plant reproductive success. Proc R Soc B Biol Sci. 2012;279:4845–4852. doi: 10.1098/rspb.2012.1621. - DOI - PMC - PubMed
    1. Balfour NJ, Garbuzov M, Ratnieks FLW. Longer tongues and swifter handling: why do more bumble bees (Bombus spp.) than honey bees (Apis mellifera) forage on lavender (Lavandula spp.)? Ecol Entomol. 2013;38:323–329. doi: 10.1111/een.12019. - DOI
    1. Barton K (2020) MuMIn: multi-model inference. R package version 1.43.17. https://CRAN.R-project.org/package=MuMIn
    1. Bergamo PJ, Streher NS, Wolowski M, Sazima M. Pollinator-mediated facilitation is associated with floral abundance, trait similarity and enhanced community-level fitness. J Ecol. 2020;108:1334–1346. doi: 10.1111/1365-2745.13348. - DOI

LinkOut - more resources