. 2022 May 2;219(5):e20211504.
doi: 10.1084/jem.20211504. Epub 2022 Apr 5.

IL-17A-producing γδT cells promote muscle regeneration in a microbiota-dependent manner

Affiliations

IL-17A-producing γδT cells promote muscle regeneration in a microbiota-dependent manner

Alexander O Mann et al. J Exp Med. .

Abstract

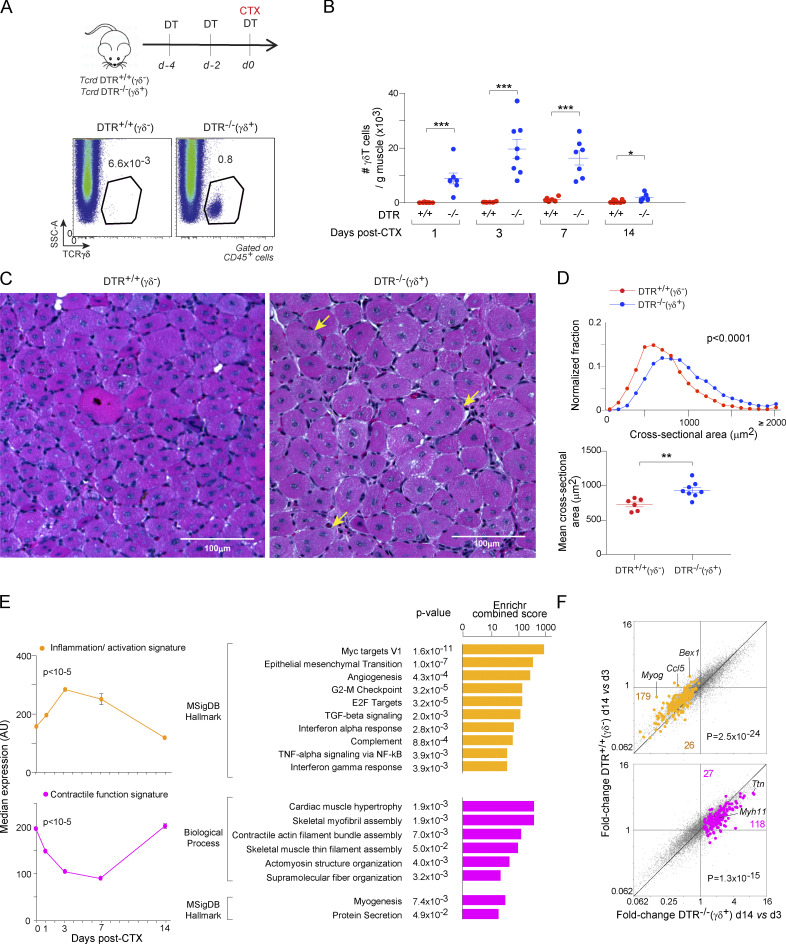
Subsequent to acute injury, skeletal muscle undergoes a stereotypic regenerative process that reestablishes homeostasis. Various types of innate and adaptive immunocytes exert positive or negative influences at specific stages along the course of muscle regeneration. We describe an unanticipated role for γδT cells in promoting healthy tissue recovery after injection of cardiotoxin into murine hindlimb muscle. Within a few days of injury, IL-17A-producing γδT cells displaying primarily Vγ6+ antigen receptors accumulated at the wound site. Punctual ablation experiments showed that these cells boosted early inflammatory events, notably recruitment of neutrophils; fostered the proliferation of muscle stem and progenitor cells; and thereby promoted tissue regeneration. Supplementation of mice harboring low numbers of IL-17A+ γδT cells with recombinant IL-17A largely reversed their inflammatory and reparative defects. Unexpectedly, the accumulation and influences of γδT cells in this experimental context were microbiota dependent, unveiling an orthogonal perspective on the treatment of skeletal muscle pathologies such as catastrophic wounds, wasting, muscular dystrophies, and myositides.


Conflict of interest statement

Disclosures: The authors declare no competing financial interests.

Figures

Figure 1.
Figure 1.
Acute muscle injury induces the accumulation of IL-17A+ γδT cells. (A and B) Flow cytometric data on TCRγδ expression by immunocytes from hindlimb muscle of mice after CTX-induced injury. (A) Representative dot-plot of day 3 data. SSC, side scatter. (B) Summary data over time for fractional representation (left) and numbers (right) of γδT cells. (C) Flow cytometric analysis of RORγ expression by γδT cells from injured muscle. Left: Representative dot-plot of day 3 data. Right: Summary data for RORγ+ γδT cell frequency over time. (D) Flow cytometric data on RORγ expression by diverse cells of the muscle T-lymphocyte compartment on day 3 after injury. Data in A–D were compiled from two to three independent experiments. (E) Flow cytometric analysis of IL-17A expression by muscle γδT cells following PMA + ionomycin stimulation. Left: Representative dot-plot of day 3 data. Right: Summary data over time of IL-17A production. (F) Flow cytometric data on IL-17A expression by diverse cells of the muscle T-lymphocyte compartment on day 3 after injury. Representative of two independent experiments. (G) Flow cytometric analysis of Vγ6+ and Vγ4+ muscle T cells. Left: Representative plots of Vγ6+ (left) and Vγ4+ (right) staining; Right: Summary plot. (H) Sequencing data on the Trdv4 complementarity-determining region 3 (CDR-3) of individually sorted Vγ6+ T cells from muscle 3 d after injury. (I) Volcano plot illustrating transcriptional differences between Vγ6+ γδT cells from the colonic lamina propria and 3-d injured muscle (n = 3). Values at the top indicate the number of transcripts significantly (P < 0.05) up-regulated (red) and down-regulated (blue) ≥2-fold in injured muscle. (J) Flow cytometric analysis of Ki67 expression by muscle γδT cells. Left: Representative dot-plots of uninjured and day 1 data. Right: Summary data for Ki67+ cell frequency among γδT cells. Data obtained from two to three independent experiments. (K) Flow cytometric quantification of γδT cells in skeletal muscle at different days after injury; mean FC values between experimental conditions at each time point are annotated above. Data obtained from three independent experiments. (L) Flow cytometric quantification of Kaede-Red and Kaede-Green fluorescence signal from spleen and muscle γδT cells 3 d after cervical lymph node photoconversion and hindlimb skeletal muscle injury. Tconv, CD4+ Foxp3 conventional T cell; Treg, CD4+ Foxp3+ regulatory T cell. All plots: means ± SEM; *, P < 0.05; **, P < 0.01; ***, P < 0.001 by unpaired t test.
Figure S1.
Figure S1.
Transcriptional analysis of factors involved in IL-17A+ γδT cell accumulation and function. (A and B) RNA-seq quantification of key transcripts by Vγ6+ T cells sorted from muscle 3 d after injury or from the colonic lamina propria. From three independent mice. (C–E) Reanalysis of whole-muscle scRNA-seq data obtained from uninjured mice or 24 h after injury (Baht et al., 2020). (C) Left: 2D UMAP plot of data from two time points combined. Right: Cell distribution across the two time points. (D and E) Density plots (D) and bubble plots (E) of the average transcript expression for cytokines and chemokines known to be crucial for γδT cell proliferation and recruitment. Mean ± SEM. ns, not significant. **, P < 0.01; ***, P < 0.001, by unpaired t test.
Figure 2.
Figure 2.
γδT cells promote muscle repair. (A) Schematic of the depletion protocol (top) and representative dot-plots of TCRγδ expression by immunocytes from muscle 3 d after injury following DT administration to littermates of the indicated genotypes (right). SSC, side scatter. (B) Same as A, except summary data over time after injury. Data obtained from two to three independent experiments. (C) H&E staining of muscle sections collected 7 d after CTX-induced injury. Arrows indicate selected examples of large multinucleated cells. Scale bar indicates 100 μm. (D) Cross-sectional area of muscle fibers on day 7. Top: Frequency distribution, with 100-μm2 bins. Bottom: Mean fiber diameter per mouse. Data obtained from three independent experiments. (E and F) Transcriptional analysis of regenerating muscle tissue. (E) Gene signature scores over time for WT mice (n = 3). (F) FC/FC plots comparing transcriptome evolution from day 3 to 14 after injury in mice with (DTR−/−) or without (DTR+/+) γδT cells. Abbreviations as per Fig. 1. Means ± SEM. *, P < 0.05; **, P < 0.01; ***, P < 0.001. Statistical analyses: t test of weighted sums (D, top); otherwise unpaired t test.
Figure 3.
Figure 3.
γδT cells promote early inflammation and stem cell proliferation after muscle injury. (A) Vascular permeability over time after CTX-induced injury in the TA muscle, measured by Evans blue dye uptake. Data obtained from two independent experiments. (B) Flow cytometric analysis of neutrophils in day-1 injured muscle of mice harboring (DTR−/−) or not (DTR+/+) γδT cells. Left: Representative dot-plots. Right: Summary data for fractional representation (top) and numbers (bottom). (C) Same as B, except MO/MF populations were examined. (D) Same as B, except MPCs were examined. (E) Same as B, except cell-cycle state of MPCs was examined. EdU+ fractions were normalized to the mean of the control group. (F) MPC numbers on day 3 after injury. (G) Flow cytometric analysis of Ki67 and MyoG expression by MPCs 3 d after injury of mice of the indicated genotypes. Left: Representative dot-plots. Right: Summary data/quantification. Data for B–G obtained from two to three independent experiments. (H) RNA-seq analysis of Myog and Myod1 transcripts from whole TA muscle taken from mice with (DTR−/−) or without (DTR+/+) γδT cells over time after injury (n = 3). (I) GSEA of MSigDB Hallmark pathways up-regulated in MPCs isolated from γδT+ (DTR−/−) over γδT (DTR+/+) 1 d after injury. EBD, Evans Blue Dye; FWER, familywise error rate. Other abbreviations as per Figs. 1 and 2. Means ± SEM. *, P < 0.05; **, P < 0.01 by unpaired t test except for H, which used a two-way ANOVA.
Figure S2.
Figure S2.
γδT cells promote early inflammation after muscle injury. (A) Flow cytometric quantification of fractional representation (left) and numbers (right) of muscle neutrophils 3 d after CTX-induced injury. Data obtained from two independent experiments. (B) Right: Flow cytometric quantification of the numbers of Ly6Chi MO/MFs in muscle 3 d after injury. Left: Same as B, except numbers of Ly6Clo MO/MFs were quantified. Data are representative of two independent experiments. Mean ± SEM. *, P < 0.05 by unpaired t test.
Figure 4.
Figure 4.
IL-17A boosts early inflammation and muscle repair after acute injury. (A) Flow cytometric quantification of total MPC number (left) and fraction (right) of MyoG+ MPCs in muscle 3 d after injury with or without a combination of anti–IL-17A and anti–IL-17F (anti–IL-17) injection. Representative of two independent experiments. (B) Flow cytometric quantification of myeloid cell populations in hindlimb muscle of mice treated with PBS or rIL-17A 1 d after CTX. Representative of two independent experiments. (C) Flow cytometric analysis of EdU uptake by MPCs 1 d after CTX. Data obtained from two independent experiments. (D) Flow cytometric quantification of total MPC numbers (left) fraction and numbers of MyoG+ MPCs muscle 3 d after injury with or without rIL-17A injection. (E) Histological analysis of muscle fiber regeneration 7 d after injury of mice treated with PBS or rIL-17A. Representative images of H&E staining of a hindlimb muscle section. Arrows depict large, multinucleated cells. Scale bar indicates 100 μm. (F) Quantification of cross-sectional areas of individual centrally nucleated muscle fibers on sections like those in E. Top: Distributions of individual fiber areas. Bottom: Average fiber areas for individual mice. Data obtained from three independent experiments. Statistical analysis of frequency distributions was performed using t test of weighted sums. (G) Gene signature scores related to various aspects of muscle regeneration (Aguilar et al., 2015) in the transcriptome of whole TA muscle on day 7 after CTX injury in the presence or absence or rIL-17A (n = 2). Score calculated as per Materials and methods. (H) FC/FC plots comparing gene expression values in TA muscle of mice with (DTR−/−) versus without (DTR+/+) γδT cells (x axis) vis-a-vis rIL-17A– versus PBS-treated mice 7 d after CTX (y axis). Muscle “homoeostasis/structure” and “entry to repair” signature genes (Burzyn et al., 2013) are highlighted in blue and green, respectively. Over- or underrepresentation of the signatures in the FC comparisons was statistically evaluated using χ2 test. Correlations of FC values between the rIL-17A versus PBS and DTR−/− versus DTR+/+ comparisons were performed using linear regression. Mean ± SEM. *, P < 0.05; **, P < 0.01 by unpaired t test unless otherwise indicated.
Figure S3.
Figure S3.
IL-17A boosts early inflammation after acute injury. (A) Flow cytometric quantification of CD45+ immunocyte numbers 1 d after CTX. (B) Flow cytometric analysis of the fractional representation of myeloid cell populations in hindlimb muscle at 1 d after CTX. (C and D) Flow cytometric quantification of myeloid cell populations in hindlimb muscle at 2 d (C) or 3 d (D) after injury. (E) Schematic of antibody-mediated depletion of neutrophils along with injury in conjunction with rIL-17A treatment. (F) Distribution of cross-sectional areas of individual centrally nucleated muscle fibers on H&E sections (n = 3–5 mice per group). Samples with <10% injured area in TA muscles were excluded from the analysis. Statistical analysis of frequency distributions was performed using t test of weighted sums. Data in A, B, and D are representative of three independent experiments, and in C, E, and F, of one independent experiment. Mean ± SEM. *, P < 0.05 **, P < 0.01; ***, P < 0.001 by unpaired t test unless otherwise indicated.
Figure S4.
Figure S4.
The microbiota controls accumulation of muscle γδT cells. (A) Flow cytometric quantification of the fractional representation of γδT cells in hindlimb muscle 3 d after CTX in mice from various housing facilities. (B) Same as A, but from mice that underwent either standard or sterile surgical injury. Jax, Jackson Laboratory; NRB, New Research Building at Harvard Medical School. Mean ± SEM. **, P < 0.01; ***, P < 0.001, by unpaired t test.
Figure 5.
Figure 5.
The microbiota controls accumulation and IL-17A production of muscle γδT cells. (A) Flow cytometric quantification of the fraction of γδT cells in hindlimb muscle 3 d after CTX in GF versus SPF mice. (B) Same as A, except SPF mice were treated or not with the antibiotic cocktail VMNA. (C) Flow cytometric analysis of cytokine expression by muscle γδT cells 3 d after injury. Left: Representative dot-plot. Right: Summary data. (D) Flow cytometric analysis of Ki67 expression by muscle γδT cells 3 d after injury in GF or SPF mice. Scale bar indicates 100 μm. (E) Same as D, except SPF mice were treated or not with the antibiotic cocktail VMNA. (F) Flow cytometric analysis of splenic RORγ+ γδT cells from GF or SPF mice. Left: Frequency. Right: Numbers. (G) Same as F, except from uninjured hindlimb skeletal muscle. A, C, and D are representative of two independent experiments; B and E–G are pooled data of two independent experiments. Mean ± SEM. *, P < 0.05; **, P < 0.01; ***, P < 0.001 by unpaired t test unless otherwise indicated.
Figure 6.
Figure 6.
The microbiota controls muscle repair. (A–C) Flow cytometric quantification of total immunocytes (A), myeloid cell populations (B), and MPCs (C) in hindlimb muscle 1 d after injury. (D) Representative images of H&E staining of hindlimb muscle 7 d after injury in conjunction with VMNA treatment ± a combination of rIL-17A and rIL-17F (rIL-17). Arrows indicate selected examples of large multinucleated cells. (E) Quantification of cross-sectional areas of individual centrally nucleated muscle fibers on H&E sections per panel (D). Left: Distribution of individual fibers area control (Ctl; SPF mice, PBS treated) versus VMNA and VMNA versus VMNA + rIL-17 comparisons via t test of weighted sums. Right: Average fiber areas for individual mice. (F) Quantification of muscle fibrotic area 7 d after injury using picrosirius red (PSR) staining. Results from three to five independent mice. Means ± SEM. *, P < 0.05; **, P < 0.01 using unpaired t test unless otherwise indicated. When three groups were analyzed, one-way ANOVA with Bonferroni post hoc test was performed.
Figure S5.
Figure S5.
The microbiota controls resolution of inflammation after muscle injury. (A) Flow cytometric quantification of total muscle immunocyte numbers 7 d after injury. (B) Flow cytometric analysis of neutrophil fractional representation (left) and numbers (right) in hindlimb muscles 7 d after injury. (C) Flow cytometric analysis of MO/MF subsets in hindlimb muscles 7 d after injury. Left: Fractional representation of Ly6Chi MO/MFs. Center: Numbers of Ly6Chi MO/MFs. Right: Numbers of Ly6Clo MO/MFs. Ctl, control. Mean ± SEM. No significant differences according to one-way ANOVA with Bonferroni post hoc test.

References

    1. Aguilar, C.A., Shcherbina A., Ricke D.O., Pop R., Carrigan C.T., Gifford C.A., Urso M.L., Kottke M.A., and Meissner A.. 2015. In vivo monitoring of transcriptional dynamics after lower-limb muscle injury enables quantitative classification of healing. Sci. Rep. 5:13885. 10.1038/srep13885 - DOI - PMC - PubMed
    1. Akitsu, A., Ishigame H., Kakuta S., Chung S.H., Ikeda S., Shimizu K., Kubo S., Liu Y., Umemura M., Matsuzaki G., et al. . 2015. IL-1 receptor antagonist-deficient mice develop autoimmune arthritis due to intrinsic activation of IL-17-producing CCR2+Vγ6+γδ T cells. Nat. Commun. 6:7464. 10.1038/ncomms8464 - DOI - PMC - PubMed
    1. Almada, A.E., Horwitz N., Price F.D., Gonzalez A.E., Ko M., Bolukbasi O.V., Messemer K.A., Chen S., Sinha M., Rubin L.L., et al. . 2021. FOS licenses early events in stem cell activation driving skeletal muscle regeneration. Cell Rep. 34:108656. 10.1016/j.celrep.2020.108656 - DOI - PMC - PubMed
    1. Alquicira-Hernandez, J., and Powell J.E.. 2021. Nebulosa recovers single cell gene expression signals by kernel density estimation. Bioinformatics. 10.1093/bioinformatics/btab003 - DOI - PubMed
    1. Alves de Lima, K., Rustenhoven J., Da Mesquita S., Wall M., Salvador A.F., Smirnov I., Cebinelli G.M., Mamuladze T., Baker W., Papadopoulos Z., et al. . 2020. Meningeal γδ T cells regulate anxiety-like behavior via IL-17a signaling in neurons. Nat. Immunol. 21:1421–1429. 10.1038/s41590-020s4150776-4 - DOI - PMC - PubMed

Publication types

Substances