. 2022 Jul;88(1):195-210.
doi: 10.1002/mrm.29201. Epub 2022 Apr 5.

Motion corrected silent ZTE neuroimaging

Affiliations

Motion corrected silent ZTE neuroimaging

Emil Ljungberg et al. Magn Reson Med. 2022 Jul.

Abstract

Purpose: To develop self-navigated motion correction for 3D silent zero echo time (ZTE) based neuroimaging and characterize its performance for different types of head motion.

Methods: The proposed method termed MERLIN (Motion Estimation & Retrospective correction Leveraging Interleaved Navigators) achieves self-navigation by using interleaved 3D phyllotaxis k-space sampling. Low resolution navigator images are reconstructed continuously throughout the ZTE acquisition using a sliding window and co-registered in image space relative to a fixed reference position. Rigid body motion corrections are then applied retrospectively to the k-space trajectory and raw data and reconstructed into a final, high-resolution ZTE image.

Results: MERLIN demonstrated successful and consistent motion correction for magnetization prepared ZTE images for a range of different instructed motion paradigms. The acoustic noise response of the self-navigated phyllotaxis trajectory was found to be only slightly above ambient noise levels (<4 dBA).

Conclusion: Silent ZTE imaging combined with MERLIN addresses two major challenges intrinsic to MRI (i.e., subject motion and acoustic noise) in a synergistic and integrated manner without increase in scan time and thereby forms a versatile and powerful framework for clinical and research MR neuroimaging applications.

Keywords: RUFIS; ZTE; motion correction; neuroimaging; silent MRI.


Figures

FIGURE 1
FIGURE 1
A, Illustration of two trajectories (each 1300 spokes) using different subsampling values k. A smooth phyllotaxis spiral interleave is only obtained with k being a Fibonacci number (e.g., k=13). B, Illustration of two interleaves (each 384 spokes) using different smoothing factors (s). A higher value of s produces smaller azimuthal increments (i.e., smoother and quieter trajectory) but larger polar increments (i.e., higher undersampling and streaking)
FIGURE 2
FIGURE 2
A, Schematic of the segmented ZTE pulse sequence starting with the WASPI acquisition followed by multiple interleaves, the first one serving as the reference for the registration. B, Example of a single phyllotaxis spiral interleaf consisting of three segments indicated by different colors. C, Example of a segmented acquisition where each segment is preceded by a 180° inversion pulse and a T1 recovery period (TI) to produce T1 contrast. Any set of three adjacent segments can be reconstructed to produce a navigator image, indicated by the reconstruction window Wx
FIGURE 3
FIGURE 3
Flowchart of the self‐navigated MERLIN motion estimation and retrospective correction framework. For illustration, the full trajectory consists of only three interleaves. The trajectory and k‐space data are split into separate interleaves (1; I1, I2, I3 ) and reconstructed into navigator images (2; N1, N2, N3 ), which are then registered to a reference state to estimate rigid body motion (3). Rotational motion is corrected for by rotating the trajectory (4.1) and translational motion is corrected for by applying a linear phase ramp to the k‐space data (4.2). The corrected k‐space trajectory and data are then combined and reconstructed into a single motion corrected image
FIGURE 4
FIGURE 4
A, Acoustic noise measurements (LAeq) for different smoothing factors, and readout BWs as a function of the number of spokes per interleave (N s), with comparison to a non‐interleaved reference acquisition and the ambient noise levels. B, Example of trajectories with different number of spokes per interleave and smoothing factors as used in (A)
FIGURE 5
FIGURE 5
A, Comparison of image quality in the phantom data for different number of spokes and trajectory smoothing factors. B, Quantitative assessment of image quality using mSSIM in the navigator images relative to the reference in (C), with the SSIM calculated within the mask outlined in yellow
FIGURE 6
FIGURE 6
A, Example of navigator images with different number of spokes per interleave. B, Frequency analysis of the estimated motion parameters from a static acquisition with detrending, showing a clear peak at the frequency corresponding to the golden angle ϕG
FIGURE 7
FIGURE 7
Axial slices and motion estimates from subject 3 demonstrating clearly improved image quality after motion correction. The gray region in the time series indicates the short time window at the beginning of the acquisition which is not motion corrected including dummy segments and the low resolution WASPI acquisition. The padding from the head rest is visible posterior to the head; a unique feature of ZTE acquisitions which have increased sensitivity to materials with ultra‐short T2. Images have been bias field corrected and windowed for optimal viewing quality
FIGURE 8
FIGURE 8
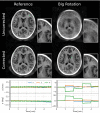
Additional views from subject 3 before and after motion correction. A, The reference image, without intended motion, shows improvement after motion correction due to unintentional x and y rotations (see Figure 7). B, Improvements for nodding motion are best seen in the sagittal plane. C, Improvements for continuous motion are best appreciated in the zoomed frontal lobe region
FIGURE 9
FIGURE 9
Axial slices and motion estimates from subject 1 demonstrating the improvement in image quality after motion correction, with rotations up to 20°. The gray region in the time series indicate the short time window of the acquisition which is not motion corrected including dummy segments and the low resolution WASPI acquisition
FIGURE 10
FIGURE 10
Quantitative assessments of the improvement in image quality after motion correction measured using the AES (A) and the mSSIM (B) both evaluated relative to the first, non‐motion corrected, static scan

References

    1. Nguyen XV, Tahir S, Bresnahan BW, et al. Prevalence and financial impact of claustrophobia, anxiety, patient motion, and other patient events in magnetic resonance imaging. Top Magn Reson Imaging. 2020;29:125‐130. - PubMed
    1. Foster JR, Hall DA, Summerfield AQ, Palmer AR, Bowtell RW. Sound‐level measurements and calculations of safe noise dosage during EPI at 3 T. J of Magn Reson Imaging. 2000;12:157‐163. - PubMed
    1. Sartoretti E, Sartoretti T, Wyss M, van Smoorenburg L, van der Duim S, Cereghetti D, Binkert CA, Sartoretti‐Schefer S, Najafi A, et al. Impact of acoustic noise reduction on patient experience in routine clinical magnetic resonance imaging. Acad Radiol. 2022;29:269‐276. - PubMed
    1. Chou IJ, Tench CR, Gowland P, et al. Subjective discomfort in children receiving 3 T MRI and experienced adults' perspective on children's tolerability of 7T: a cross‐sectional questionnaire survey. BMJ Open. 2014;4:e006094. - PMC - PubMed
    1. Andre JB, Bresnahan BW, Mossa‐Basha M, et al. Toward quantifying the prevalence, severity, and cost associated with patient motion during clinical MR examinations. J Am Coll Radiol. 2015;12:689‐695. - PubMed

Publication types

Substances