. 2022 Jun 1;110(11):1788-1805.e10.
doi: 10.1016/j.neuron.2022.03.008. Epub 2022 Apr 4.

Astrocytes and oligodendrocytes undergo subtype-specific transcriptional changes in Alzheimer's disease

Affiliations

Astrocytes and oligodendrocytes undergo subtype-specific transcriptional changes in Alzheimer's disease

Jessica S Sadick et al. Neuron. .

Abstract

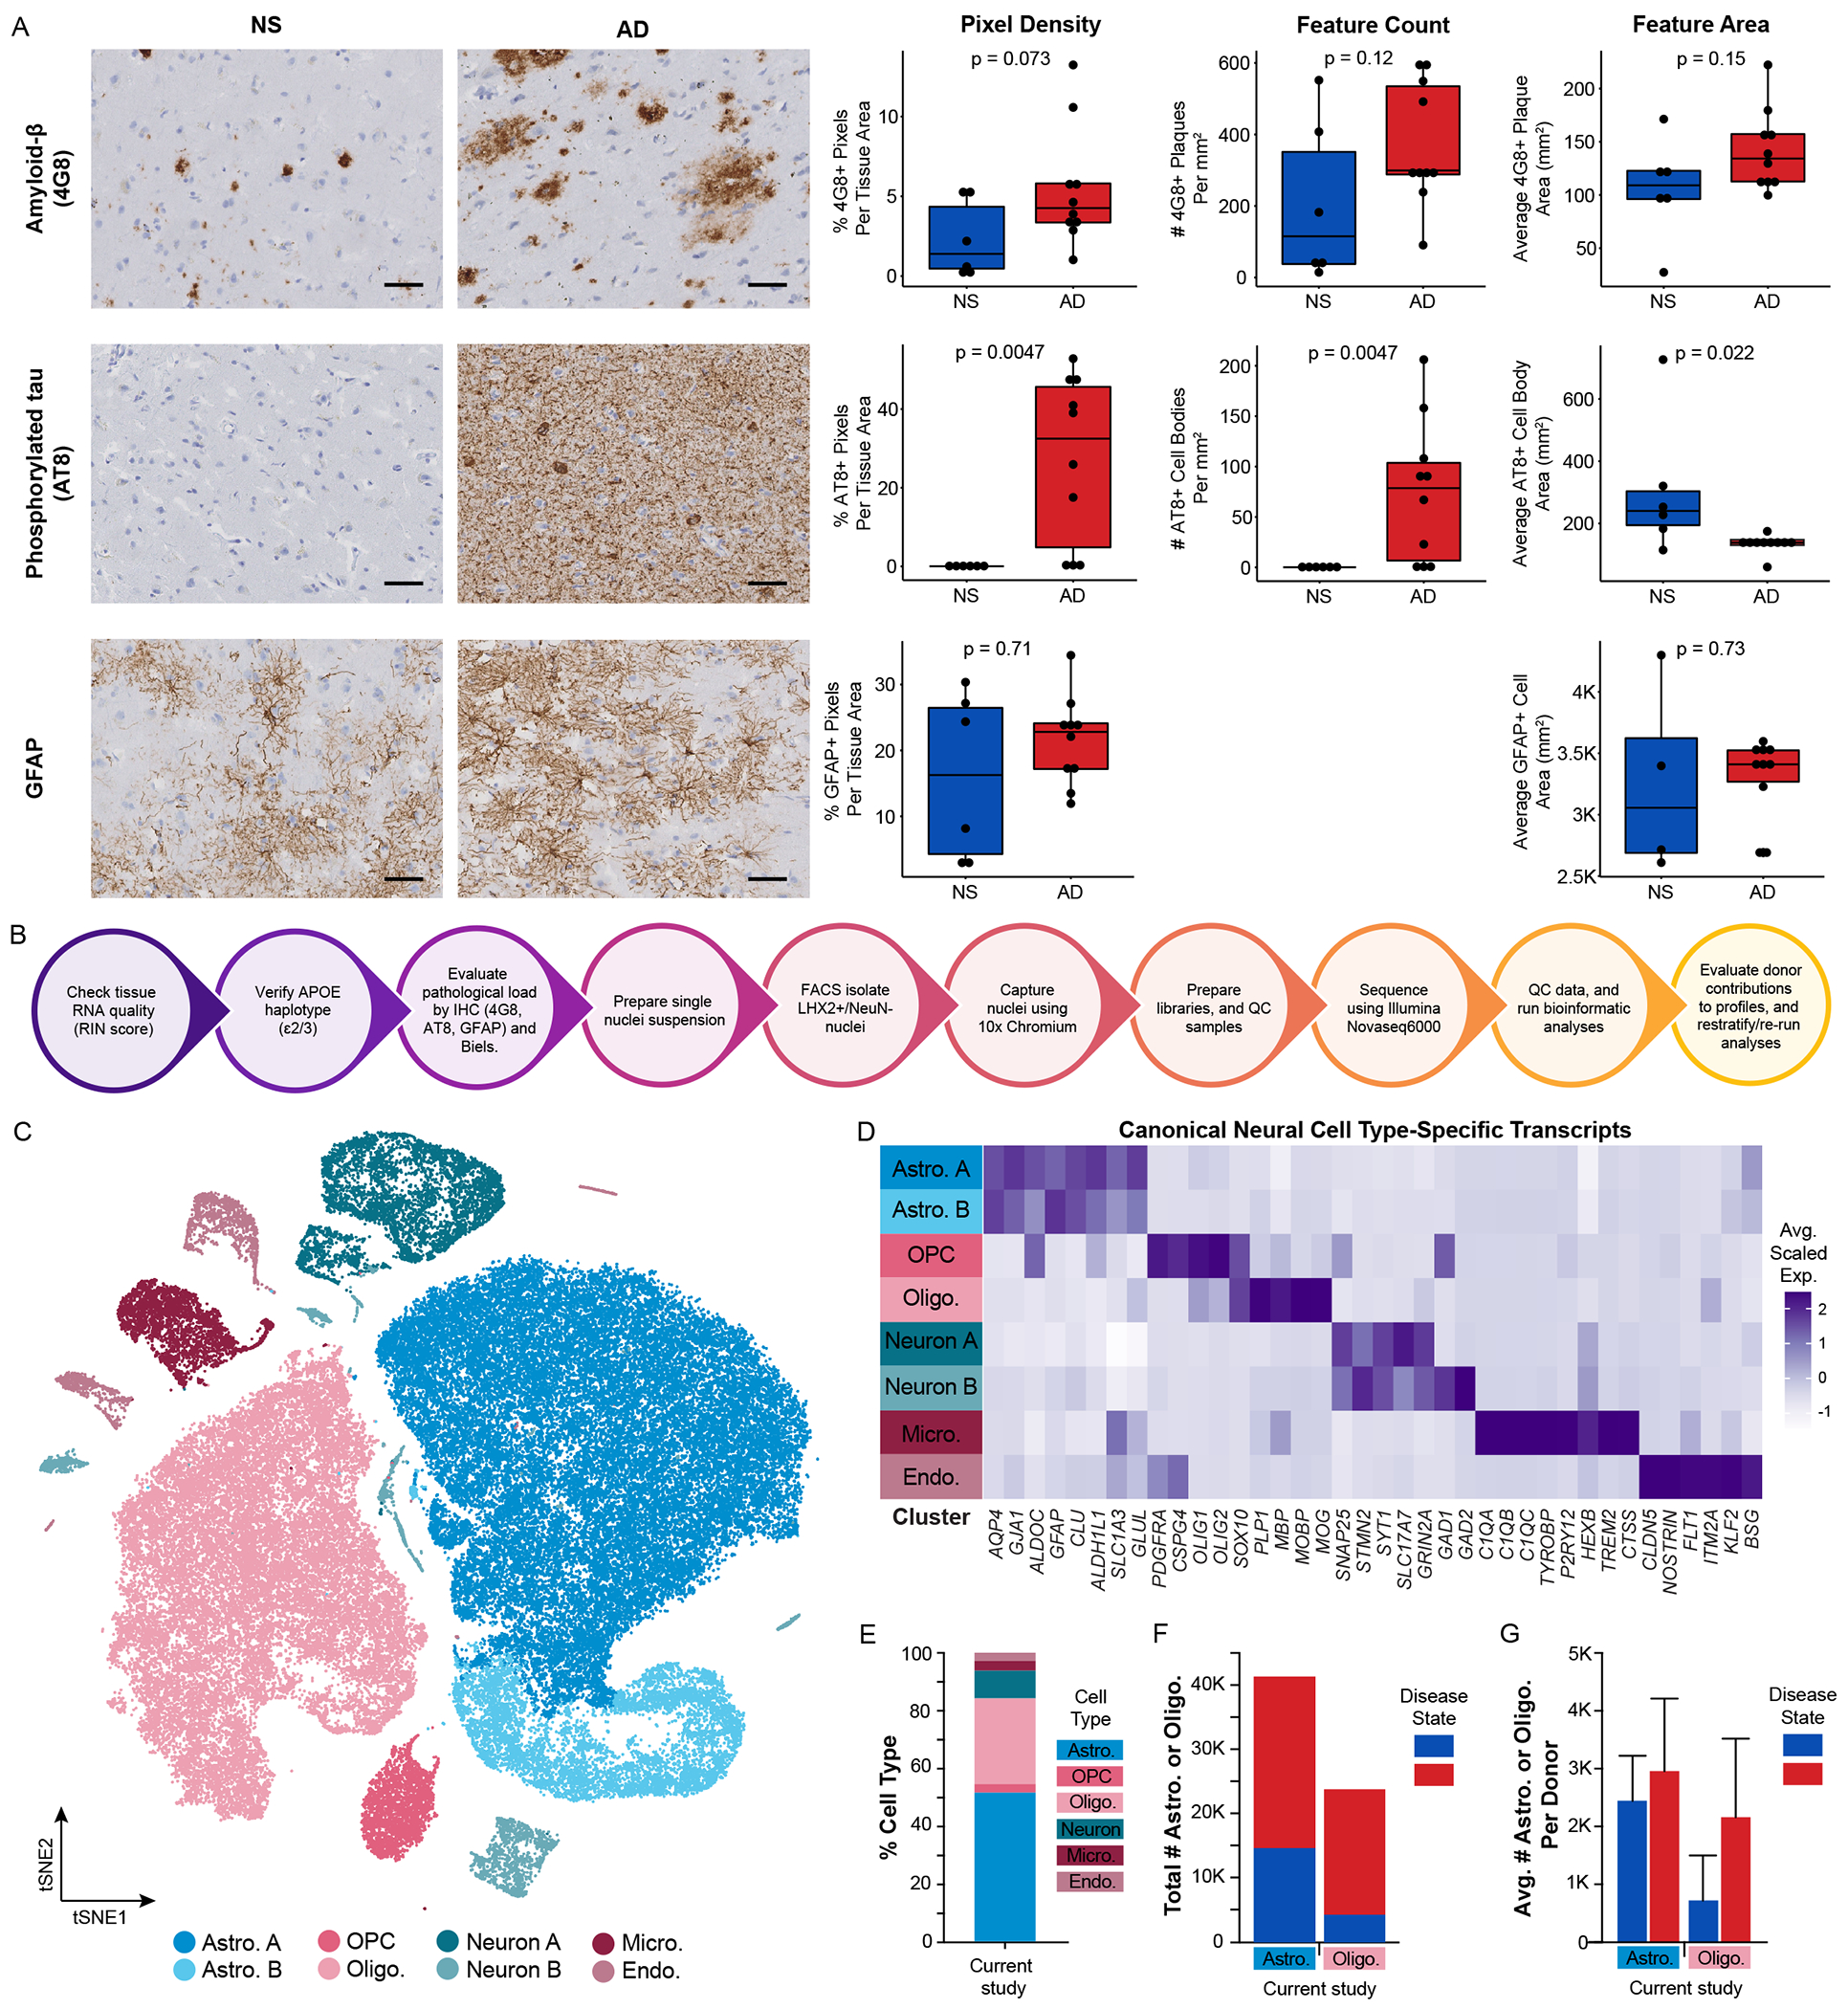
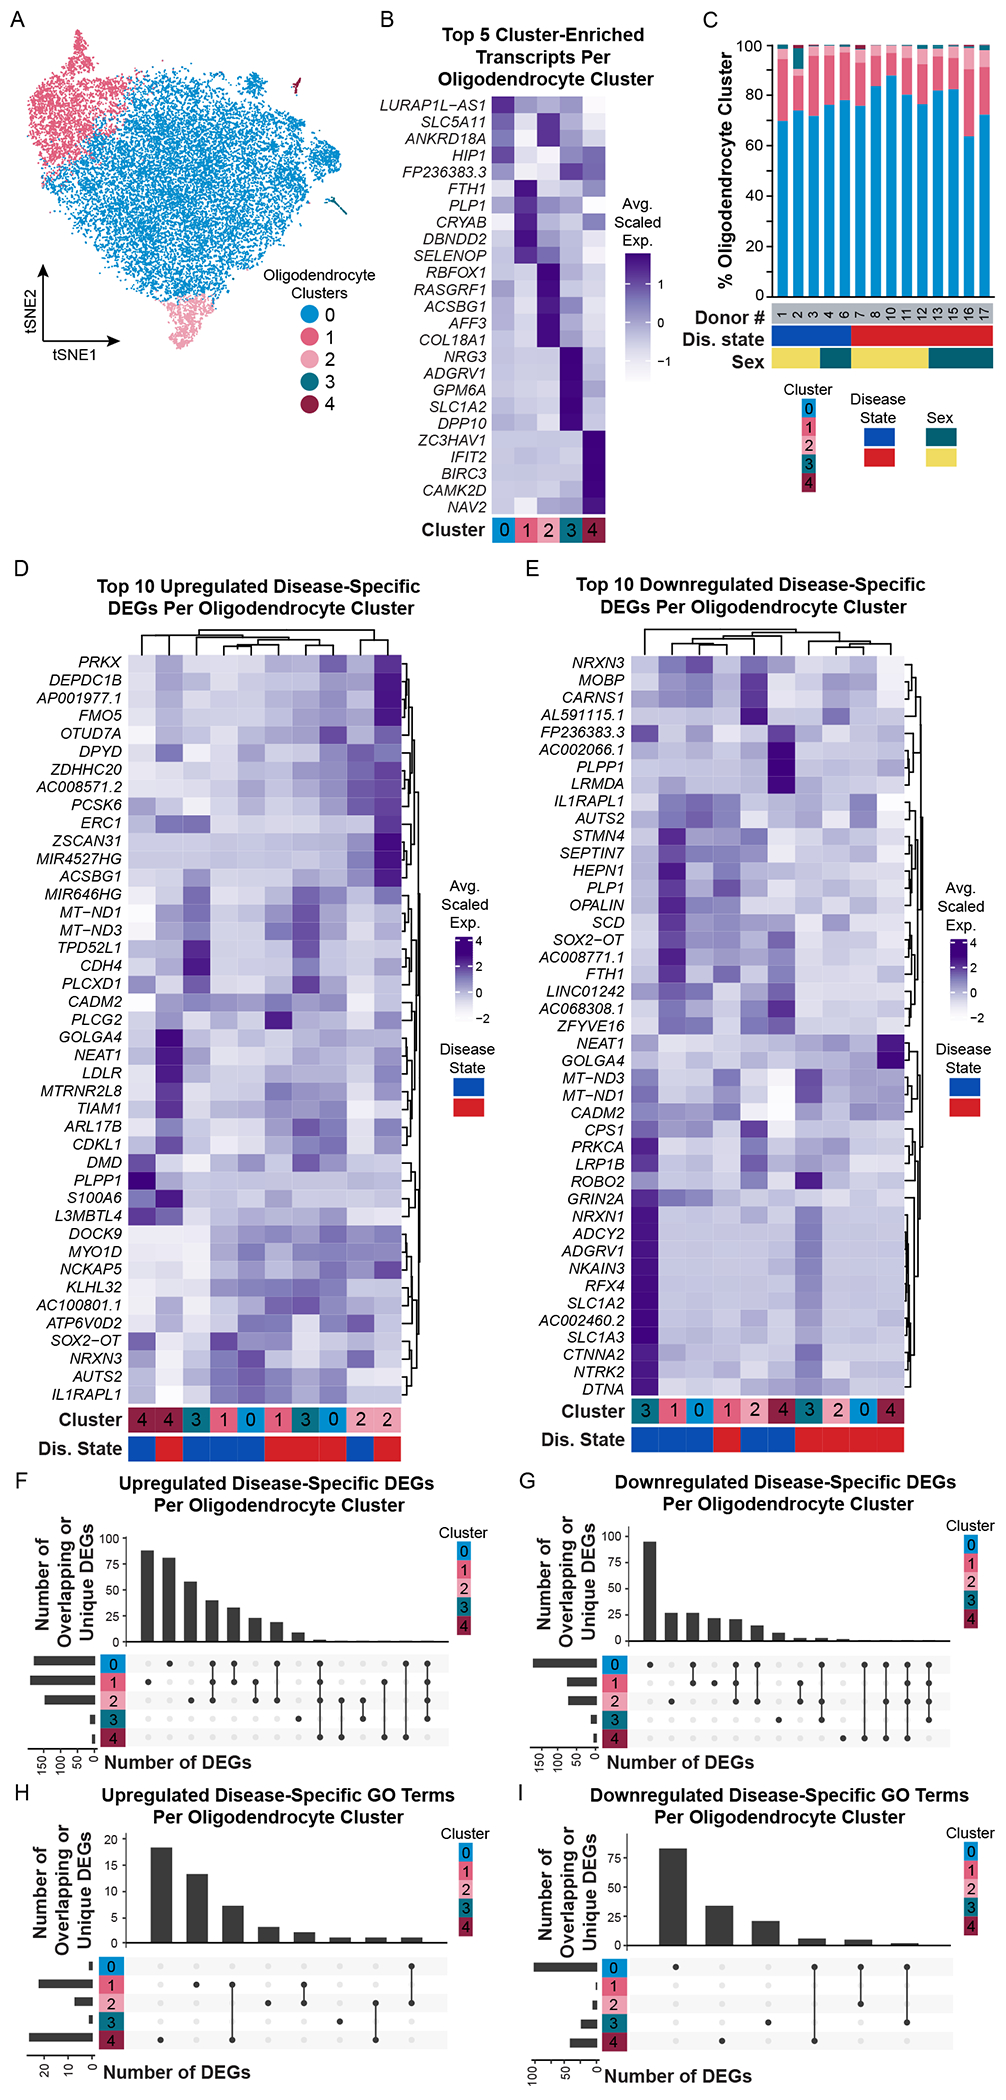
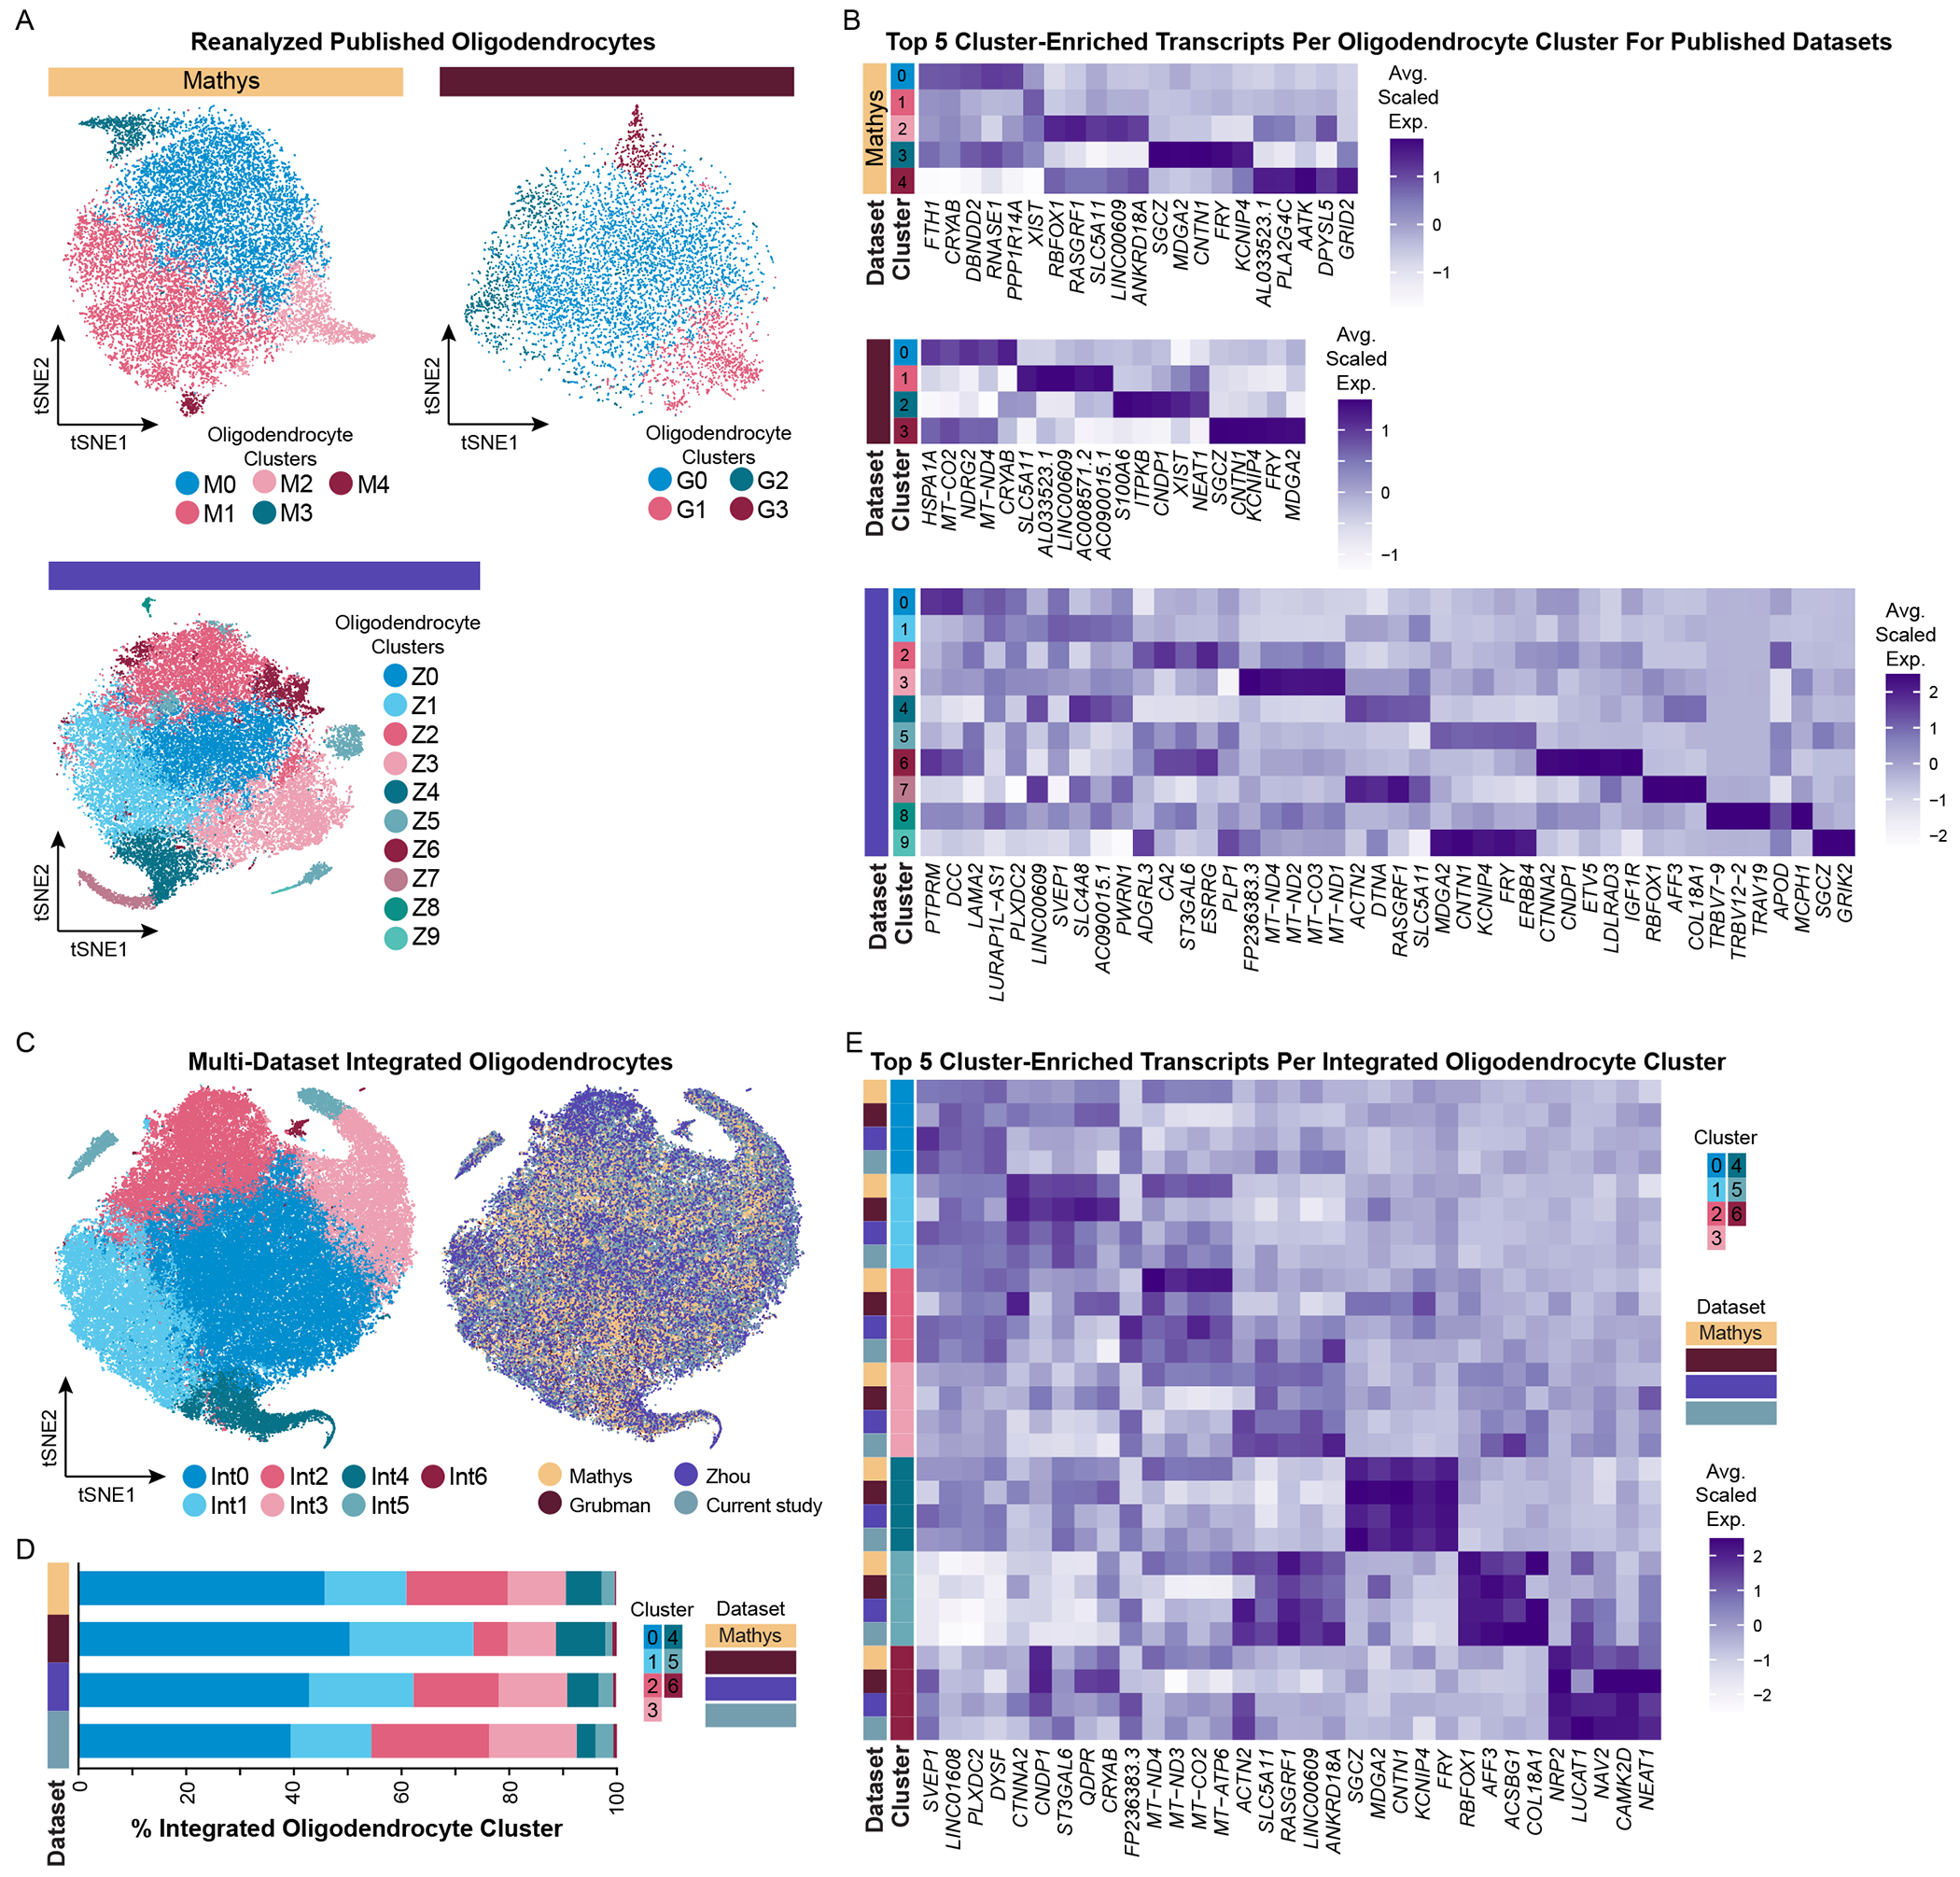
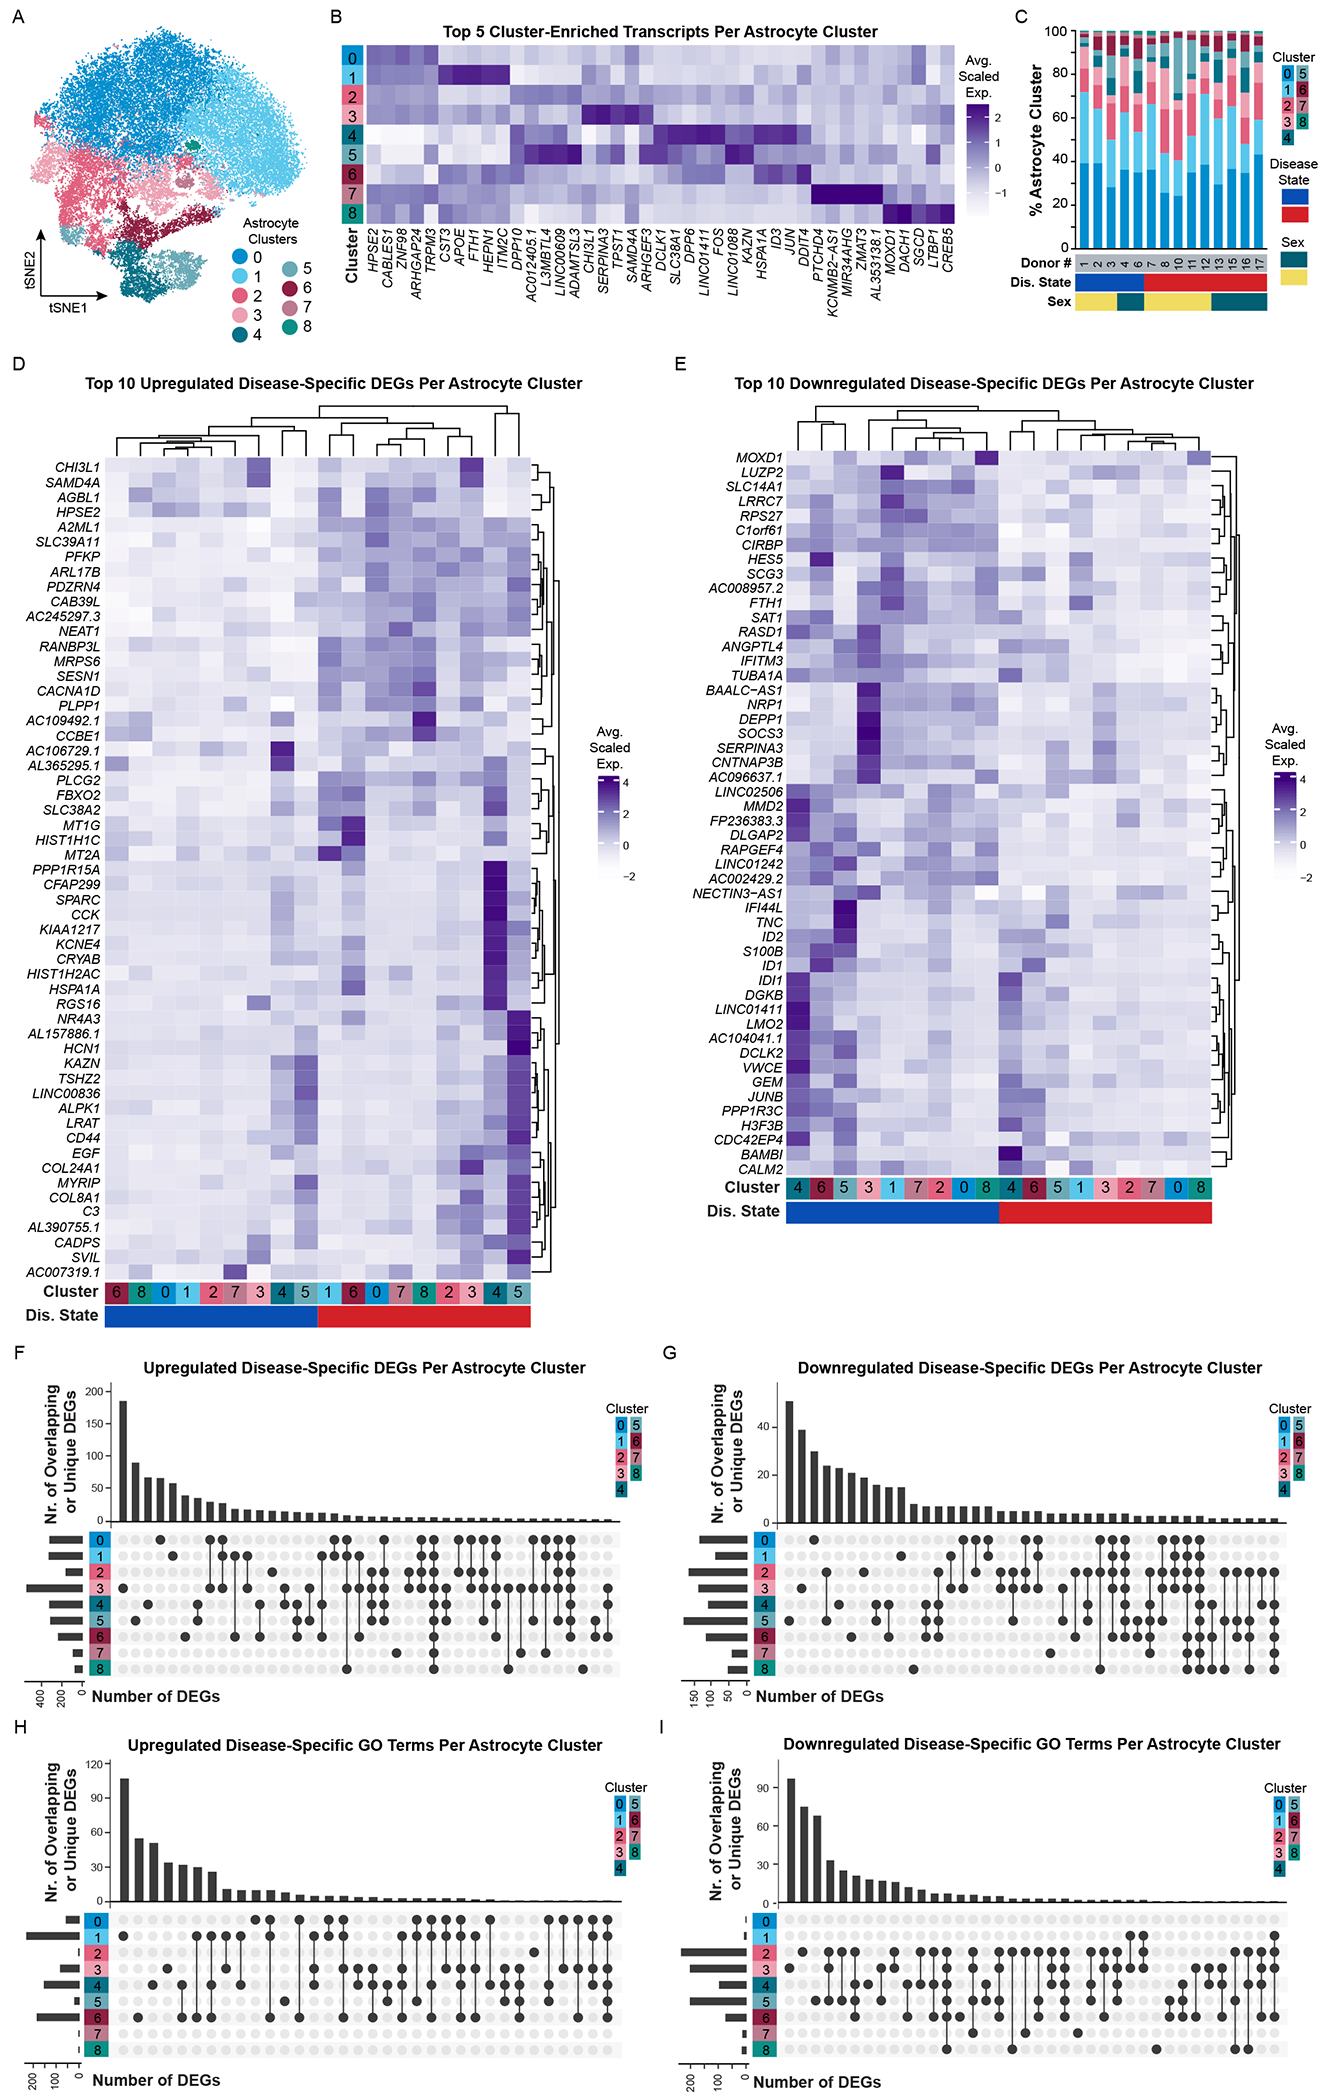
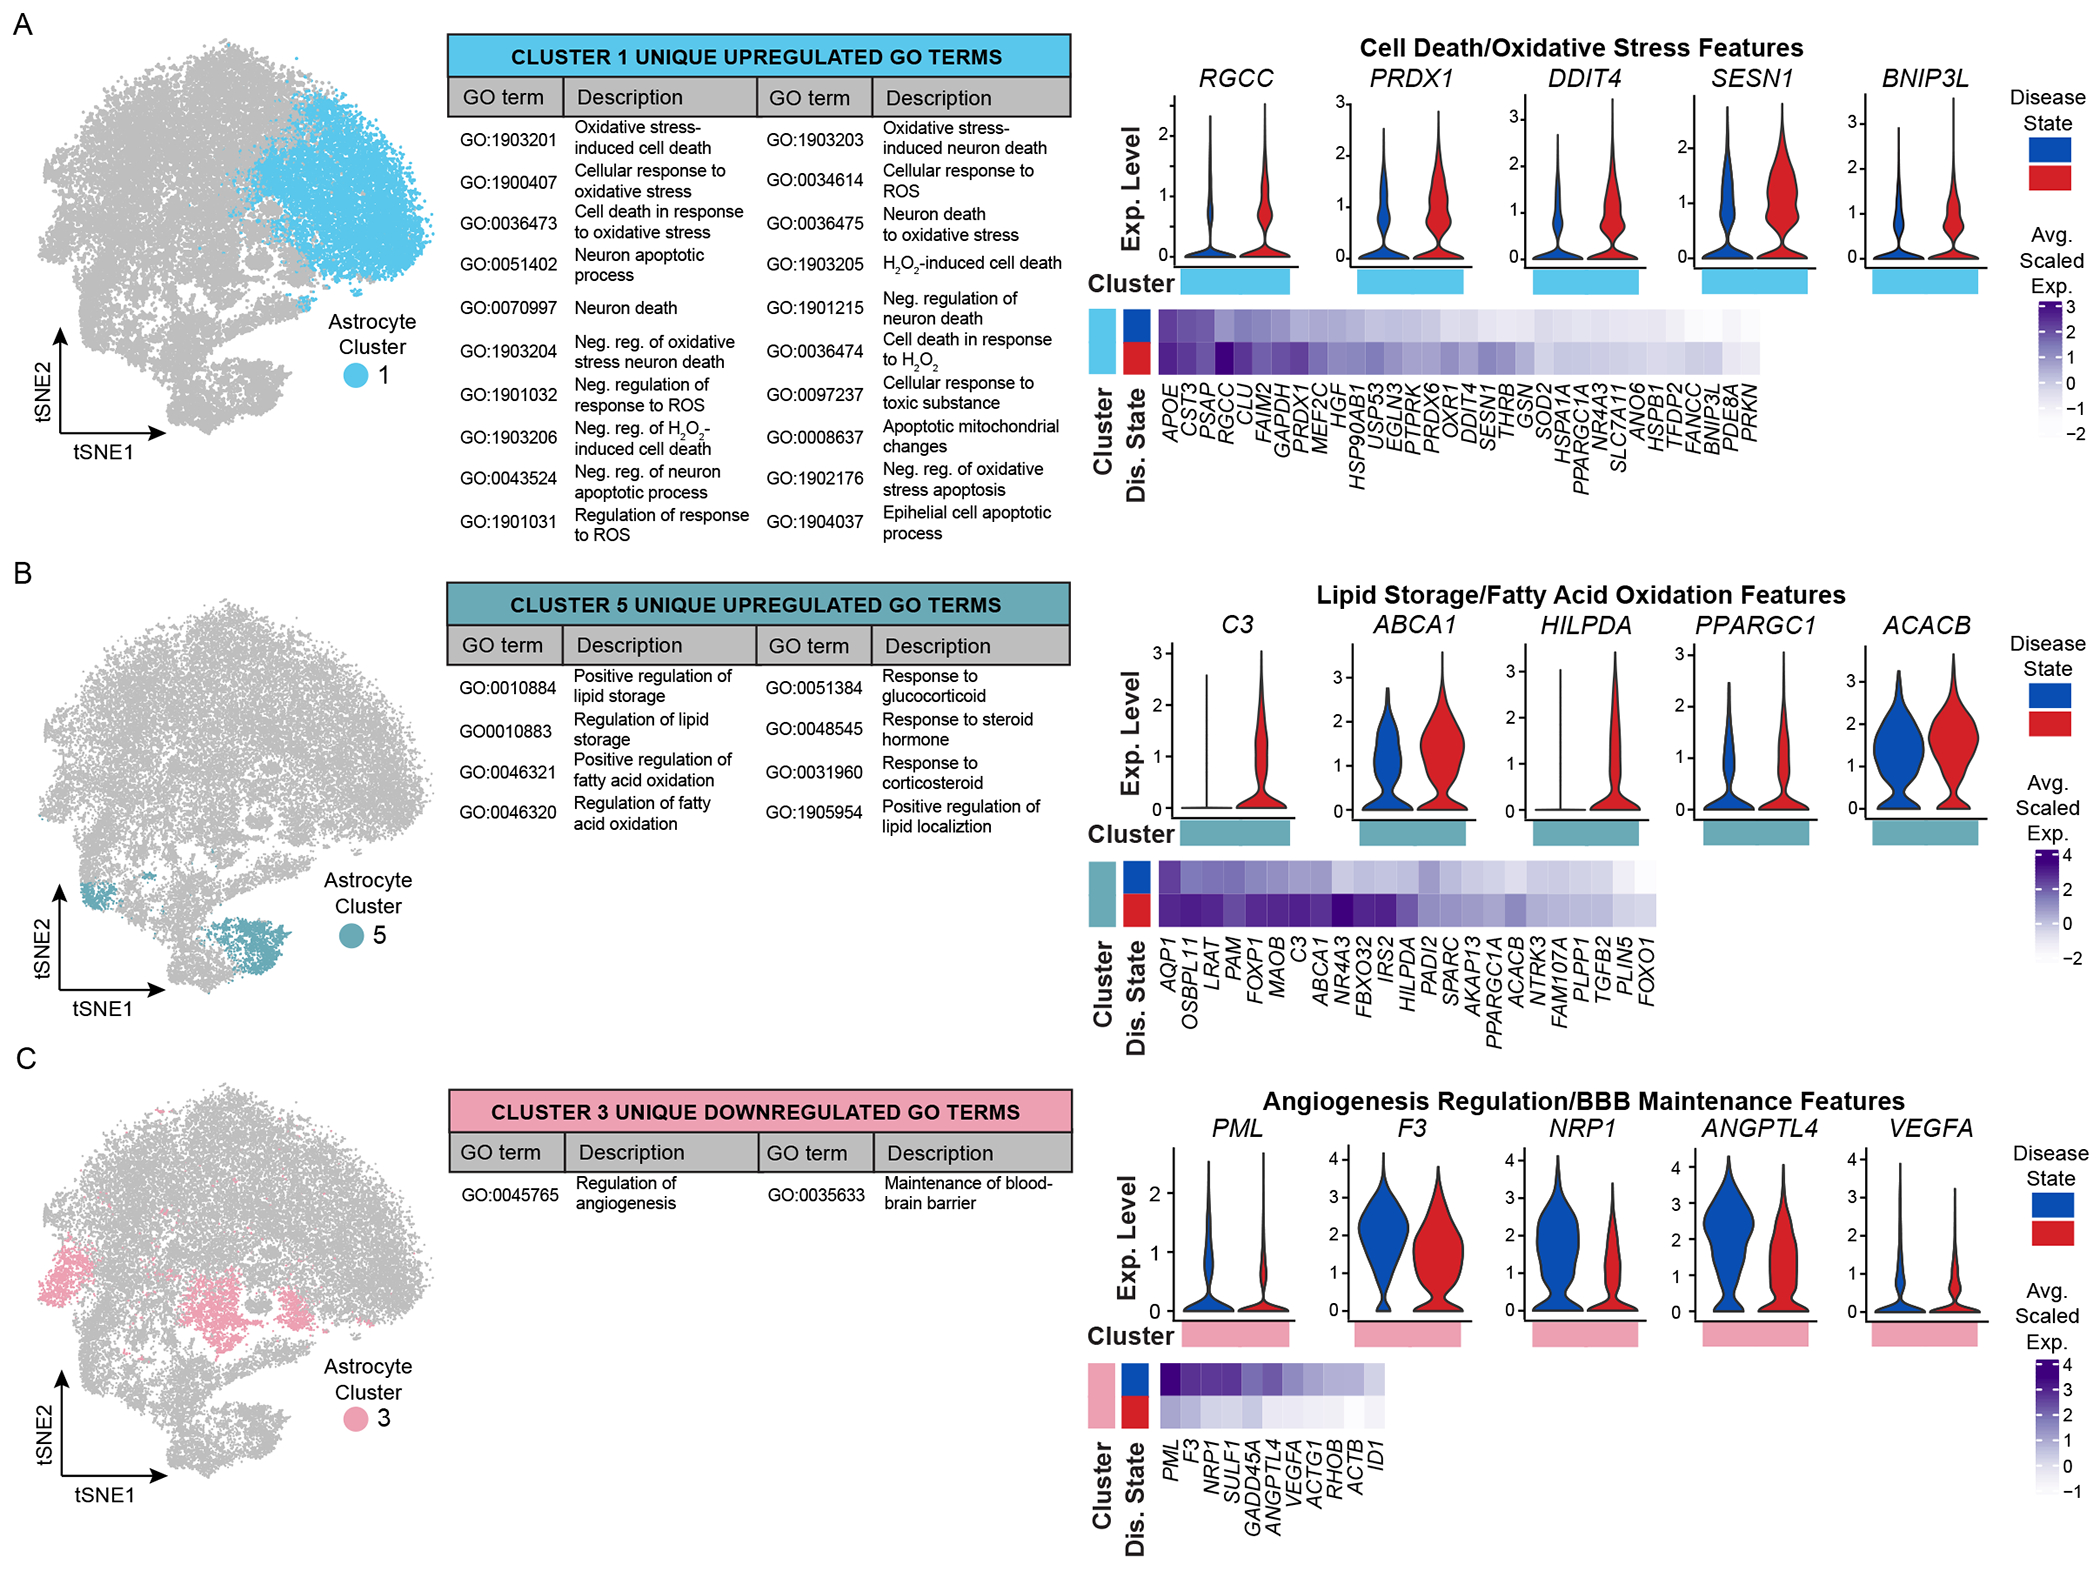
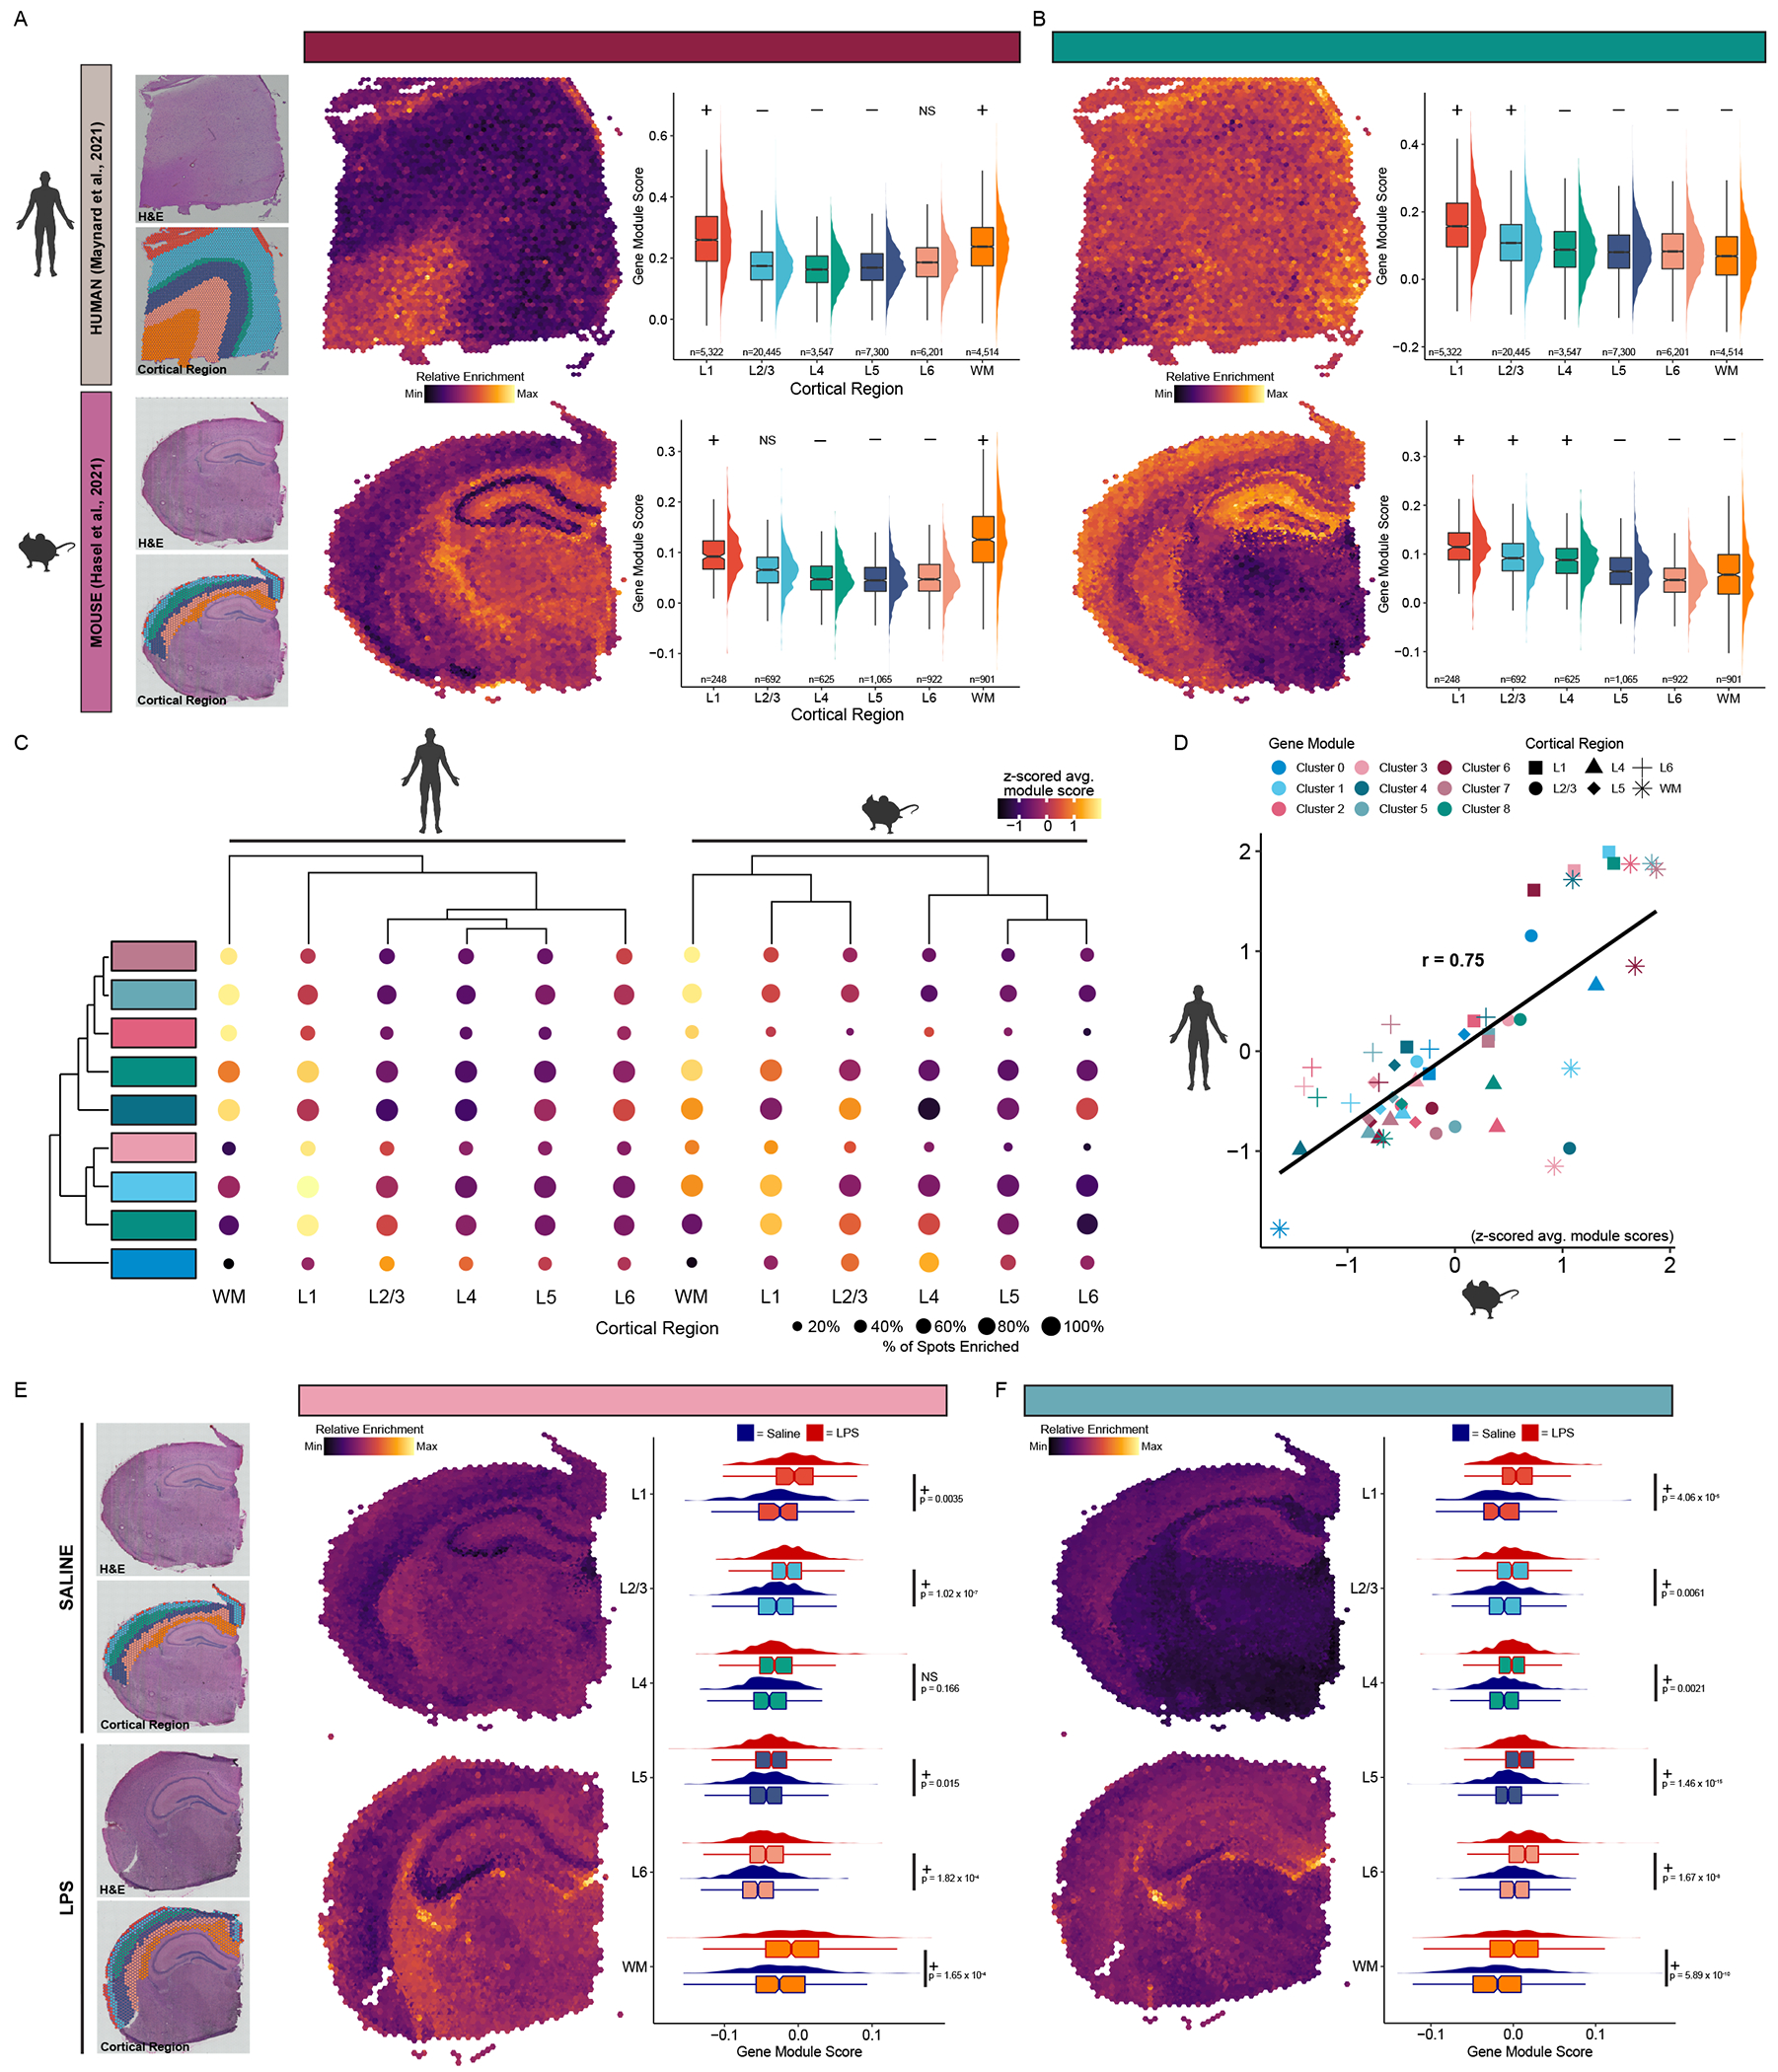
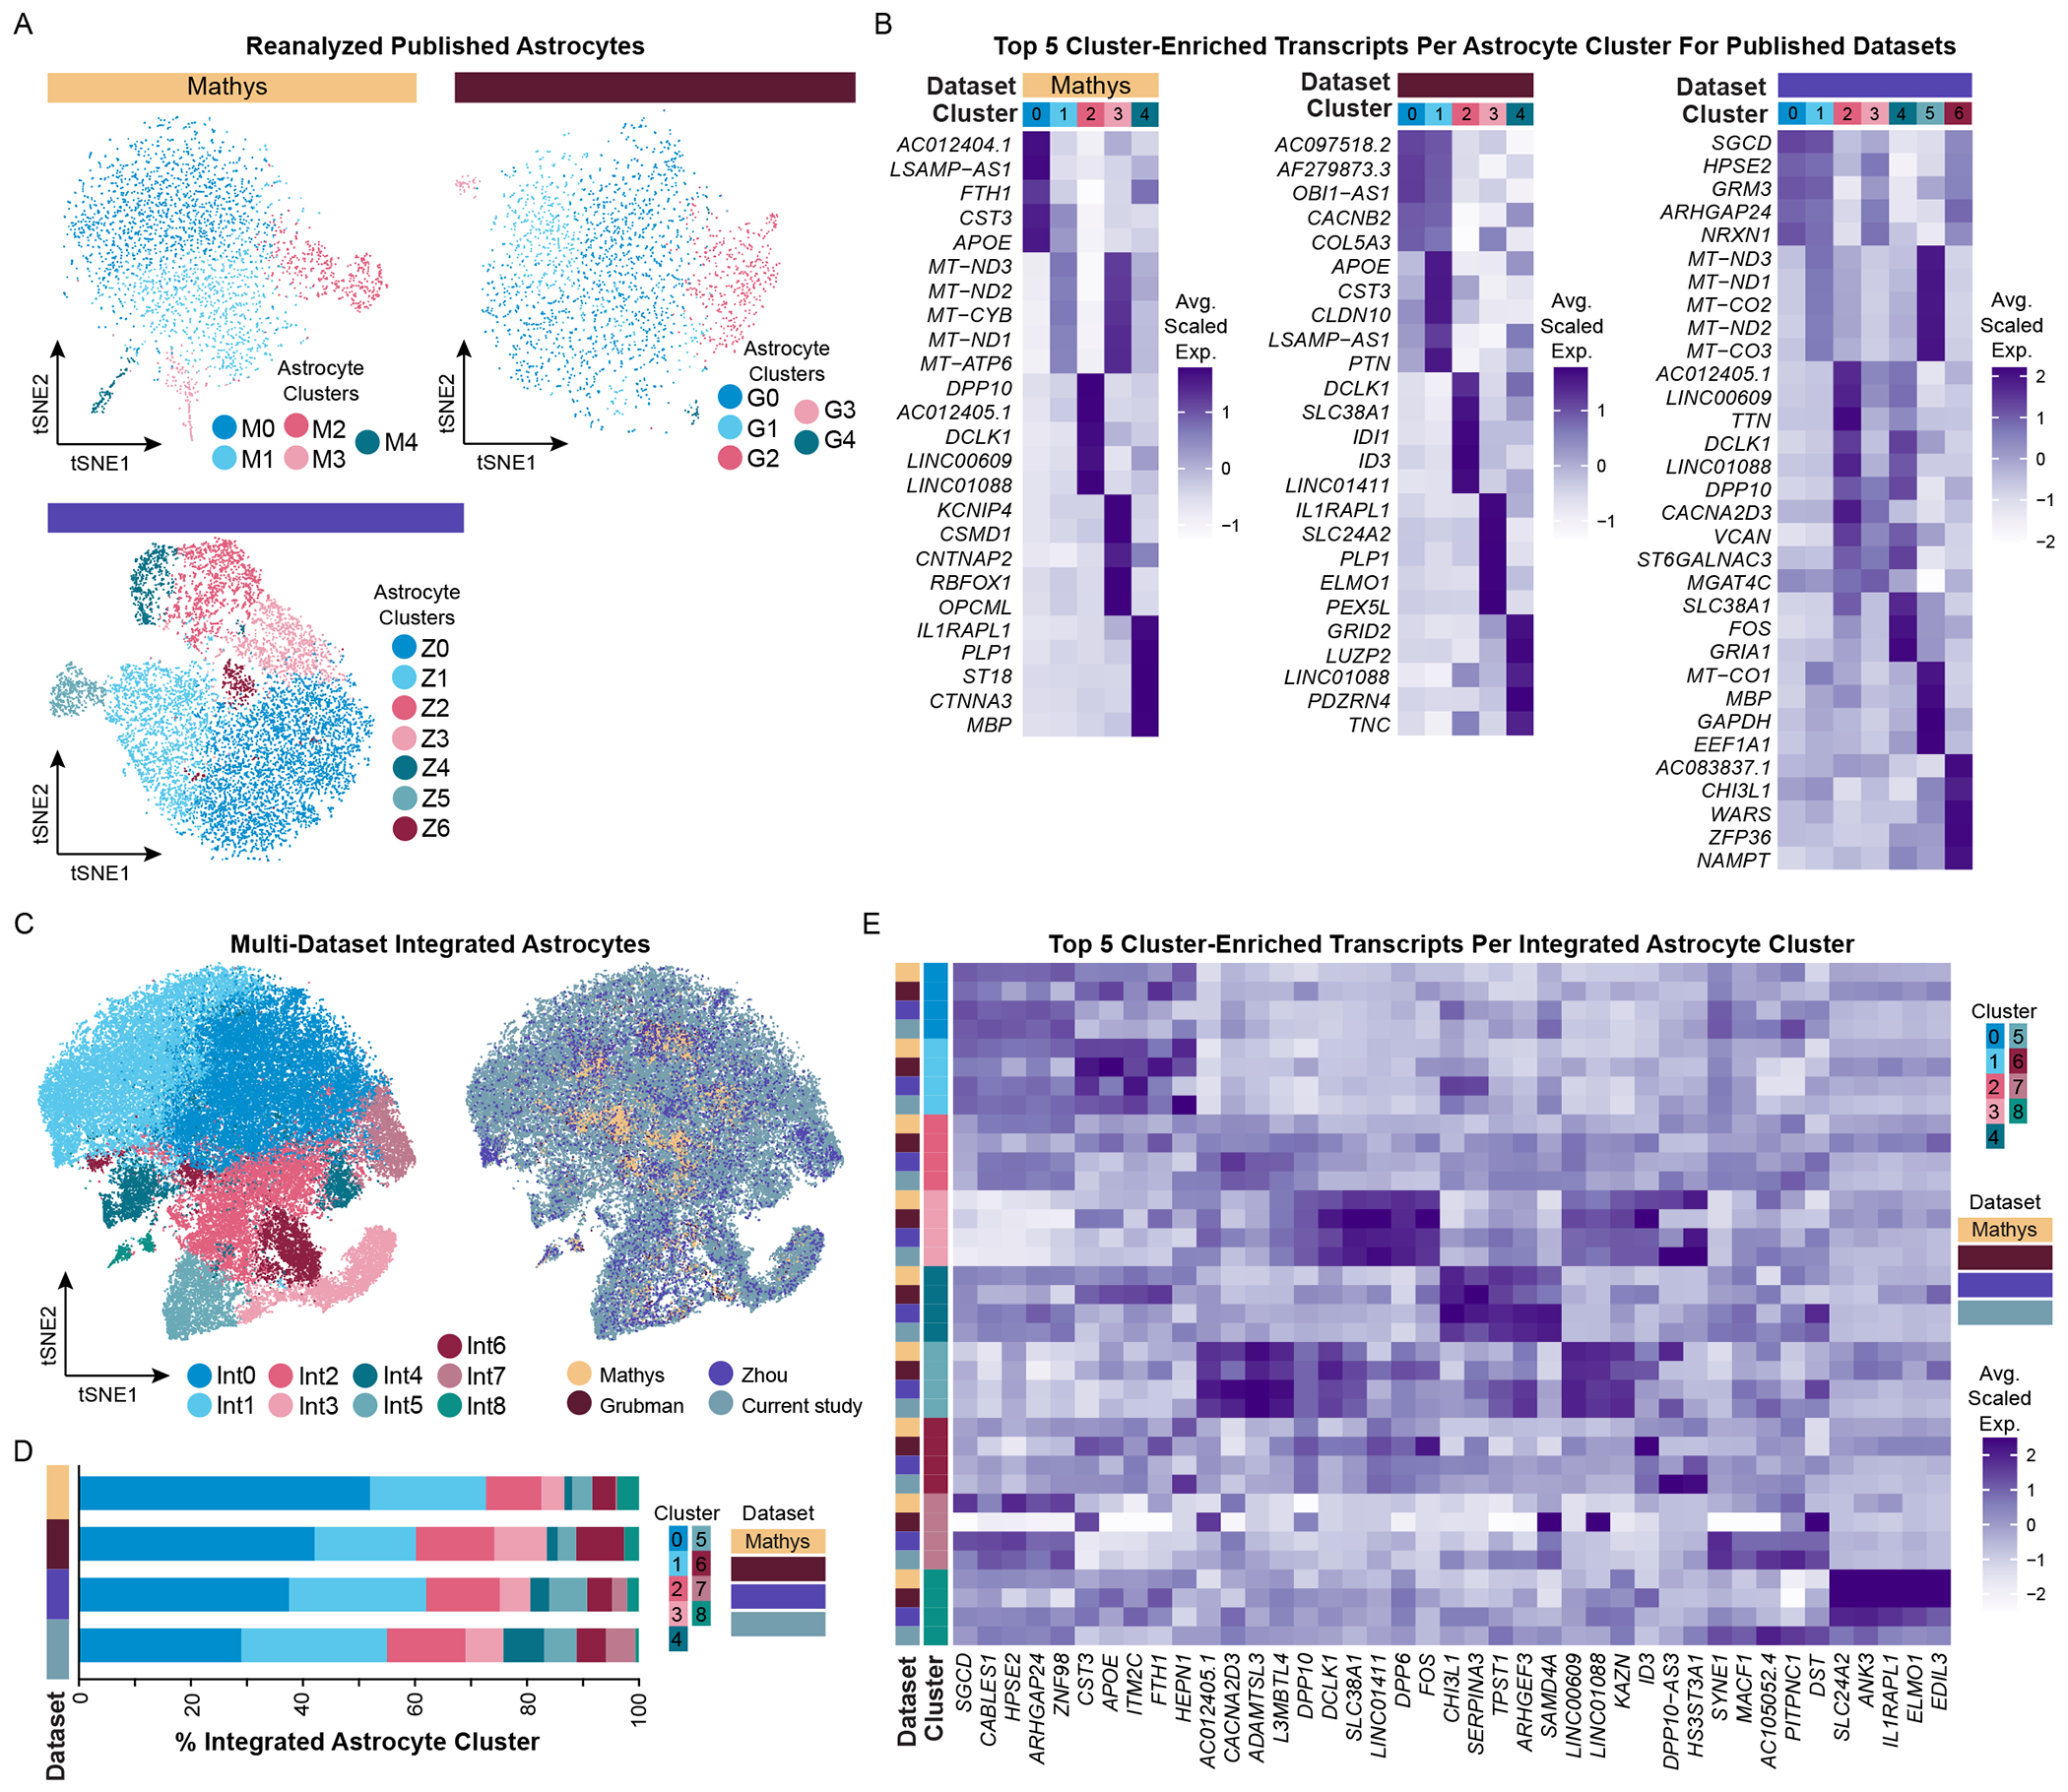
Resolving glial contributions to Alzheimer's disease (AD) is necessary because changes in neuronal function, such as reduced synaptic density, altered electrophysiological properties, and degeneration, are not entirely cell autonomous. To improve understanding of transcriptomic heterogeneity in glia during AD, we used single-nuclei RNA sequencing (snRNA-seq) to characterize astrocytes and oligodendrocytes from apolipoprotein (APOE) Ɛ2/3 human AD and age- and genotype-matched non-symptomatic (NS) brains. We enriched astrocytes before sequencing and characterized pathology from the same location as the sequenced material. We characterized baseline heterogeneity in both astrocytes and oligodendrocytes and identified global and subtype-specific transcriptomic changes between AD and NS astrocytes and oligodendrocytes. We also took advantage of recent human and mouse spatial transcriptomics resources to localize heterogeneous astrocyte subtypes to specific regions in the healthy and inflamed brain. Finally, we integrated our data with published AD snRNA-seq datasets, highlighting the power of combining datasets to resolve previously unidentifiable astrocyte subpopulations.

Keywords: Alzheimer's disease; astrocyte; dataset integration; glia; heterogeneity; inflammation; neurodegeneration; oligodendrocyte; single-nuclei sequencing; spatial transcriptomics.


Conflict of interest statement

Declarations of interests S.A.L. is a founder of AstronauTx Ltd and a member of its scientific advisory board. All other authors declare no competing interests.

Figures

Figure 1.
Figure 1.. Defining a well-controlled patient cohort is key for defining AD-associated gene expression profiles.
(A) Representative micrographs and corresponding quantification in non-symptomatic (NS) and AD donors of immunohistochemistry for amyloid-β plaques (4G8), phosphorylated tau (AT8), and GFAP. Scale bars are 50 μm. Raw quantification values are displayed as well as mean ± s.d. (B) Workflow for donor quality control and astrocyte enrichment strategy. (C) tSNE plot of total nuclei (N = 80,247) and (D) corresponding average scaled expression heatmap of cell type-specific transcripts by cluster. (E) Cell type proportions of total nuclei captured, (F) total numbers of astrocytes and oligodendrocytes captured split by disease state, and (G) average number of astrocytes and oligodendrocytes captured per donor split by disease state: NS (blue), AD (red). Abbreviations: AD, Alzheimer’s disease; Astro., astrocyte; Endo., endothelial cell; FACS, fluorescence-activated cell sorting; GFAP, glial fibrillary acidic protein; IHC, immunohistochemistry; Micro., microglia; NS, non-symptomatic; Oligo., oligodendrocyte; OPC, oligodendrocyte precursor cell; RIN, RNA Integrity Number. See also Figures S1–S3.
Figure 2.
Figure 2.. Oligodendrocytes are minimally heterogeneous but have cluster-specific transcriptomic changes in Alzheimer’s disease.
(A) tSNE plot of oligodendrocyte nuclei (N = 23,840) and (B) corresponding average scaled expression heatmap of top 5 enriched/unique transcripts per cluster. (C) Proportion of oligodendrocyte clusters identified in each donor. Additional donor metavariables highlighted include disease state (blue, NS; red, AD) and sex (green, female; yellow, male). Average scaled expression of the top 10 (D) upregulated and (E) downregulated disease-specific differentially expressed genes (DEGs) split by cluster. (F-I) UpSetR plots highlighting upregulated and downregulated DEGs or GO terms that are unique to or shared between clusters. Bars show number of DEGs per cluster (colored at left). Lines between cluster highlight shared DEGs. Abbreviations: AD, Alzheimer’s disease; D#, donor number; DEG, differentially expressed gene; Dis., disease; F, female; GO, gene ontology; M, male; NS, non-symptomatic. See also Figures S4, S5.
None
Integration of oligodendrocytes from multiple datasets reveals consistent identification of oligodendrocyte subtypes.
(A) tSNE plots of reanalyzed oligodendrocytes from published snRNA-seq datasets (Mathys, N = 18,229; Grubman, N = 7,604; Zhou, N = 34,949) and (B) their corresponding average scaled expression heatmap of the top 5 cluster-enriched/unique transcripts per cluster for each dataset. (C) tSNE plots of integrated oligodendrocytes (N = 84,622) visualized by cluster (left) and by dataset (right). (D) Proportion of integrated clusters split by dataset. (E) Average scaled expression heatmap of top 5 integrated oligodendrocyte cluster-enriched/unique transcripts by cluster and by dataset. See also Figures S6–S8, S13.
Figure 4.
Figure 4.. Astrocytes are heterogeneous and have both common and cluster-specific transcriptomic changes in Alzheimer’s disease.
(A) tSNE plot of astrocyte nuclei (N = 41,071) and (B) corresponding average scaled expression heatmap of top 5 enriched/unique transcripts per cluster. (C) Proportion of astrocyte clusters identified in each donor. Additional donor metavariables highlighted include disease state (blue, NS donors; red, AD donors) and sex (green, female; yellow, male). Average scaled expression of the top 10 (D) upregulated and (E) downregulated disease-specific differentially expressed genes (DEGs) split by cluster. (F-I) UpSetR plots highlighting upregulated and downregulated DEGs or GO terms that are unique to or shared between clusters. Abbreviations: AD, Alzheimer’s disease; D#, donor number; DEG, differentially expressed gene; Dis., disease; F, female; GO, gene ontology; M, male; NS, non-symptomatic. See also Figure S11.
Figure 5.
Figure 5.. Astrocyte transcriptomic profiles suggest cluster-specific gain and loss of functional changes in Alzheimer’s disease.
tSNE plots highlighting several clusters of interest, unique/shared GO terms, and differentially expressed genes (DEGs) associated with GO terms. GO-associated DEGs are presented as average scaled expression heatmaps by cluster of interest and split by disease state (blue, NS donors; red, AD donors). DEGs are highlighted on violin plots to resolve the range of expression (log normalized UMI counts) across all astrocytes in single or multiple clusters. (A) Upregulated cell death and oxidative stress features unique to cluster 1. (B) Upregulated lipid storage and fatty acid oxidation features unique to cluster 5. (C) Downregulation of angiogenesis regulation and blood brain barrier maintenance features unique to cluster 3. Abbreviations: AD, Alzheimer’s disease; BBB, blood-brain barrier; DEG, differentially expressed genes; Dep., dependent; Dis., disease; GO, gene ontology; H2O2, hydrogen peroxide; Neg., negative; NS, non-symptomatic; Reg., regulation; ROS, reactive oxygen species; UMI, unique molecular identifier. See also Figures S9–S11.
Figure 6.
Figure 6.. Astrocyte subtypes are regionally heterogeneous.
Visualization and differential enrichment results for Cluster 6 marker genes enriched in Layer 1 and white matter (A), and Cluster 8 genes enriched in the upper layers of the cortex (B). For both: Upper: human spatial transcriptomics data from Maynard et al. (2021). Lower: mouse spatial transcriptomics data from Hasel et al. (2021). (leftmost) H&E staining and regional annotation of spots from the representative Visium section. Relative enrichment of cluster gene module section, and box and density plots of gene module scores across all spots and all sections grouped by cortical region for Clusters 6 and 8. Cluster gene modules were significantly enriched (+) or de-enriched (−) in spots from the indicated region compared to the rest of the cortex (Wilcoxon rank sum test with Bonferroni correction). (C) Summary dot plot of astrocyte cluster gene modules across human (left) and mouse (right) cortical regions. Dots colored by z-scored average gene module score. Dot sizes correspond to the percentage of spots with a gene module score greater than zero, indicating elevated expression of the geneset compared to control genesets (see Methods). (D) Scatter plot comparing z-scored average gene module scores across region and clusters between human and mouse showing cluster module enrichment is similar. A linear regression line is shown (r refers to Pearson’s r correlation coefficient). (E) Relative enrichment of Cluster 3 module overlaid on saline (upper) and LPS (lower) sections. Box & density plot comparing expression of Cluster 3 module across spots in LPS-versus saline-injected mice (right). (F) Relative enrichment of genes upregulated in Cluster 8 in AD overlaid on saline (top) and LPS (bottom) sections. Box & density plot comparing expression of Cluster 8 AD module across cortical regions in LPS-versus saline-injected mice (right). For (E-F): +/− symbol represents whether the Cluster 3 module is significantly upregulated or downregulated in spots from the indicated region in LPS versus saline-injected mice (Wilcoxon rank sum test with Bonferroni correction). See Table S7 for test statistics and p-values. Abbreviations: AD, Alzheimer’s disease; NS, non-significant; H&E, hematoxylin & eosin; LPS, lipopolysaccharide. See also Figure S12.
Figure 7.
Figure 7.. Integrating astrocyte snRNA-seq datasets allows for improved resolution of unique astrocyte subpopulations.
(A) tSNE plots of reanalyzed astrocytes from published snRNA-seq AD datasets (Mathys, N = 3,079; Grubman, N = 2,330; Zhou, N = 10,538) and (B) their corresponding average scaled expression heatmap of the top 5 cluster-enriched/unique transcripts. (C) tSNE plots of integrated astrocytes (N = 57,018) as visualized by cluster (left) and by dataset (right). Mathys data are in yellow, Grubman data are in dark red, Zhou data are in violet, and the current study’s data are in steel blue. (D) Proportion of integrated astrocyte clusters identified in the integrated dataset. (E) Average scaled expression heatmap of top 5 integrated astrocyte cluster-enriched/unique transcripts by cluster and by dataset. See also Figures S1, S3, S6–S8, S13.

Similar articles

Cited by

References

    1. Amezquita RA, Lun ATL, Becht E, Carey VJ, Carpp LN, Geistlinger L, Marini F, Rue-Albrecht K, Risso D, Soneson C, et al. (2020). Orchestrating single-cell analysis with Bioconductor. Nat Methods 17, 137–145. 10.1038/s41592-019-0654-x. - DOI - PMC - PubMed
    1. Ando K, Uemura K, Kuzuya A, Maesako M, Asada-Utsugi M, Kubota M, Aoyagi N, Yoshioka K, Okawa K, Inoue H, et al. (2011). N-cadherin regulates p38 MAPK signaling via association with JNK-associated leucine zipper protein: implications for neurodegeneration in Alzheimer disease. J Biol Chem 286, 7619–7628. 10.1074/jbc.M110.158477. - DOI - PMC - PubMed
    1. Argaw AT, Asp L, Zhang J, Navrazhina K, Pham T, Mariani JN, Mahase S, Dutta DJ, Seto J, Kramer EG, et al. (2012). Astrocyte-derived VEGF-A drives blood-brain barrier disruption in CNS inflammatory disease. J Clin Invest 122, 2454–2468. 10.1172/JCI60842. - DOI - PMC - PubMed
    1. Alzheimer’s Association (2021). 2021 Alzheimer’s disease facts and figures. Alzheimers Dement 17, 327–406. 10.1002/alz.12328. - DOI - PubMed
    1. Bankhead P, Loughrey MB, Fernandez JA, Dombrowski Y, McArt DG, Dunne PD, McQuaid S, Gray RT, Murray LJ, Coleman HG, et al. (2017). QuPath: Open source software for digital pathology image analysis. Sci Rep 7, 16878. 10.1038/s41598-017-17204-5. - DOI - PMC - PubMed

Publication types

Substances