. 2022 Apr 14;185(8):1373-1388.e20.
doi: 10.1016/j.cell.2022.03.011. Epub 2022 Apr 4.

LGR5 expressing skin fibroblasts define a major cellular hub perturbed in scleroderma

Affiliations

LGR5 expressing skin fibroblasts define a major cellular hub perturbed in scleroderma

Chamutal Gur et al. Cell. .

Abstract

Systemic sclerosis (scleroderma, SSc) is an incurable autoimmune disease with high morbidity and mortality rates. Here, we conducted a population-scale single-cell genomic analysis of skin and blood samples of 56 healthy controls and 97 SSc patients at different stages of the disease. We found immune compartment dysfunction only in a specific subtype of diffuse SSc patients but global dysregulation of the stromal compartment, particularly in a previously undefined subset of LGR5+-scleroderma-associated fibroblasts (ScAFs). ScAFs are perturbed morphologically and molecularly in SSc patients. Single-cell multiome profiling of stromal cells revealed ScAF-specific markers, pathways, regulatory elements, and transcription factors underlining disease development. Systematic analysis of these molecular features with clinical metadata associates specific ScAF targets with disease pathogenesis and SSc clinical traits. Our high-resolution atlas of the sclerodermatous skin spectrum will enable a paradigm shift in the understanding of SSc disease and facilitate the development of biomarkers and therapeutic strategies.

Keywords: FOS; GVHD; LGR5; TWIST1; autoimmune; fibroblast; fibrosis; skin; systemic sclerosis.


Conflict of interest statement

Declaration of interests The authors declare no competing interests.

Figures
Graphic abstract
Graphic abstract
Figure 1
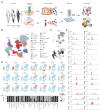
Figure 1. Single-cell atlas of blood and skin immune cells from SSc patients and healthy subjects
(A) Overview of the experimental setting. Skin and blood samples of healthy donors and SSc patients were dissociated into single cells. CD45+ and CD90+ cells were sorted for transcriptional profiling. (B) 2D projection of the subclustered blood and skin immune cells with subpopulations marked by a color code. (C) 2D projection of the single cells by the source of the samples (blood or skin). (D) 2D projection of a selected set of marker genes over the metacell model. (E) Normalized expression of selected genes across the metacell model. Each bar represents one metacell, colored as in (B). (F) Bar plot showing the sample source contribution of individual immune cell populations.
Figure 2
Figure 2. Blood and skin immune cells composition of healthy subjects and SSc patients
(A) 2D density plots showing immune cell population enrichment over the metacell model in blood and skin from healthy donors and SSc patients’ groups (STAR Methods). (Left) Reference map of skin and blood immune populations as in Figure 1B; (Right) down-sampled blood (upper) and skin (lower) immune cells of healthy donors and SSc patients are shown with contour lines indicating the density of projected cells. (B and D) Bar plots showing the blood (B) and skin (D) immune cell-type composition within the healthy donors and the SSc patients in each group (left) or in the individual patients (right). Cell types are colored the same as in (A). (C and E) Dot plots showing percentages of selected blood (C) and skin (E) immune cell populations within the healthy donors and SSc patients’ groups. *p < 0.1, **p < 0.05, ***p < 0.01, Mann-Whitney U test, two-sided. Error bars indicate mean ± SEM.
Figure 3
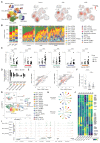
Figure 3. Single-cell atlas of skin stromal cells from SSc patients and healthy subjects
(A) 2D projection of subclustered skin stromal cells with subpopulations marked by a color code. (B) 2D projection of a selected set of marker genes over the metacell model. (C) Normalized expression of selected genes across the metacell model. (D) Heatmap showing the 559 top variable genes within the 228-skin fibroblast metacells which are grouped into 10 identified skin fibroblast subsets (top) by 10 gene modules (left). (E) Heatmap showing selected gene ontology (GO) functional enrichment (FDR adjusted p value <0.001) of the gene modules defined in (D) with the most associated fibroblast subsets colored on the top.
Figure 4
Figure 4. Perturbation of stromal cell-type composition and transcriptional program in SSc patients
(A) 2D projection with density plots showing skin stromal cell population enrichment over the metacell model in the various groups. (Left) Reference map of the skin stromal populations as in Figure 3A; (Right) down-sampled skin stromal cells are shown with contour lines indicating the 2D density of projected cells. (B Bar plots showing the stromal cell-type composition within the healthy donors and SSc patients in each group (left) or in individual patients (right). Cell types are colored the same as in (A). (C) Dot plots showing percentages of selected stromal cell populations within the healthy and SSc patients’ groups. **p < 0.05, ***p < 0.01, Mann-Whitney U test, two-sided. Error bars indicate mean ± SEM. (D) Bar plot showing the numbers of upregulated and downregulated genes for individual fibroblast subsets in the SSc groups compared with the healthy donors. (E) Scatter plots showing gene expression of the ScAFs from the SSc groups (y axis) compared with that from the healthy donors (x axis). Differentially expressed genes (log2 fold change >1.5) are colored in red with selected genes highlighted. (F) Dot plots showing LGR5 gene expression in the ScAFs of each donor or patient in the different groups. ***p < 0.001, Mann-Whitney U test, two-sided. Error bars indicate mean ± SEM. (G) Weighted nearest neighbor analysis (Wnn) Uniform Manifold Approximation and Projection (UMAP) of the CD90+ skin cells from 9 healthy donors and 9 dSSc patients with each subpopulation colored the same as in Figure 3A (STAR Methods). The top left corner shows the sources of individual cells. (H) Clustering dendrogram of cell populations based on ATAC signals (top) and mRNA signals (bottom). (I) Snapshots showing normalized ATAC-seq signals at selected loci for selected fibroblast subsets from the skin of healthy donors and dSSc patients. Dashed boxes highlight ATAC-seq peaks with differential signals. (J) Heatmap showing DNA motifs with differential enrichment in skin stromal cell populations from the dSSc patients compared with those from the healthy donors. Selected associated genes are highlighted on the right.
Figure 5
Figure 5. ScAF cell interactions and their spatial localization in the dermis
(A and B) Selected ligand-receptor (L-R) pairs between the ScAFs and other skin cells in healthy donors and SSc patients. L-R pairs are grouped and colored by functional annotations. (A) L-R interactions in which the ligand (left) expression is perturbed in the ScAFs of SSc patients (red, upregulated; blue, downregulated), with the normalized expression of corresponding receptors in other skin cell types (right). Error bars indicate mean ± SEM. (B) The same as (A) but the receptor expression (left) is perturbed with corresponding ligands on the right. (C) Graphical model of the skin layers and ScAFs. (D) Skin sections from the healthy donors and SSc patients stained with DAPI (4’,6-diamidino-2-phenylindole, blue), anti-hCD55 mAb (green), and smFISH probes for COL1A1 (red) and LGR5 (white) mRNA. Scale bars, 20 μm. Inset scale bars, 10 μm. (E) Boxplot showing quantification of LGR5+ cells in the different dermal layers. *p < 0.1, Mann-Whitney U test, two-sided. (F and G) Boxplot showing quantification of LGR5+ cells (F) and LGR5 signals in the LGR5+ cells (G) in the reticular dermis of the healthy controls (n = 3), lSSc (n = 4), and dSSc (n = 4) patients. *p < 0.1, ***p < 0.01, Mann-Whitney U test, two-sided.
Figure 6
Figure 6. Association of cell-type composition and gene expression with clinical manifestations
(A) Heatmap showing significant associations between cell population fractions and clinical manifestations (STAR Methods). (B) Scatter plot showing selected association pairs in (A) with each circle representing a donor or patient colored by the group. (C) Significant associations between gene expression in the ScAFs and clinical manifestations (STAR Methods). Genes associated with at least one significant clinical manifestation are shown on the left (q value < 0.01; STAR Methods) with their normalized expression in the individual donors or SSc patients on the right. (D) Associations of a selected set of differentially expressed genes in ScAFs with various clinical manifestations.
Figure 7
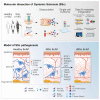
Figure 7. ScAF cells are regulated through a two-step activation mechanism
Schematic illustration showing ScAFs switching from homeostatic to stage 1 ScAFs (ISSc) and stage 2 ScAFs (dSSc). The key genes involved in each stage are shown below each condition. The transcription factors with altered DNA-binding landscapes involved in the transition to pathological ScAFs are shown below the key genes. Arrows indicate up (red) or down (green) regulation of the gene/transcription factor (TF) in the specific stage.

References

    1. Allanore Y, Simms R, Distler O, Trojanowska M, Pope J, Denton CP, Varga J. Systemic sclerosis. Nat Rev Dis Primers. 2015;1:15002. doi: 10.1038/nrdp.2015.2. - DOI - PubMed
    1. Ascensión AM, Fuertes-Alvarez S, Ibanez-Sole O, Izeta A, Araijzo-Bravo MJ. Human dermal fibroblast subpopulations are conserved across single-cell RNA sequencing studies. J Invest Dermatol. 2021;141:1735–1744.:e35. doi: 10.1016/j.jid.2020.11.028. - DOI - PubMed
    1. Baran Y, Bercovich A, Sebe-Pedros A, Lubling Y, Giladi A, Chomsky E, Meir Z, Hoichman M, Lifshitz A, Tanay A. MetaCell: analysis of single-cell RNA-seq data using K-nn graph partitions. Genome Biol. 2019;20:206. doi: 10.1186/s13059-019-1812-2. - DOI - PMC - PubMed
    1. Barker N, van Es JH, Kuipers J, Kujala P, van den Born M, Cozijnsen M, Haegebarth A, Korving J, Begthel H, Peters PJ, Clevers H. Identification of stem cells in small intestine and colon by marker gene Lgr5. Nature. 2007;449:1003–1007. doi: 10.1038/nature06196. - DOI - PubMed
    1. Benyamine A, Magalon J, Sabatier F, Lyonnet L, Robert S, Dumoulin C, Morange S, Mazodier K, Kaplanski G, Reynaud-Gaubert M, et al. Natural killer cells exhibit a peculiar phenotypic profile in systemic sclerosis and are potent inducers of endothelial microparticles release. Front Immunol. 2018;9:1665. doi: 10.3389/FIMMU.2018.01665. - DOI - PMC - PubMed

Publication types

Substances