

Sensor-based categorization of upper limb performance in daily life of persons with and without neurological upper limb deficits
- PMID: 35382114
- PMCID: PMC8979497
- DOI: 10.3389/fresc.2021.741393
Sensor-based categorization of upper limb performance in daily life of persons with and without neurological upper limb deficits
Abstract
Background: The use of wearable sensor technology (e.g., accelerometers) for tracking human physical activity have allowed for measurement of actual activity performance of the upper limb (UL) in daily life. Data extracted from accelerometers can be used to quantify multiple variables measuring different aspects of UL performance in one or both limbs. A limitation is that several variables are needed to understand the complexity of UL performance in daily life.
Purpose: To identify categories of UL performance in daily life in adults with and without neurological UL deficits.
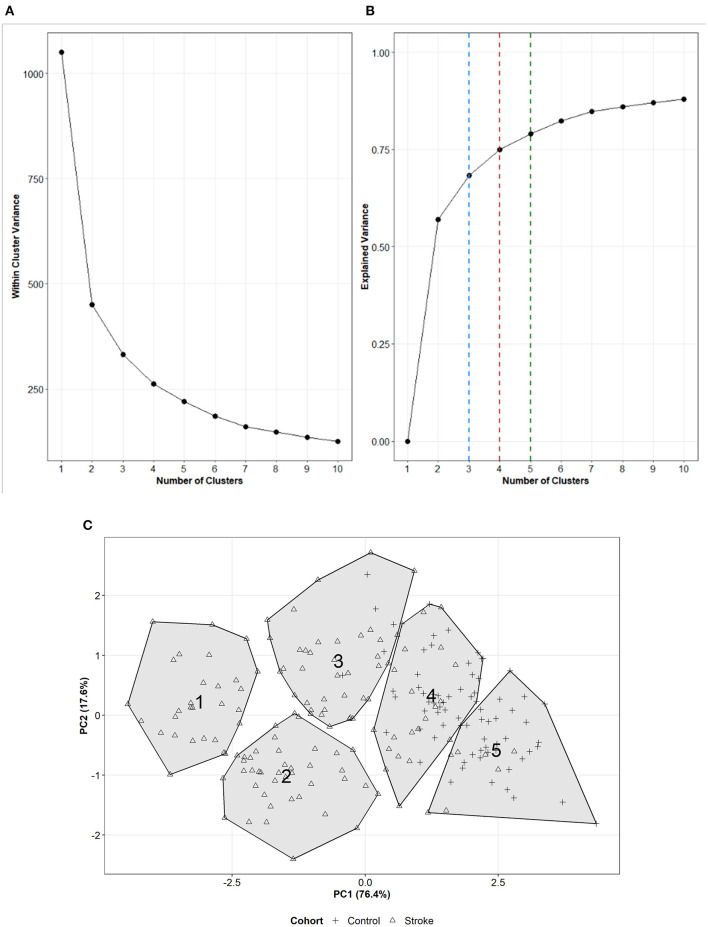
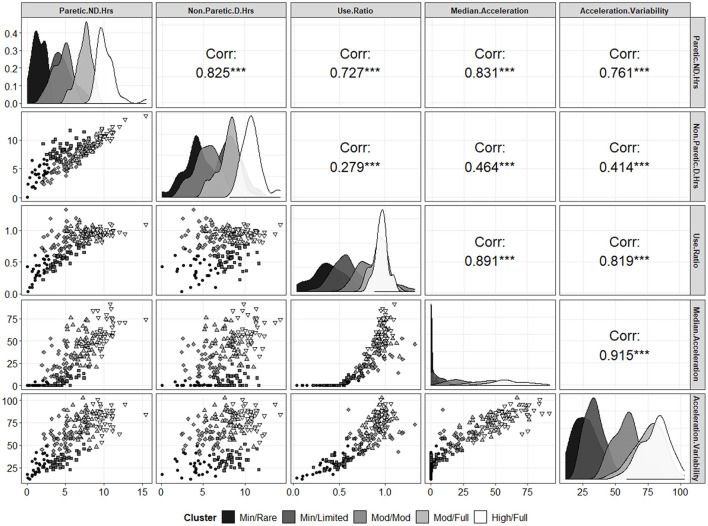
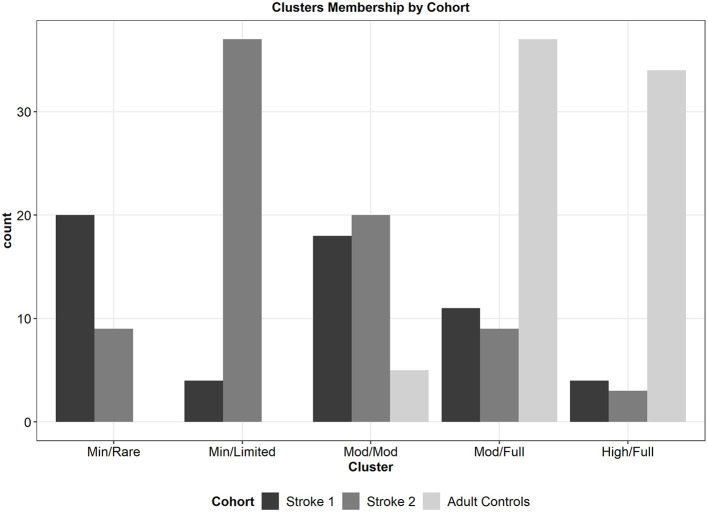
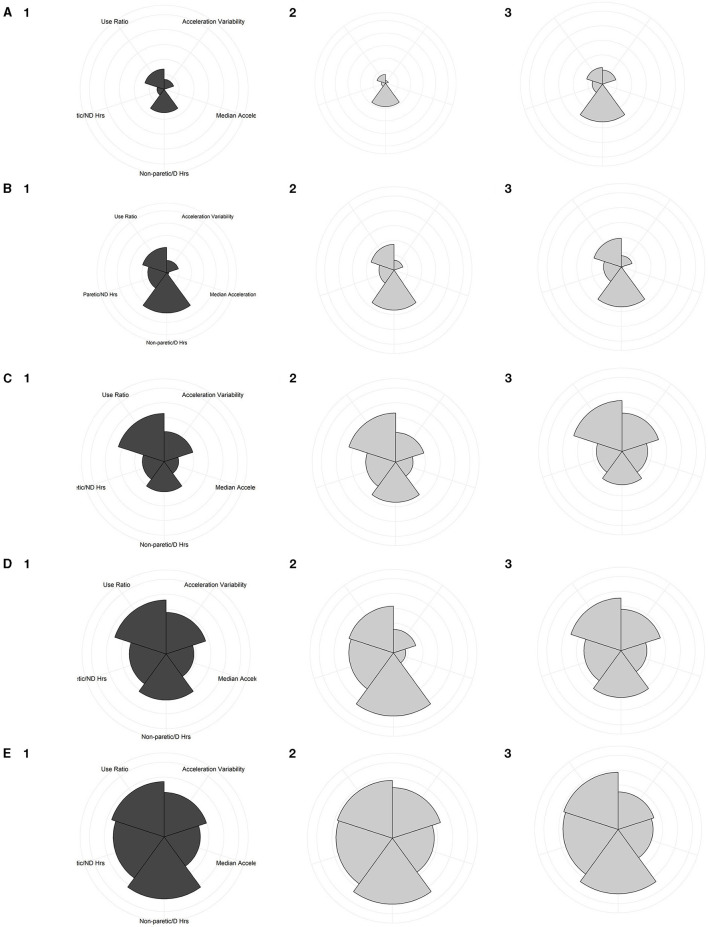
Methods: This study analyzed data extracted from bimanual, wrist-worn triaxial accelerometers from adults from three previous cohorts (N=211), two samples of persons with stroke and one sample from neurologically intact adult controls. Data used in these analyses were UL performance variables calculated from accelerometer data, associated clinical measures, and participant characteristics. A total of twelve cluster solutions (3-, 4- or 5-clusters based with 12, 9, 7, or 5 input variables) were calculated to systematically evaluate the most parsimonious solution. Quality metrics and principal component analysis of each solution were calculated to arrive at a locally-optimal solution with respect to number of input variables and number of clusters.
Results: Across different numbers of input variables, two principal components consistently explained the most variance. Across the models with differing numbers of UL input performance variables, a 5-cluster solution explained the most overall total variance (79%) and had the best model-fit.
Conclusion: The present study identified 5 categories of UL performance formed from 5 UL performance variables in cohorts with and without neurological UL deficits. Further validation of both the number of UL performance variables and categories will be required on a larger, more heterogeneous sample. Following validation, these categories may be used as outcomes in UL stroke research and implemented into rehabilitation clinical practice.
Keywords: Accelerometry; Cluster Analysis; Outcome Assessment; Rehabilitation; Stroke; Upper Exremity.
Conflict of interest statement
The authors declare that the research was conducted in the absence of any commercial or financial relationships that could be construed as a potential conflict of interest.
Figures
Similar articles
-
Replication of Sensor-Based Categorization of Upper-Limb Performance in Daily Life in People Post Stroke and Generalizability to Other Populations.Sensors (Basel). 2025 Jul 25;25(15):4618. doi: 10.3390/s25154618. Sensors (Basel). 2025. PMID: 40807780 Free PMC article.
-
Predicting later categories of upper limb activity from earlier clinical assessments following stroke: an exploratory analysis.J Neuroeng Rehabil. 2023 Feb 21;20(1):24. doi: 10.1186/s12984-023-01148-1. J Neuroeng Rehabil. 2023. PMID: 36810072 Free PMC article.
-
Comparison of Self-Report Versus Sensor-Based Methods for Measuring the Amount of Upper Limb Activity Outside the Clinic.Arch Phys Med Rehabil. 2018 Sep;99(9):1913-1916. doi: 10.1016/j.apmr.2017.12.025. Epub 2018 Mar 10. Arch Phys Med Rehabil. 2018. PMID: 29408483 Free PMC article.
-
Suitability of accelerometry as an objective measure for upper extremity use in stroke patients.BMC Neurol. 2022 Jun 15;22(1):220. doi: 10.1186/s12883-022-02743-w. BMC Neurol. 2022. PMID: 35705906 Free PMC article.
-
The association between upper limb function and variables at the different domains of the international classification of functioning, disability and health in women after breast cancer surgery: a systematic review.Disabil Rehabil. 2022 Apr;44(8):1176-1189. doi: 10.1080/09638288.2020.1800835. Epub 2020 Aug 8. Disabil Rehabil. 2022. PMID: 32772650
Cited by
-
Trends and Innovations in Wearable Technology for Motor Rehabilitation, Prediction, and Monitoring: A Comprehensive Review.Sensors (Basel). 2024 Dec 13;24(24):7973. doi: 10.3390/s24247973. Sensors (Basel). 2024. PMID: 39771710 Free PMC article. Review.
-
Quantifying the effects of sleep on sensor-derived variables from upper limb accelerometry in people with and without upper limb impairment.J Neuroeng Rehabil. 2024 May 28;21(1):86. doi: 10.1186/s12984-024-01384-z. J Neuroeng Rehabil. 2024. PMID: 38807245 Free PMC article.
-
High-Dose, High-Intensity Stroke Rehabilitation: Why Aren't We Giving It?Stroke. 2025 May;56(5):1351-1364. doi: 10.1161/STROKEAHA.124.043650. Epub 2025 Apr 28. Stroke. 2025. PMID: 40294175
-
The Feasibility and User Experience of a Program of Progressive Cued Activity to Promote Functional Upper Limb Activity in the Inpatient Rehabilitation Setting with Follow-Up at Home.Appl Sci (Basel). 2025 Mar 2;15(6):3010. doi: 10.3390/app15063010. Epub 2025 Mar 11. Appl Sci (Basel). 2025. PMID: 40727538 Free PMC article.
-
Referent data for investigations of upper limb accelerometry: harmonized data from three cohorts of typically-developing children.Front Pediatr. 2024 Mar 1;12:1361757. doi: 10.3389/fped.2024.1361757. eCollection 2024. Front Pediatr. 2024. PMID: 38496366 Free PMC article.
References
-
- Uswatte G, Taub E. Participant-centered and objective measures of real-world arm function in persons with stroke. Circulation. (2004) 109:E243.
Grants and funding
LinkOut - more resources
Full Text Sources