

The European Union Summary Report on Antimicrobial Resistance in zoonotic and indicator bacteria from humans, animals and food in 2019-2020
- PMID: 35382452
- PMCID: PMC8961508
- DOI: 10.2903/j.efsa.2022.7209
The European Union Summary Report on Antimicrobial Resistance in zoonotic and indicator bacteria from humans, animals and food in 2019-2020
Abstract
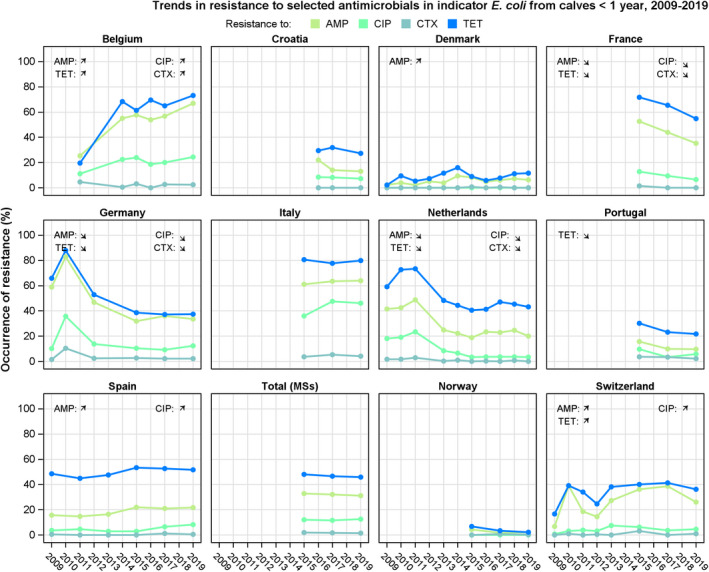
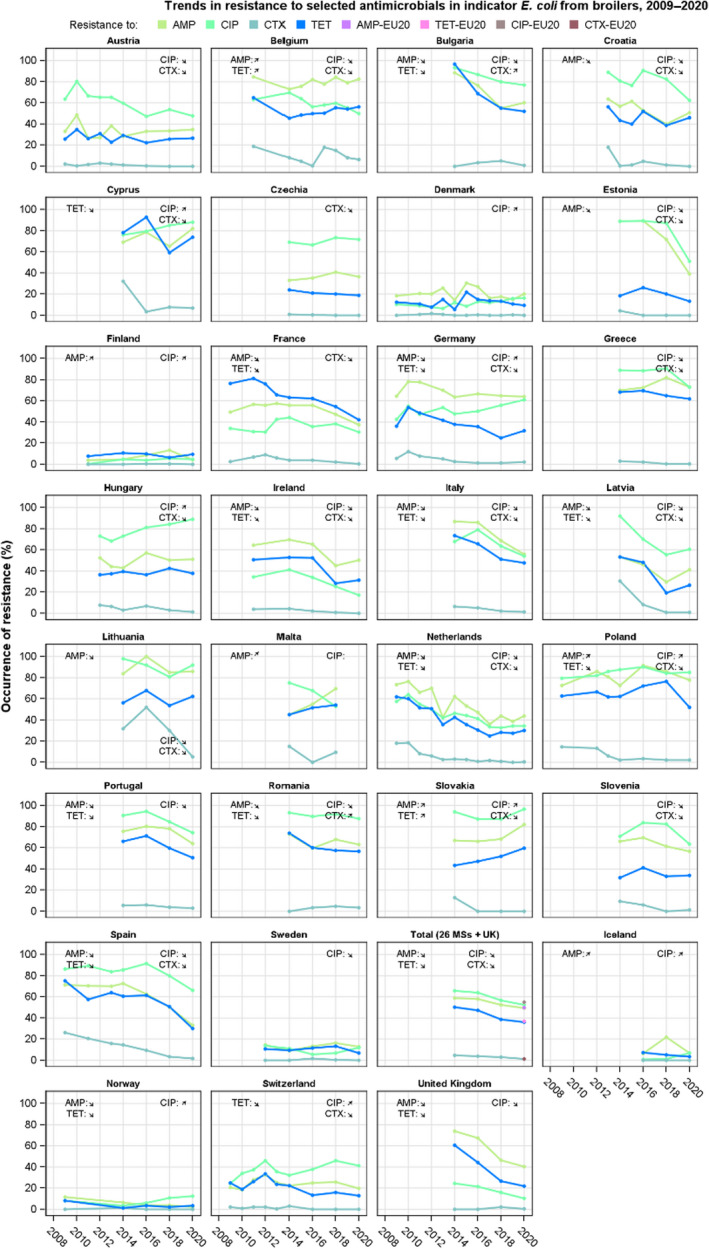
Data on antimicrobial resistance (AMR) in zoonotic and indicator bacteria from humans, animals and food are collected annually by the EU Member States (MSs), jointly analysed by the EFSA and the ECDC and reported in a yearly EU Summary Report. The annual monitoring of AMR in animals and food within the EU is targeted at selected animal species corresponding to the reporting year. The 2020 monitoring specifically focussed on poultry and their derived carcases/meat, while the monitoring performed in 2019 specifically focused on fattening pigs and calves under 1 year of age, as well as their derived carcases/meat. Monitoring and reporting of AMR in 2019-2020 included data regarding Salmonella, Campylobacter and indicator E. coli isolates, as well as data obtained from the specific monitoring of presumptive ESBL-/AmpC-/carbapenemase-producing E. coli isolates. Additionally, some MSs reported voluntary data on the occurrence of methicillin-resistant Staphylococcus aureus in animals and food, with some countries also providing data on antimicrobial susceptibility. This report provides an overview of the main findings of the 2019-2020 harmonised AMR monitoring in the main food-producing animal populations monitored, in carcase/meat samples and in humans. Where available, monitoring data obtained from pigs, calves, broilers, laying hens and turkeys, as well as from carcase/meat samples and humans were combined and compared at the EU level, with particular emphasis on multidrug resistance, complete susceptibility and combined resistance patterns to critically important antimicrobials, as well as Salmonella and E. coli isolates possessing ESBL-/AmpC-/carbapenemase phenotypes. The key outcome indicators for AMR in food-producing animals, such as complete susceptibility to the harmonised panel of antimicrobials in E. coli and the prevalence of ESBL-/AmpC-producing E. coli have been specifically analysed over the period 2014-2020.
Keywords: ESBL; MRSA; antimicrobial resistance; indicator bacteria; zoonotic bacteria.
© 2022 Wiley‐VCH Verlag GmbH & Co. KgaA on behalf of the European Food Safety Authority.
Figures
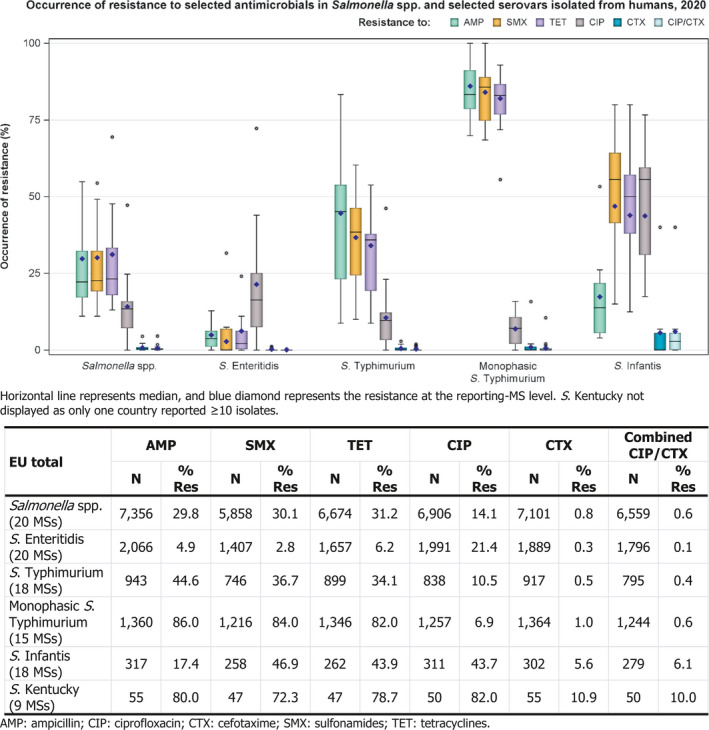
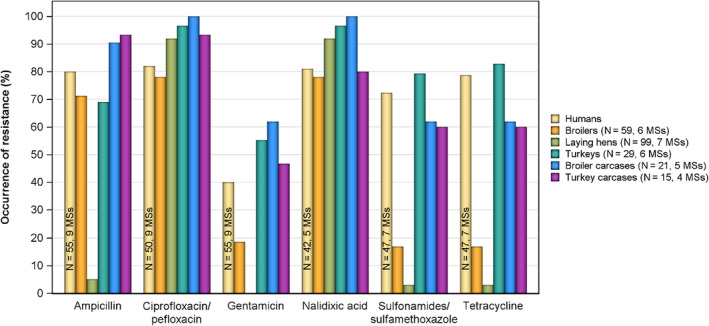
The MDR analysis of human isolates included the following antimicrobials: ampicillin, cefotaxime/ceftazidime, chloramphenicol, ciprofloxacin/pefloxacin/nalidixic acid, gentamicin, meropenem, sulfonamides/sulfamethoxazole, tetracyclines and trimethoprim/trimethoprim‐sulfamethoxazole (co‐trimoxazole).
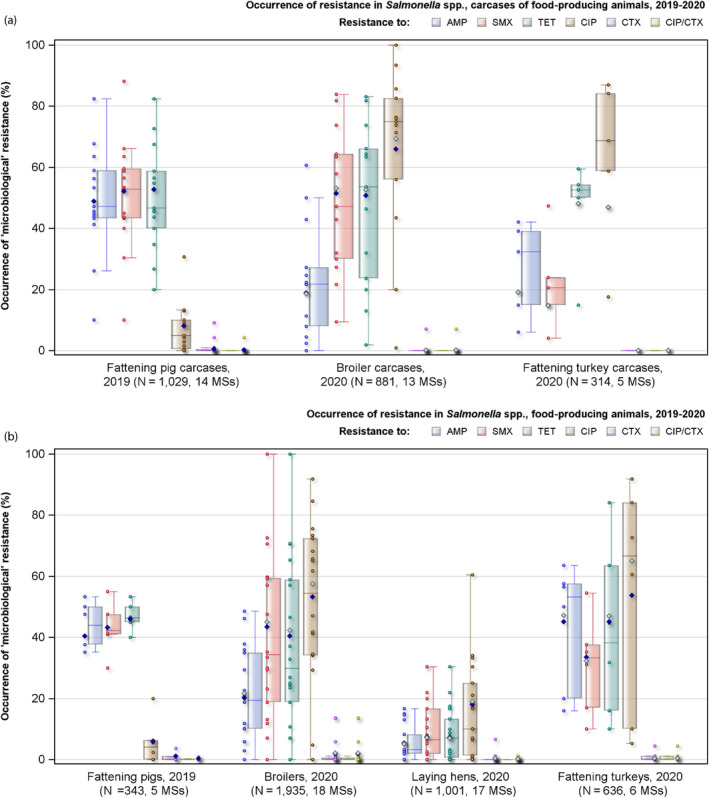
AMP: ampicillin; SMX: sulfamethoxazole; TET: tetracycline; CIP: ciprofloxacin; CTX: cefotaxime; CIP/CTX: combined ‘microbiological’ resistance to ciprofloxacin and cefotaxime; N: total number of Salmonella spp. reported by MSs; blue diamond shows resistance at the reporting‐MS group level. Note: Only MSs reporting data for 10 or more isolates are shown in the graph; however, all isolates are included in the calculation of resistance at the reporting MS group level. As only two MSs reported data on 10 or more Salmonella isolates recovered from calves or their derived carcases, resistance levels for these origins are not presented in Figure 4a,b.
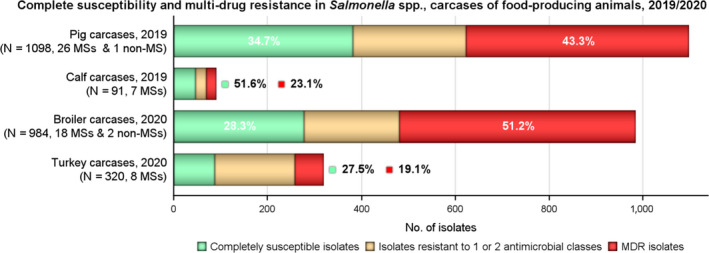
The MDR analysis of carcase isolates included the following antimicrobials: ampicillin, cefotaxime/ceftazidime, chloramphenicol, ciprofloxacin/nalidixic acid, gentamicin, meropenem, sulfamethoxazole, tetracycline, tigecycline and trimethoprim.
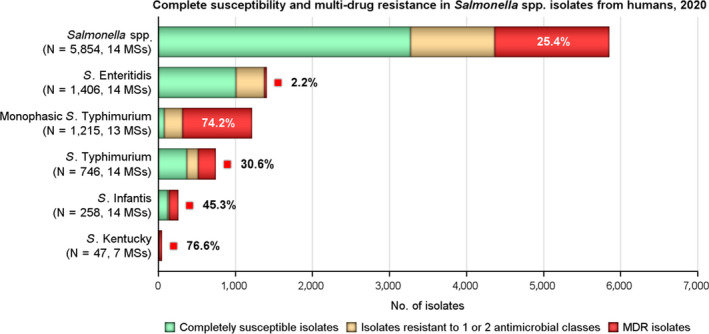
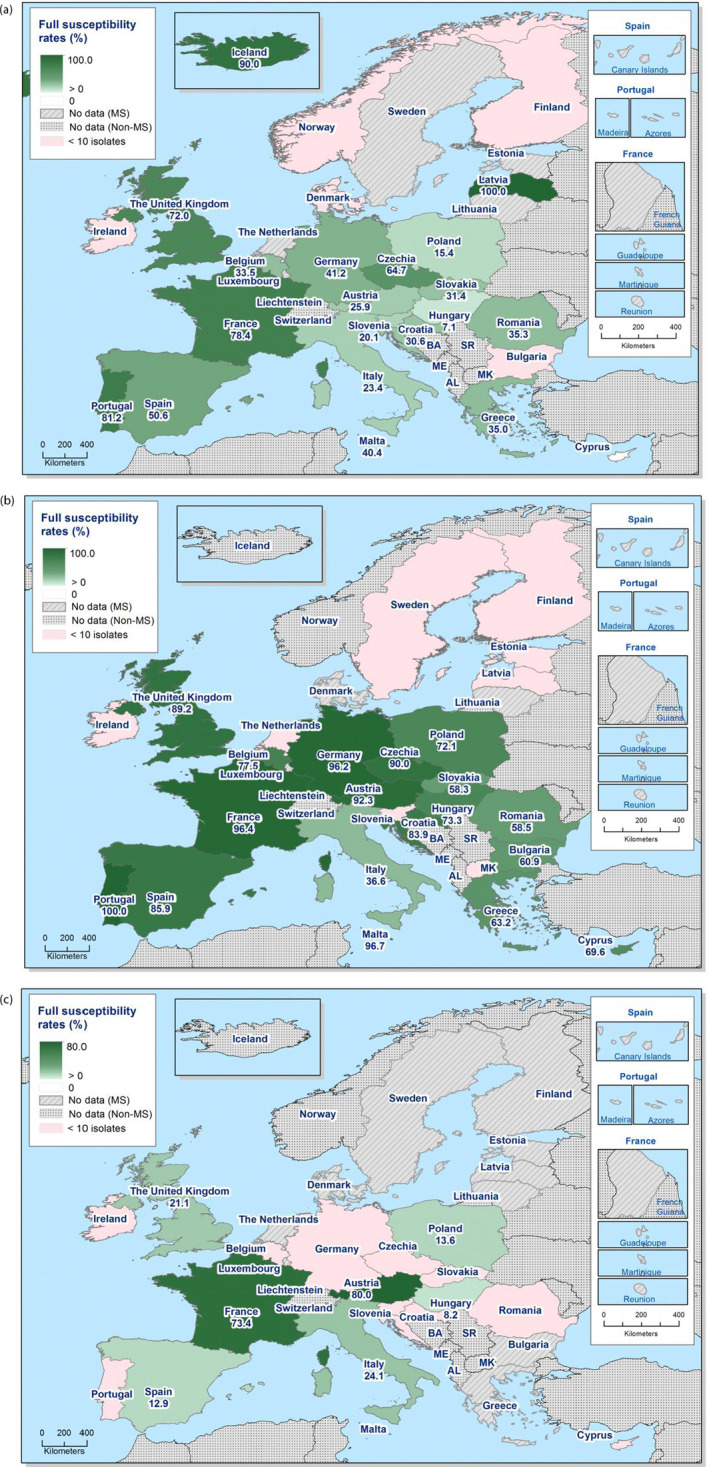
MDR and complete susceptibility levels are also expressed as a percentage; N: total number of Salmonella spp. reported by MSs and non‐MSs.
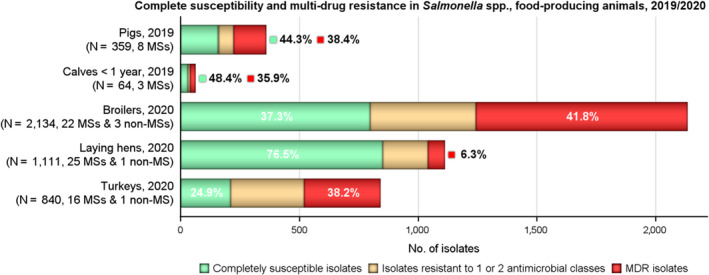
The MDR analysis of animal isolates included the following antimicrobials: ampicillin, cefotaxime/ceftazidime, chloramphenicol, ciprofloxacin/nalidixic acid, gentamicin, meropenem, sulfamethoxazole, tetracycline, tigecycline and trimethoprim.
MDR and complete susceptibility are expressed as percentages; N: total number of Salmonella spp. reported by MSs and non‐MSs.
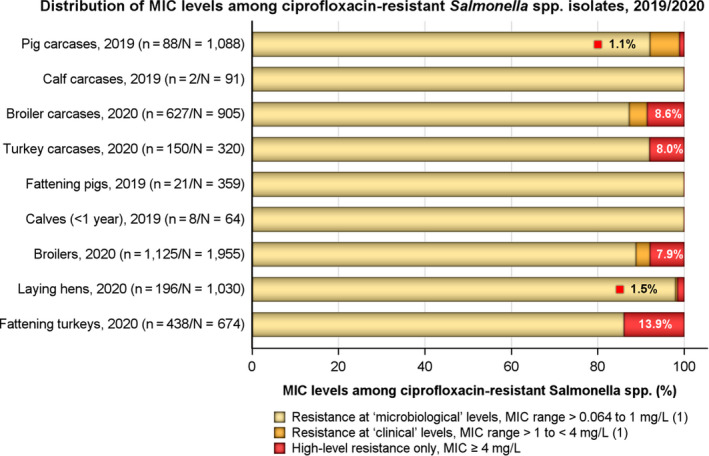
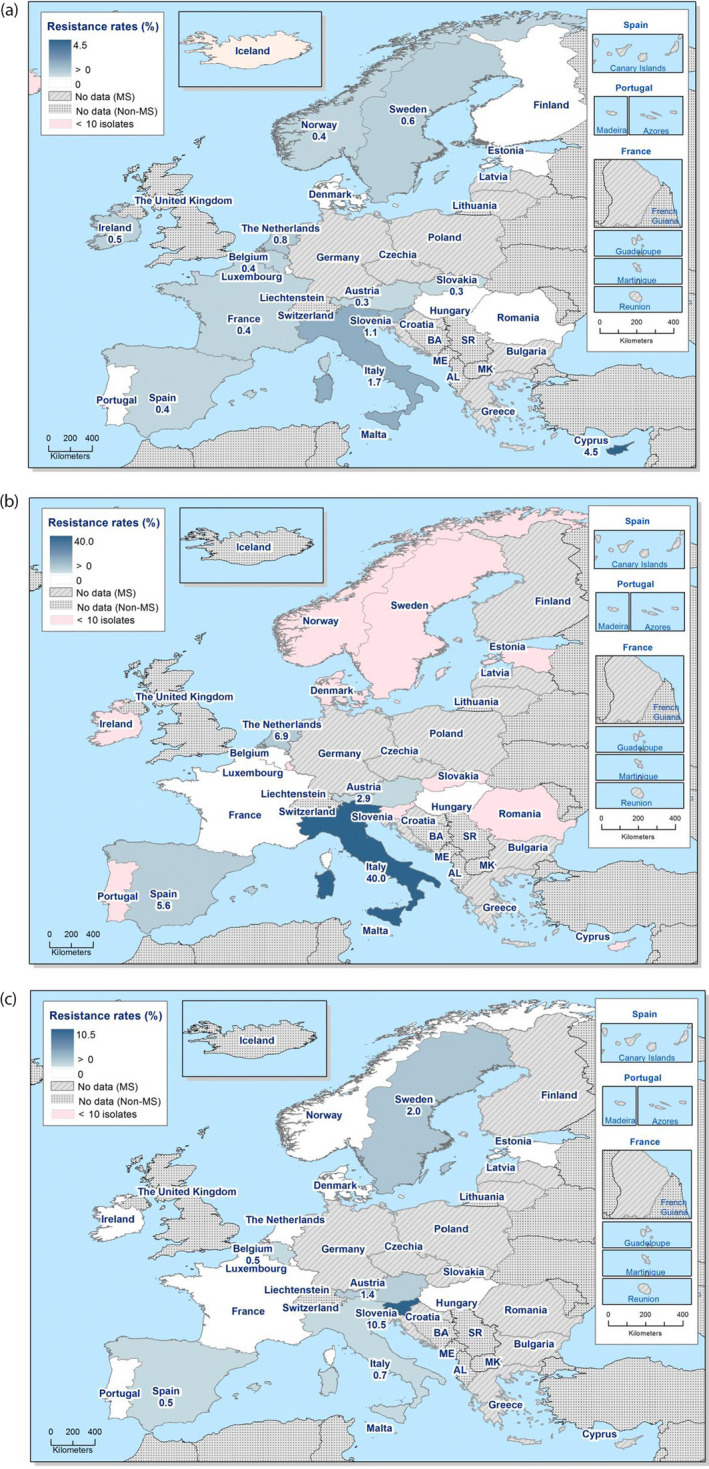
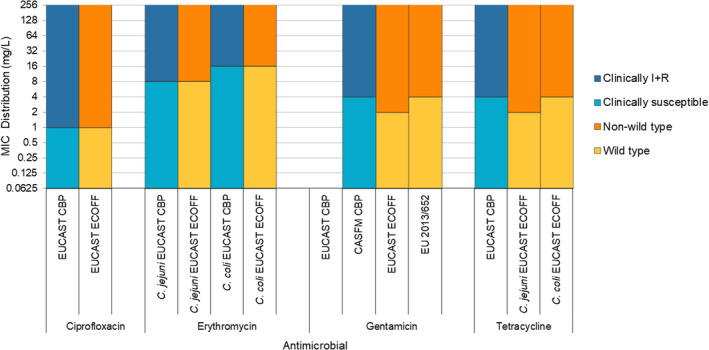
n: Total number of Salmonella spp. exhibiting CIP resistance (MSs only); N: total number of Salmonella spp. reported by MSs.
(1): In accordance with breakpoints stated in Decision 2013/652/EU.
The proportion of isolates showing high‐level resistance is not included with those exhibiting ‘clinical’ or ‘microbiological’ resistance; similarly, the proportion of isolates showing ‘clinical’ resistance is not included with those displaying ‘microbiological’ resistance. Figure 10 excludes one isolate reported from laying hens (by the Republic of North Macedonia), which was ‘microbiologically’ resistant to ciprofloxacin; as well as one isolate reported from pigs (by Switzerland), which showed ‘clinical’ resistance to ciprofloxacin.
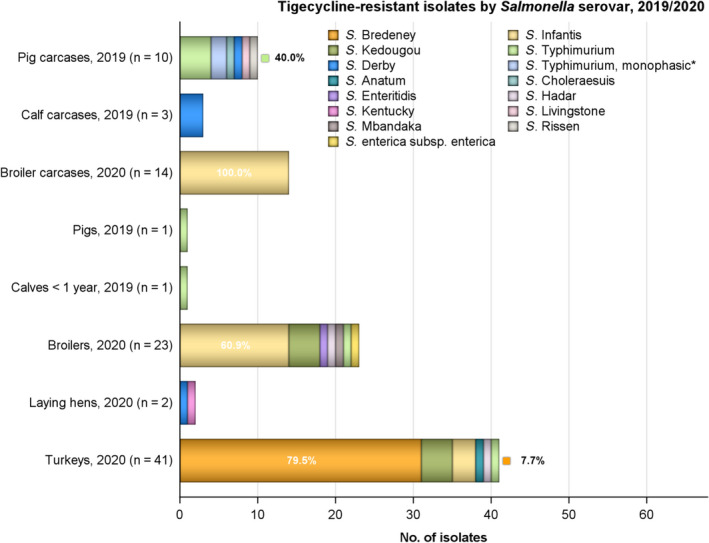
n: Total number of tigecycline‐resistant isolates reported by the MSs; predominant serovars are also expressed as a percentage;
*: monophasic S. Typhimurium includes antigenic formulas;
†: serovar unspecified;
Salmonellas in the legend are listed according to their predominance within all the animal/carcase origins.
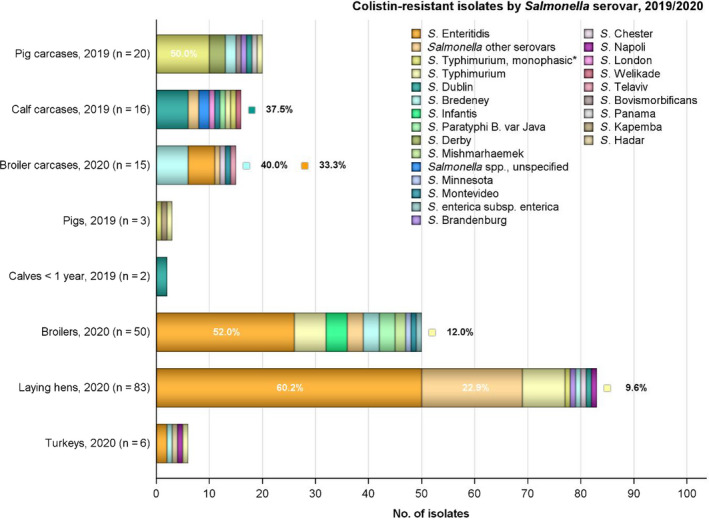
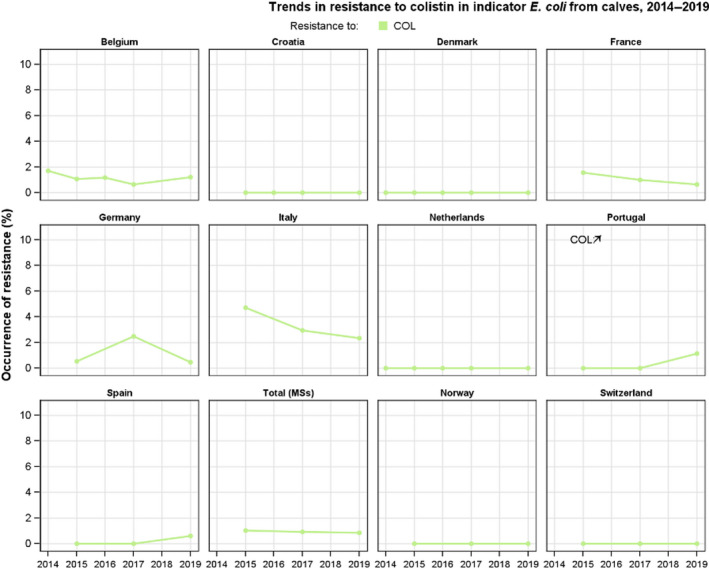
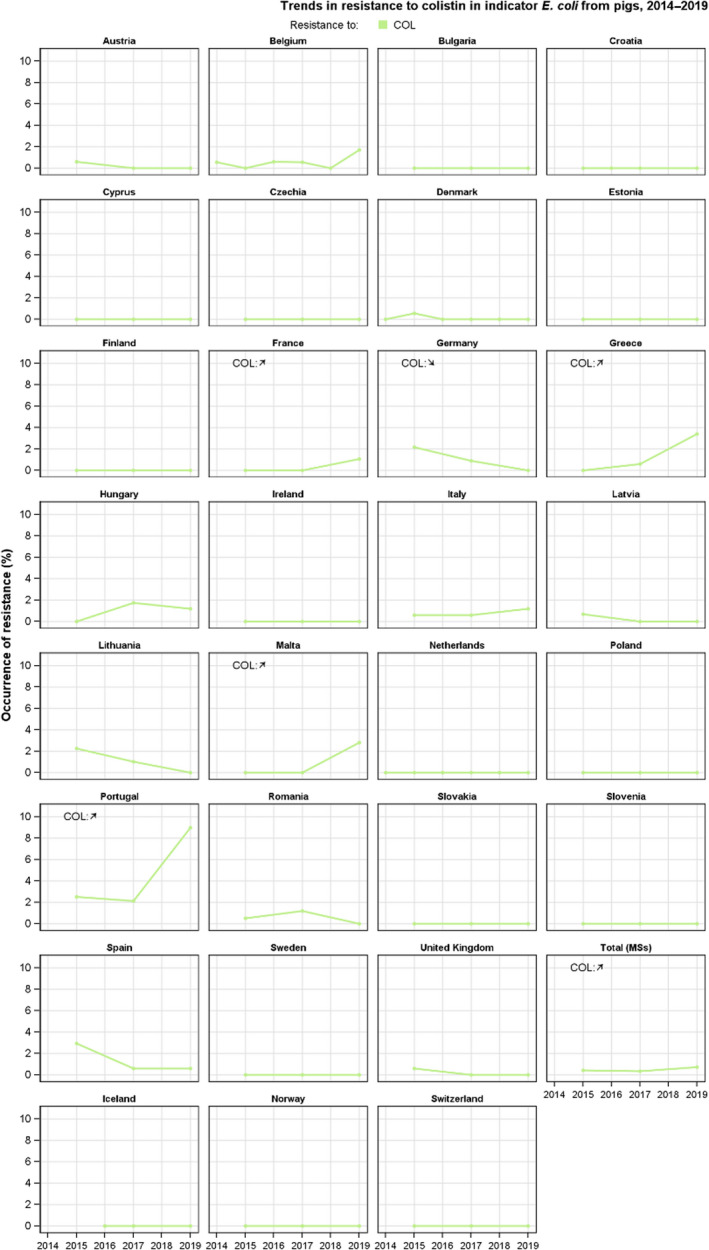
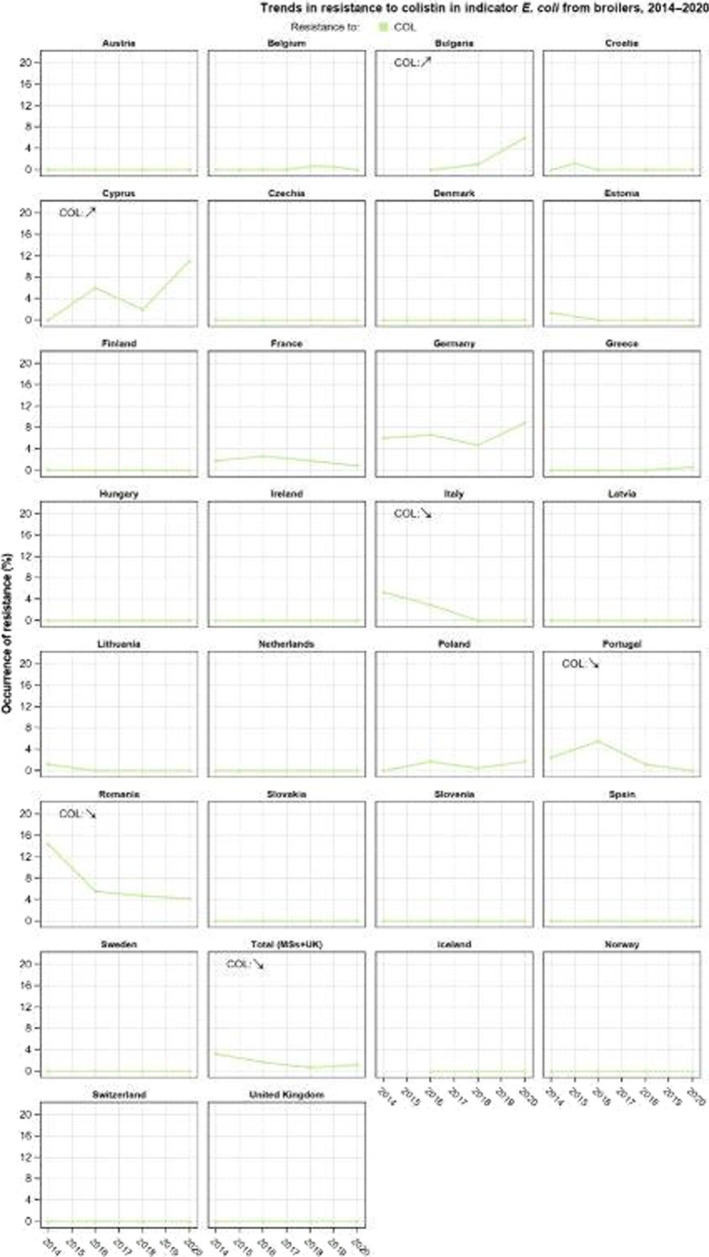
n: Total number of colistin‐resistant isolates reported by the MSs; predominant serovars are expressed as a percentage;
*: Monophasic S. Typhimurium includes antigenic formulas.
†: Serovar unspecified; salmonellas in the legend are listed according to their predominance within all the animal/carcase origins.
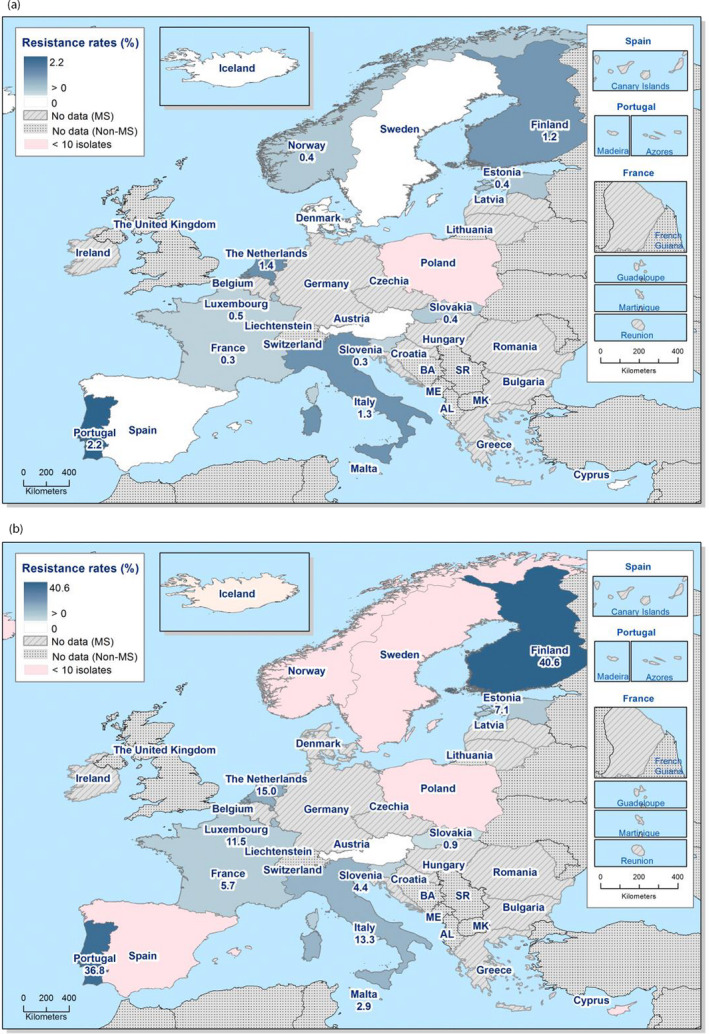
Note: For Finland, travel information was missing from the AMR data while from the case surveillance data, travel‐associated cases were known to account for 49% of Finnish Campylobacter infections in 2020.
N: Total number of isolates reported.
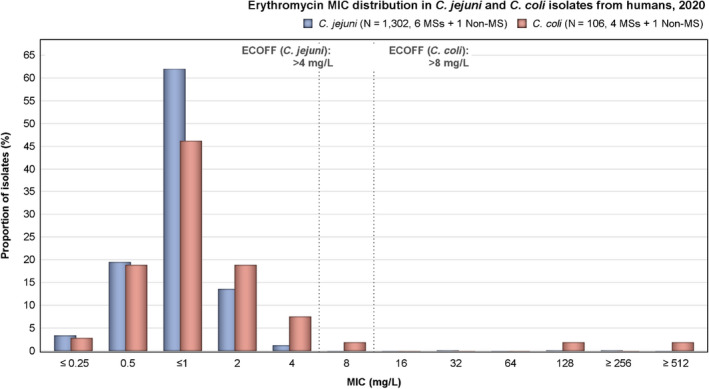
Note: Not visible in the graph due to a very small proportion are three isolates of C. jejuni at MIC 32, 128 and ≥ 256 mg/L.
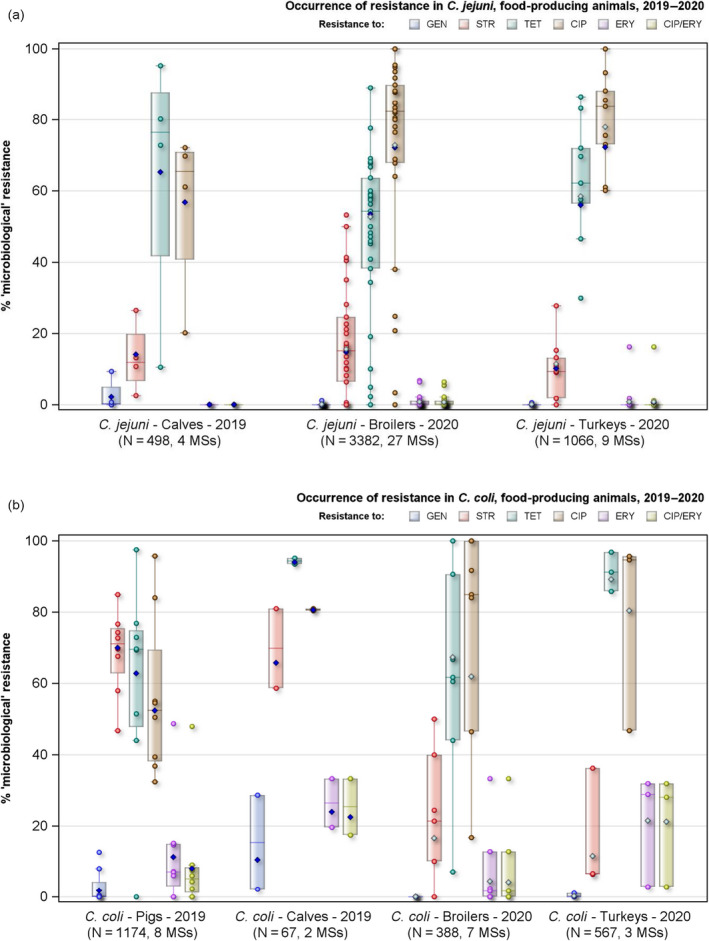
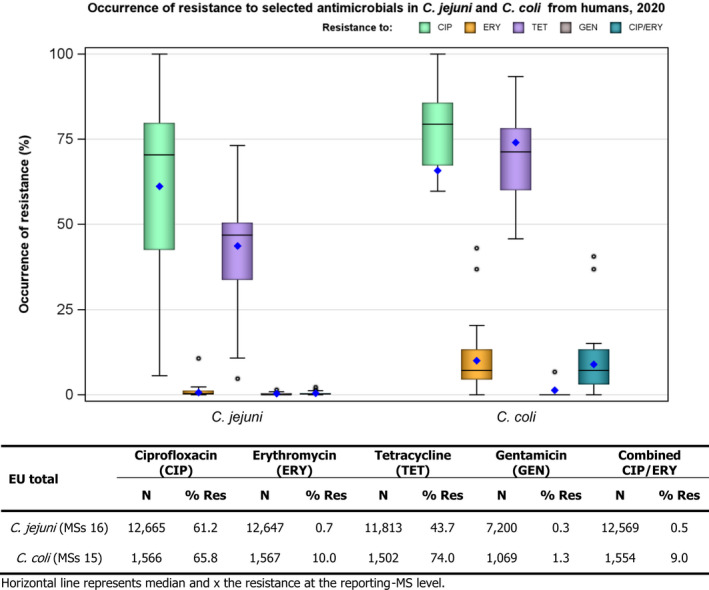
GEN: gentamicin; STR: streptomycin; TET: tetracycline; CIP: ciprofloxacin; ERY: erythromycin; CIP/ERY: combined ‘microbiological’ resistance to ciprofloxacin and erythromycin; N: Total number of isolates reported by all Member States (MSs); Horizontal line represents median; Blue diamond: resistance at reporting MS group level (including UK); Green diamond: resistance at reporting MS group level (excluding UK, 2020).
N: Total number of isolates reported by the EU MSs.
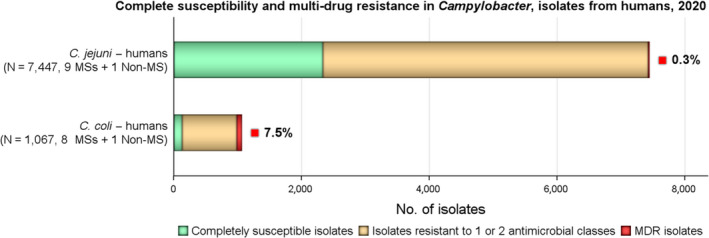
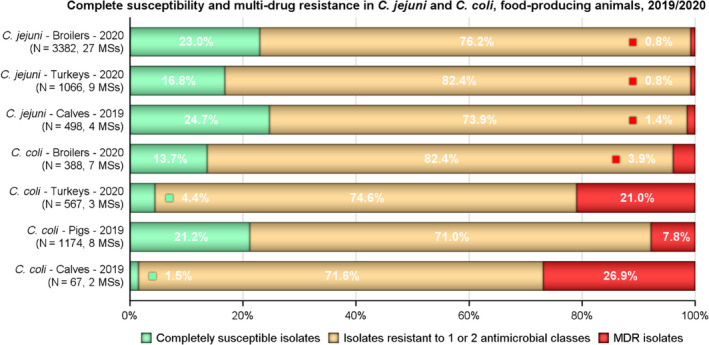
Complete susceptibility is defined as susceptibility to ciprofloxacin/nalidixic acid, erythromycin, gentamicin and tetracycline. MDR is defined as resistance to at least three antimicrobial classes (panel of antimicrobial tested: ciprofloxacin, nalidixic acid, erythromycin, gentamicin, tetracycline).
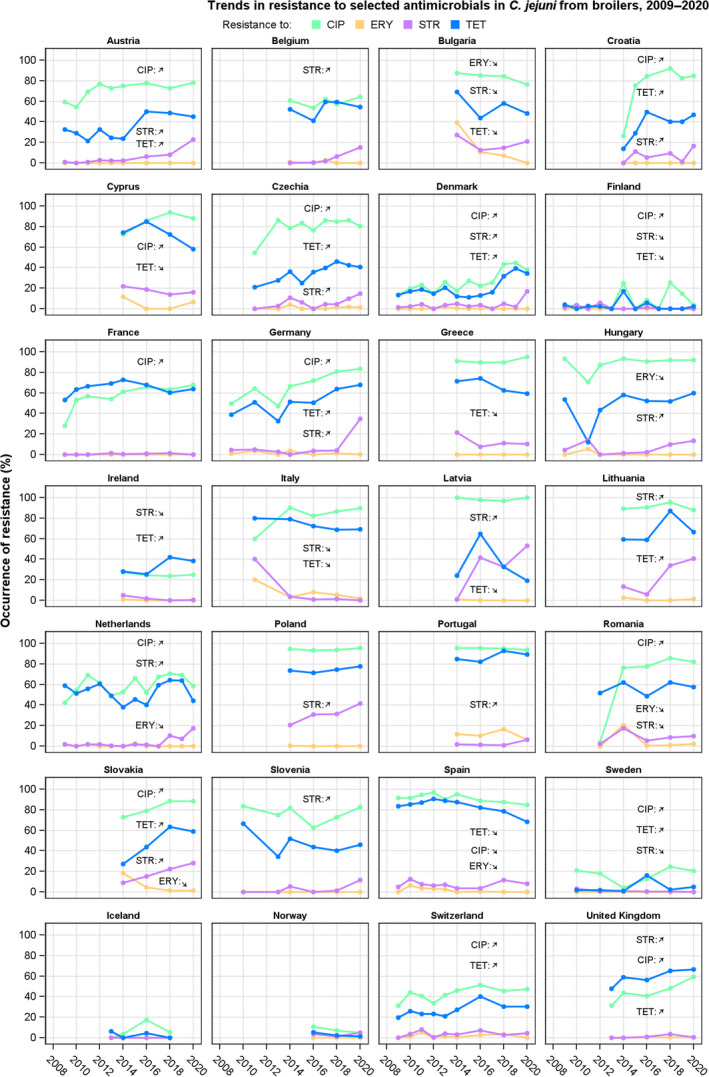
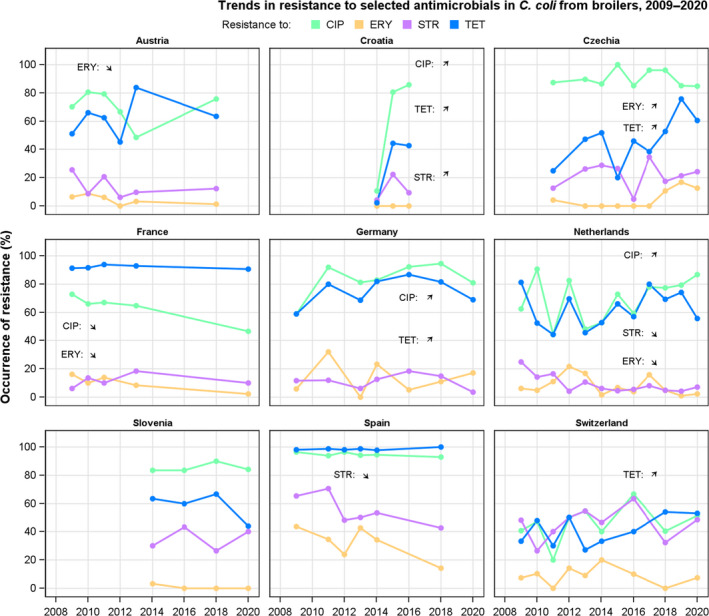
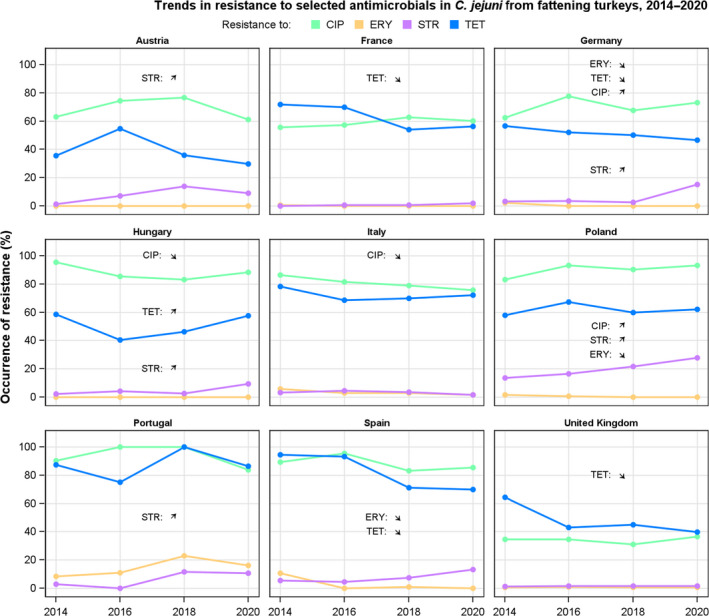
CIP: ciprofloxacin; ERY: erythromycin; STR: streptomycin; TET: tetracycline. Arrows indicate significant increasing (up) or decreasing (down) significant trend over the entire period. Please note that between‐year fluctuation in the occurrence resistance (%) may not be captured in the overall evaluation of the trend for the entire period (2009–2020).
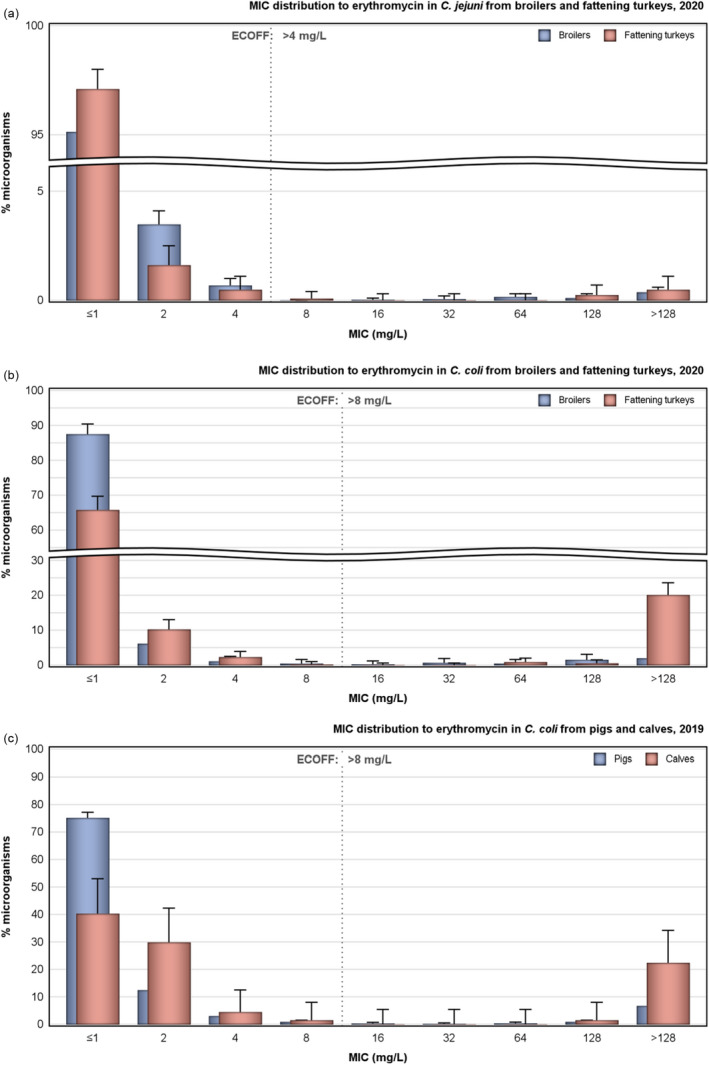
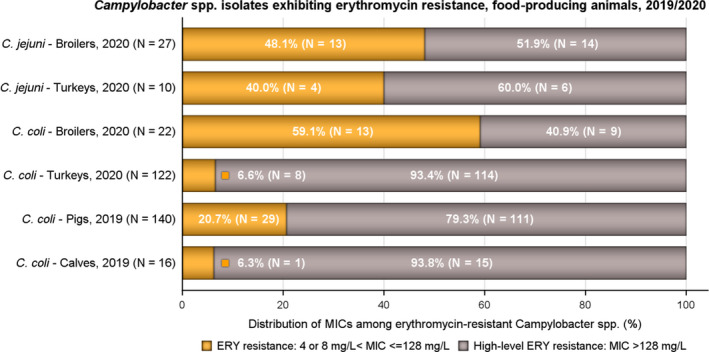
N: Total number of C. jejuni or C. coli isolates exhibiting erythromycin resistance. ERY: erythromycin.
ERY resistance in C. jejuni isolates: 4 mg/L < MIC < 128 mg/L. ERY resistance in C. coli isolates: 8 mg/L < MIC < 128 mg/L.
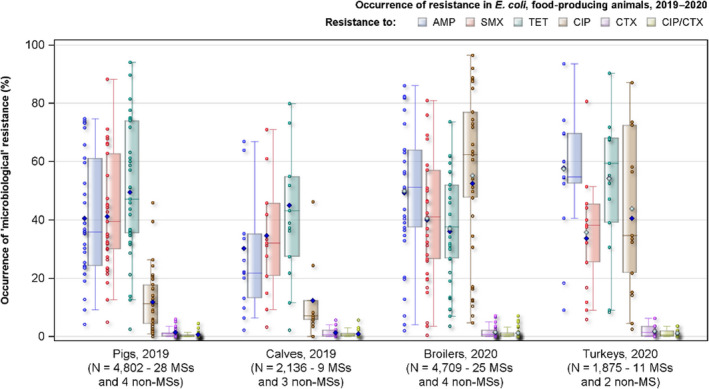
N: Total number of isolates reported by Member States (MSs) and non‐Member States (non‐MSs); AMP: ampicillin, SMX sulfamethoxazole, TET: tetracycline, CIP: ciprofloxacin, CTX: cefotaxime, CIP/CTX: combined ‘microbiological’ resistance to ciprofloxacin and cefotaxime; blue diamond: EU level of resistance; horizontal line in the box plot: the median
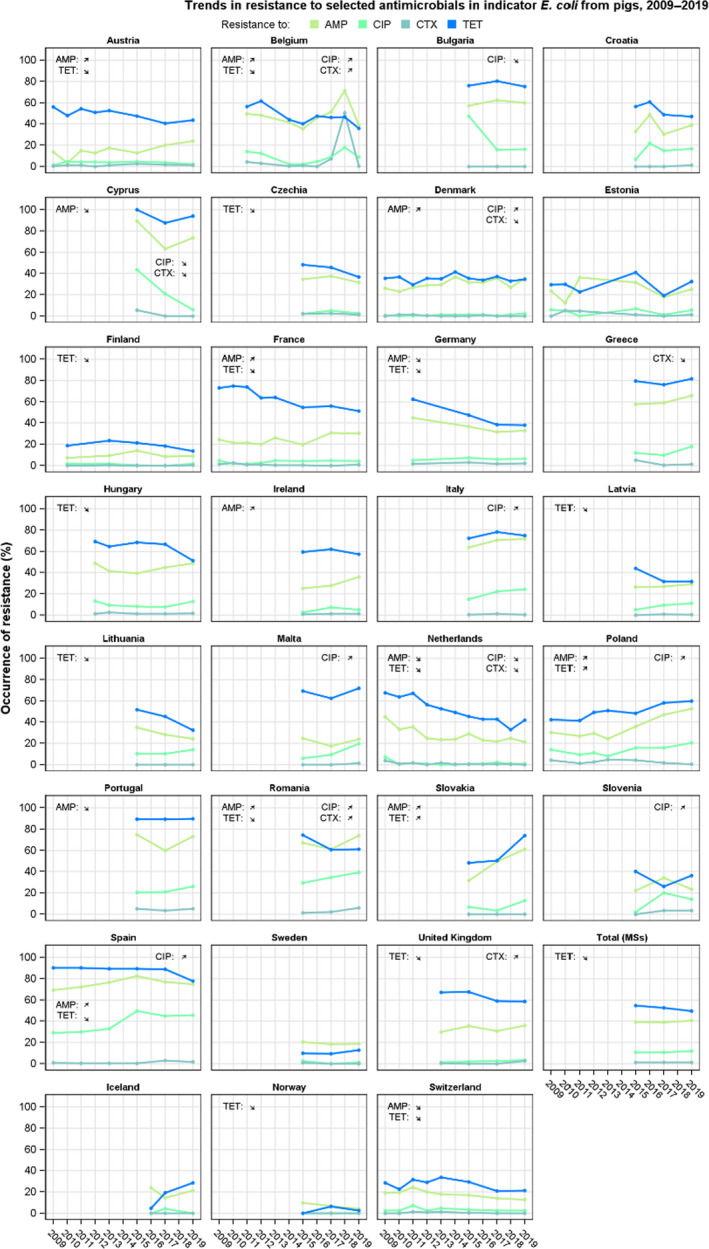
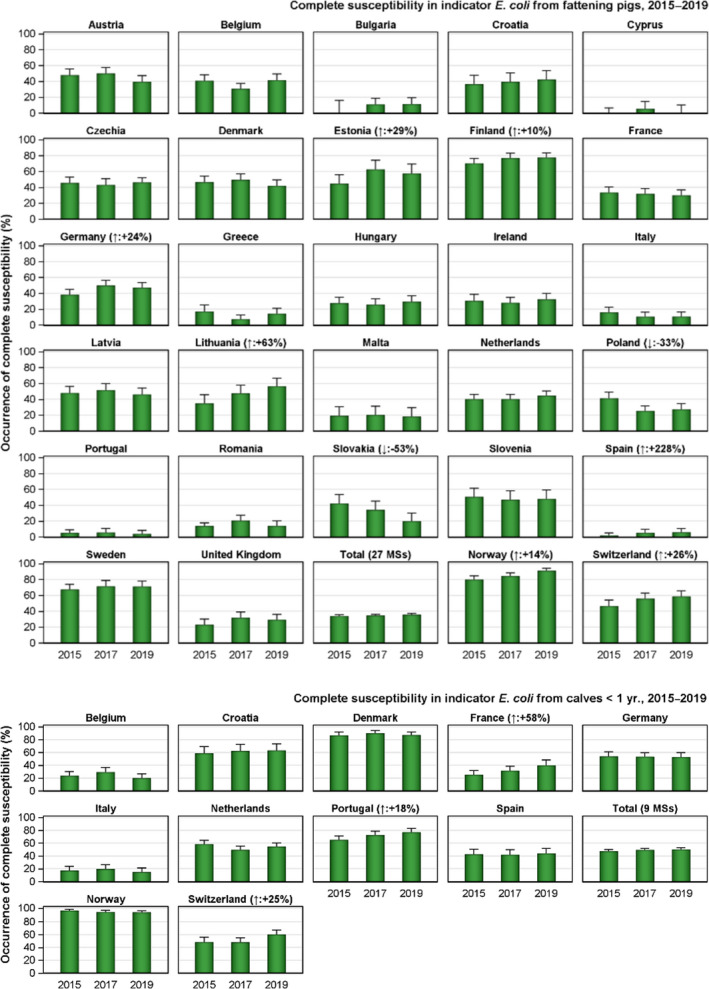
(↓)(↑): indicates statistically significant trends over the period 2015–2019.
(↓)(↑): indicates statistically significant trends over the period 2014–2019
(↓)(↑): indicates statistically significant trends over the period 2014–2019.
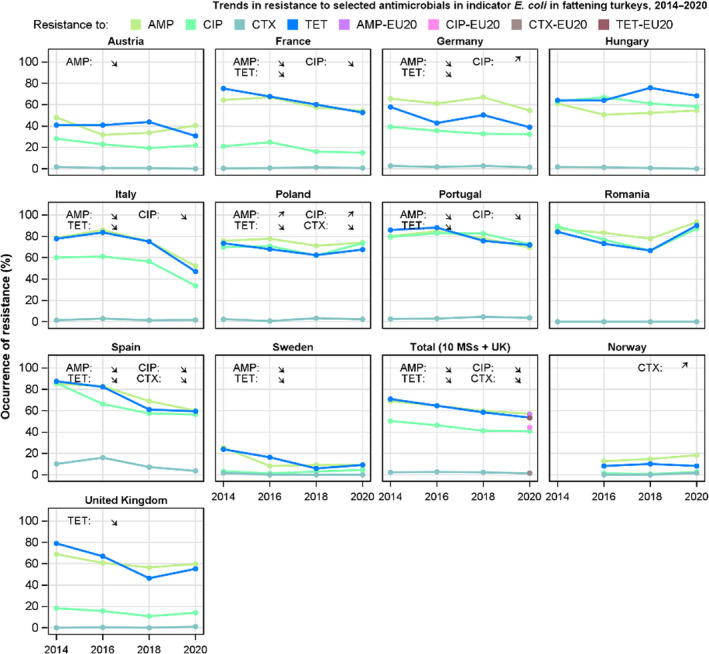
(↓)(↑): indicates statistically significant trends over the period 2015–2020.
(↓)(↑): indicates statistically significant trends over the period 2015–2019.
The upper bounds of the 95% confidence interval of the occurrence of complete susceptibility are also indicated.
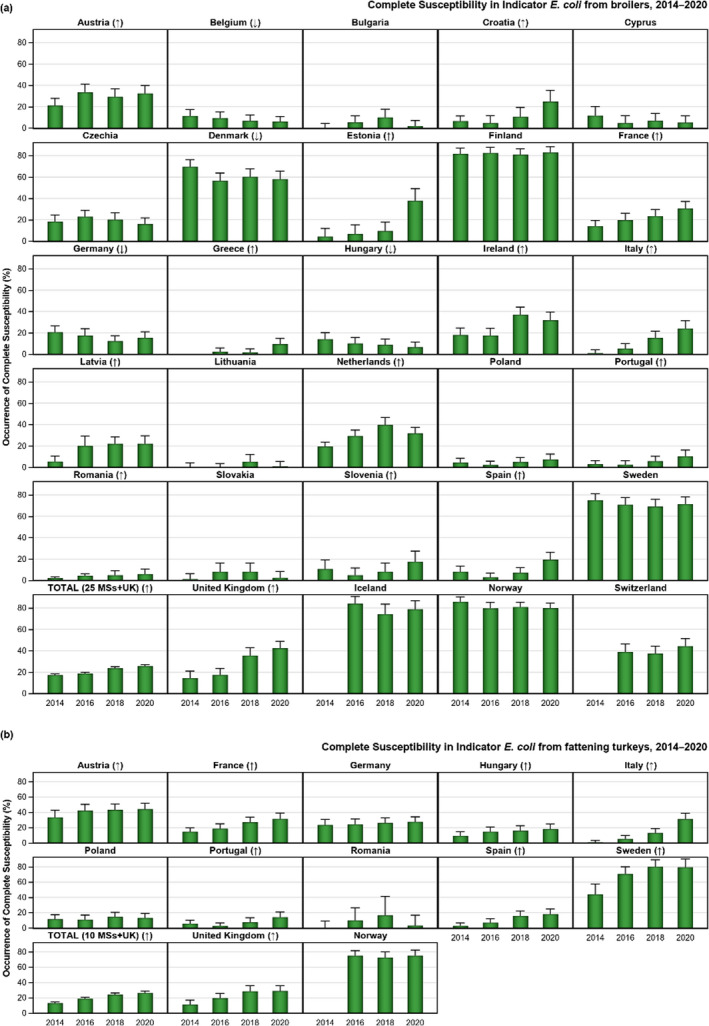
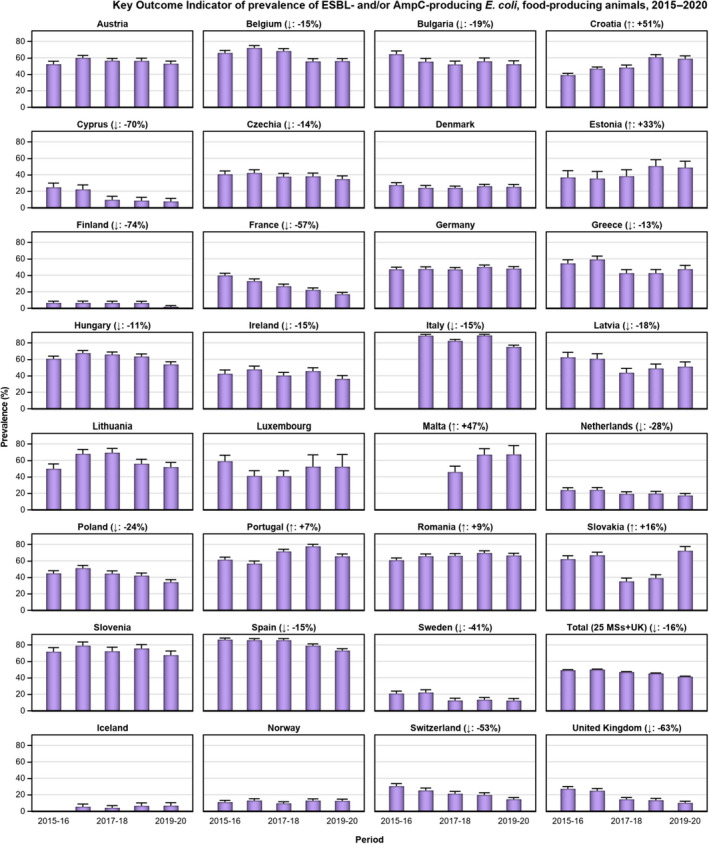
(↓)(↑): indicates statistically significant trends over the period 2014–2020. The upper bounds of the 95% CI are also shown.
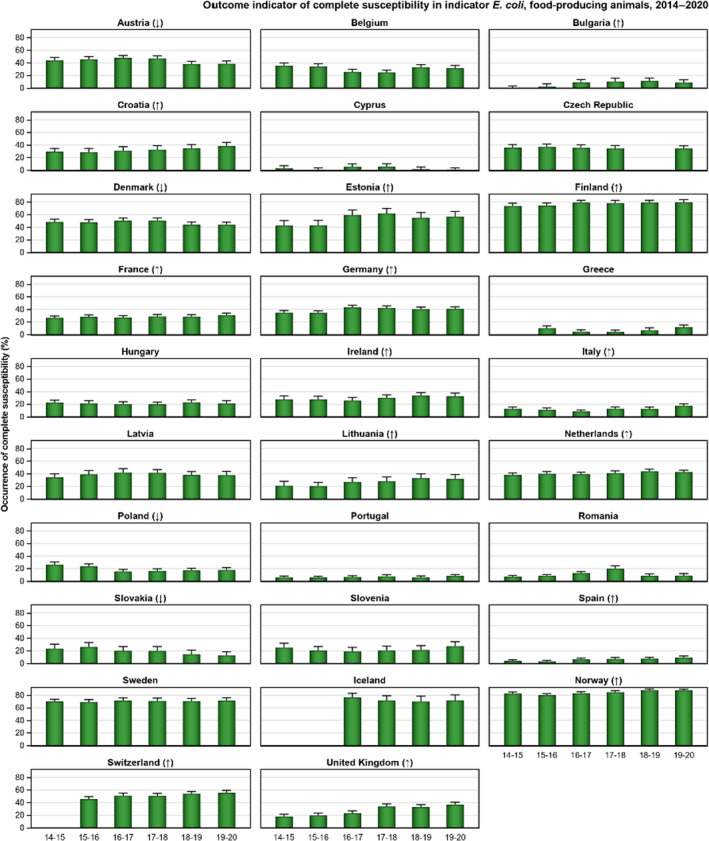
(↓)(↑): indicates statistically significant decreasing/increasing trends over the 2018–2014 period. The upper bounds of the 95% confidence interval of the KOICS are also indicated. Rates of change are given for statistically significant trends.
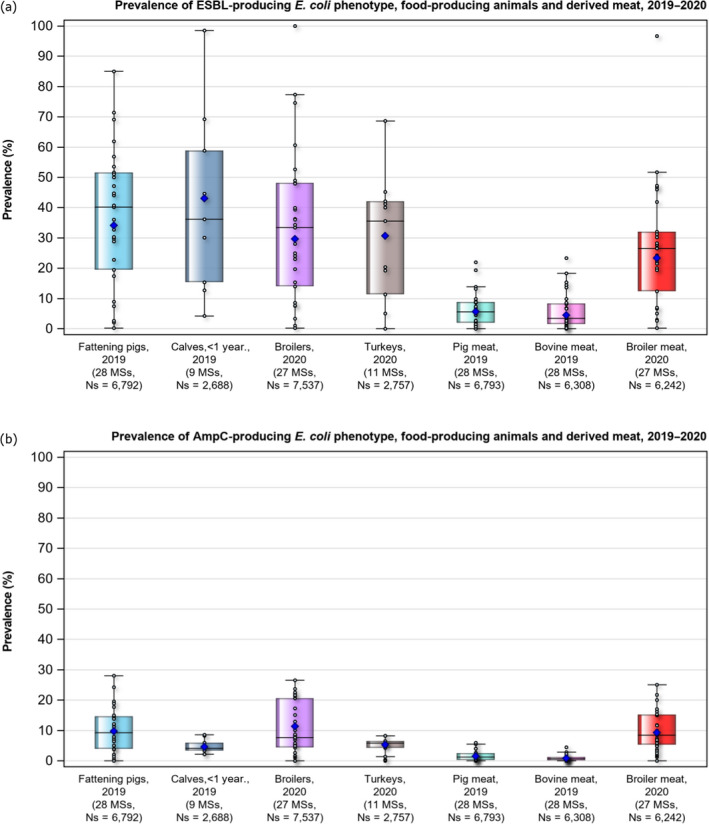
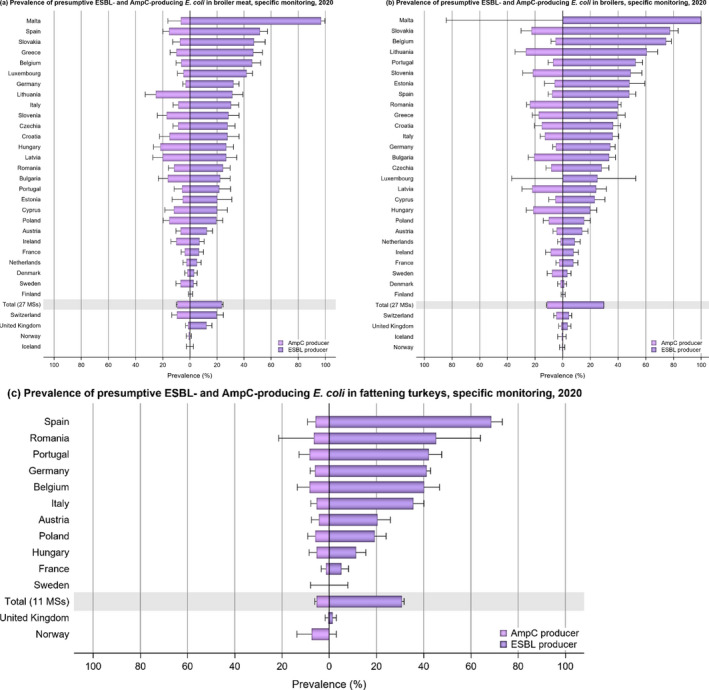
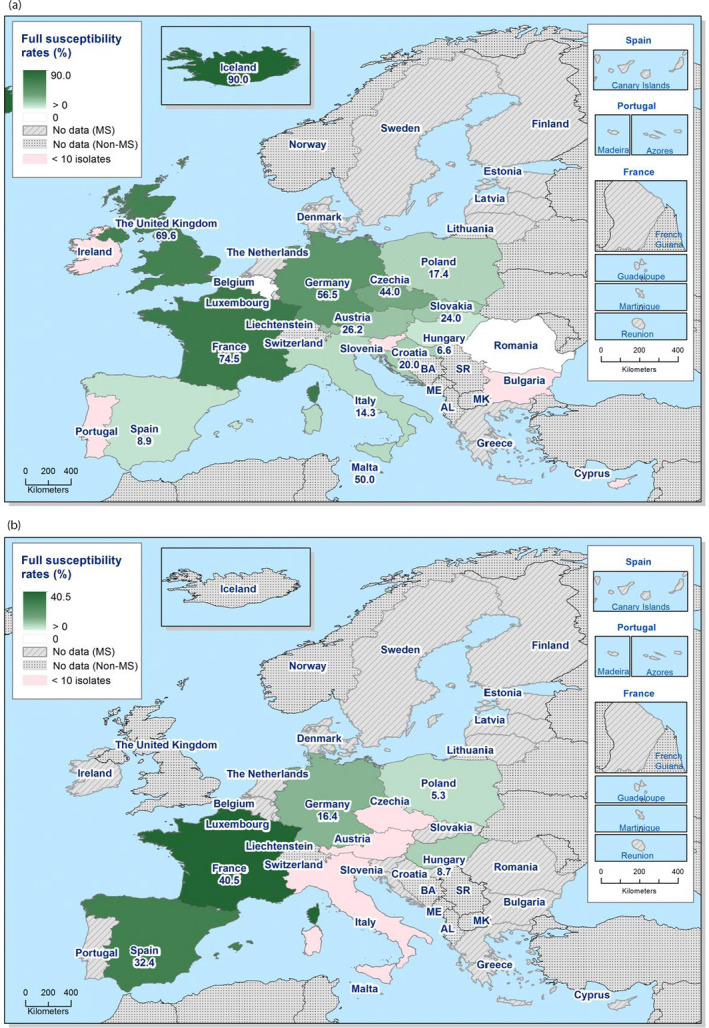
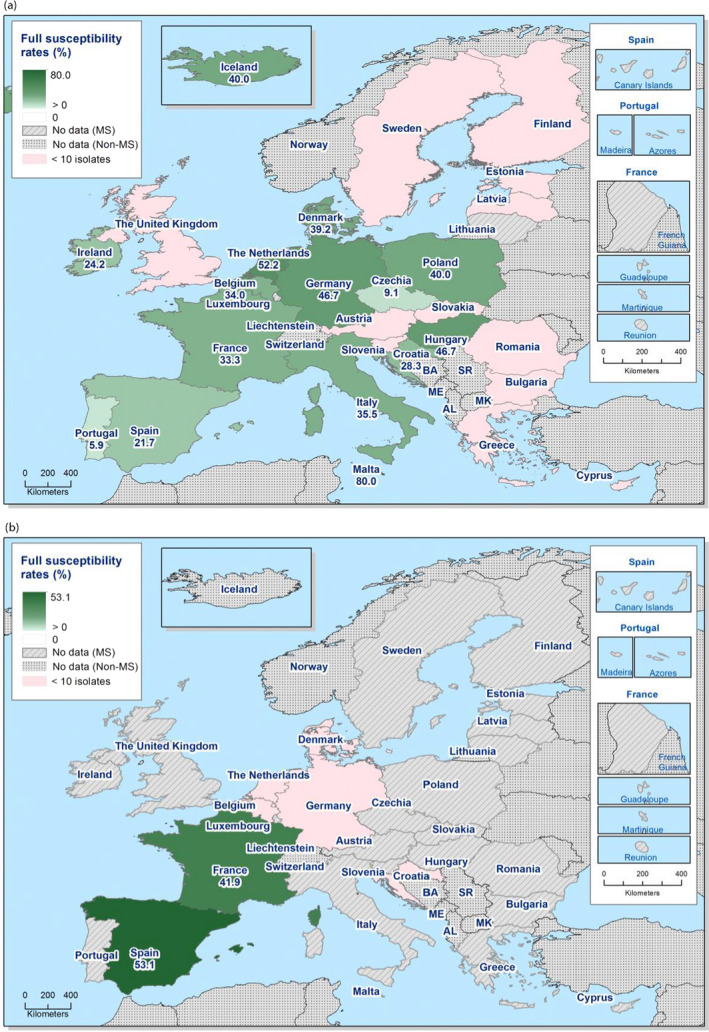
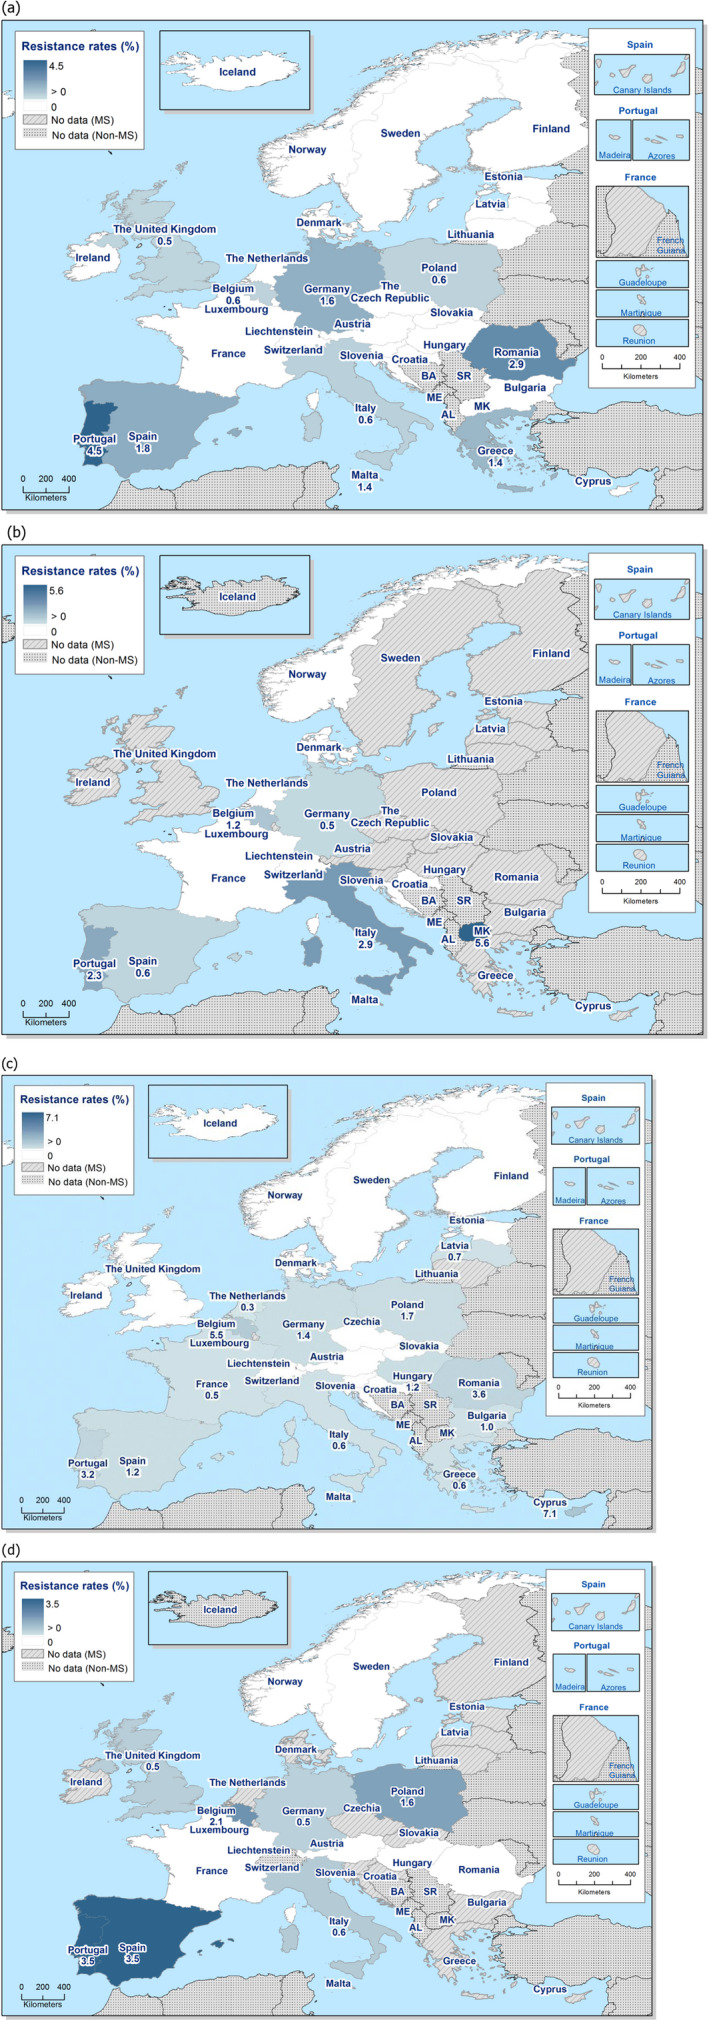
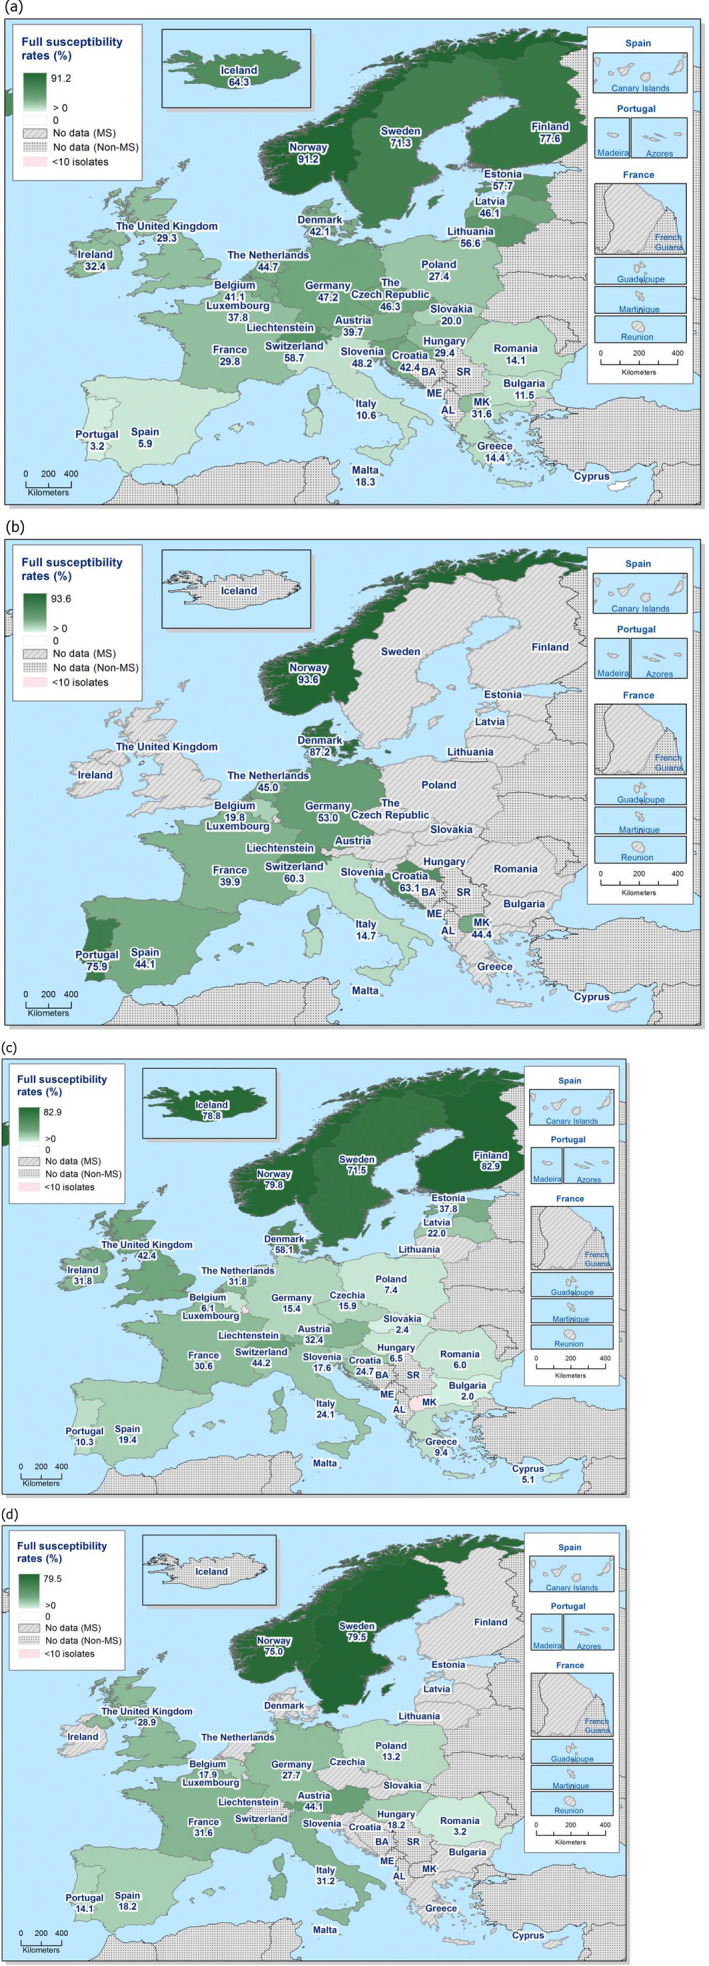
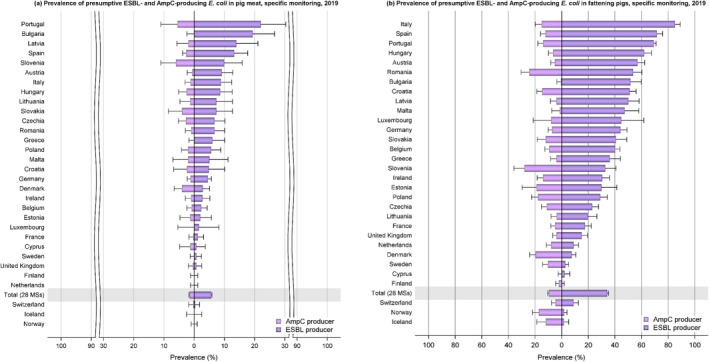
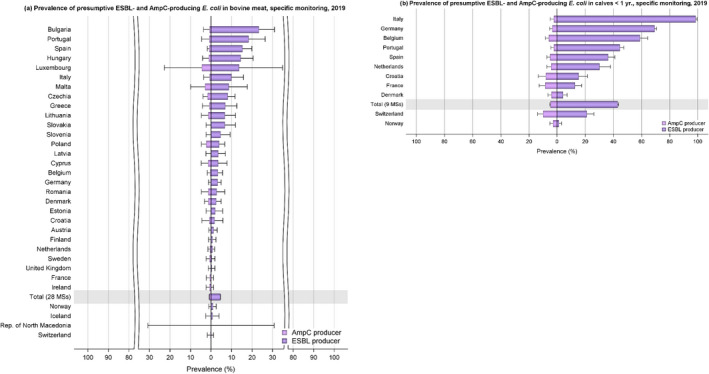
The upper bounds of the 95% confidence interval of the prevalence of ESBL- and/or AmpC-producing E. coli are also indicated.
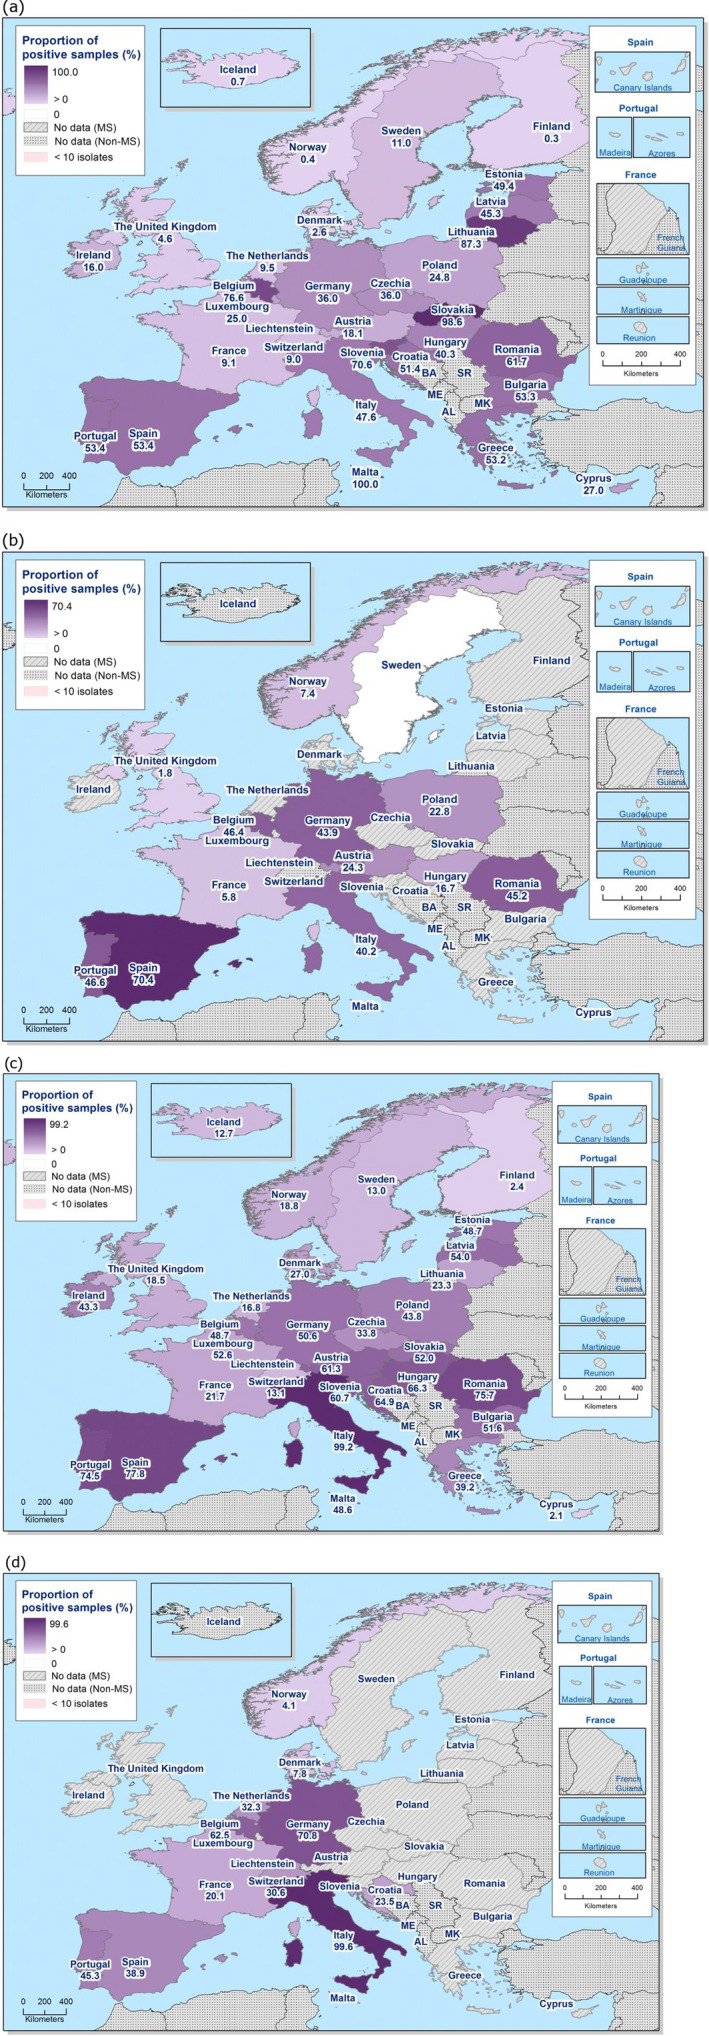
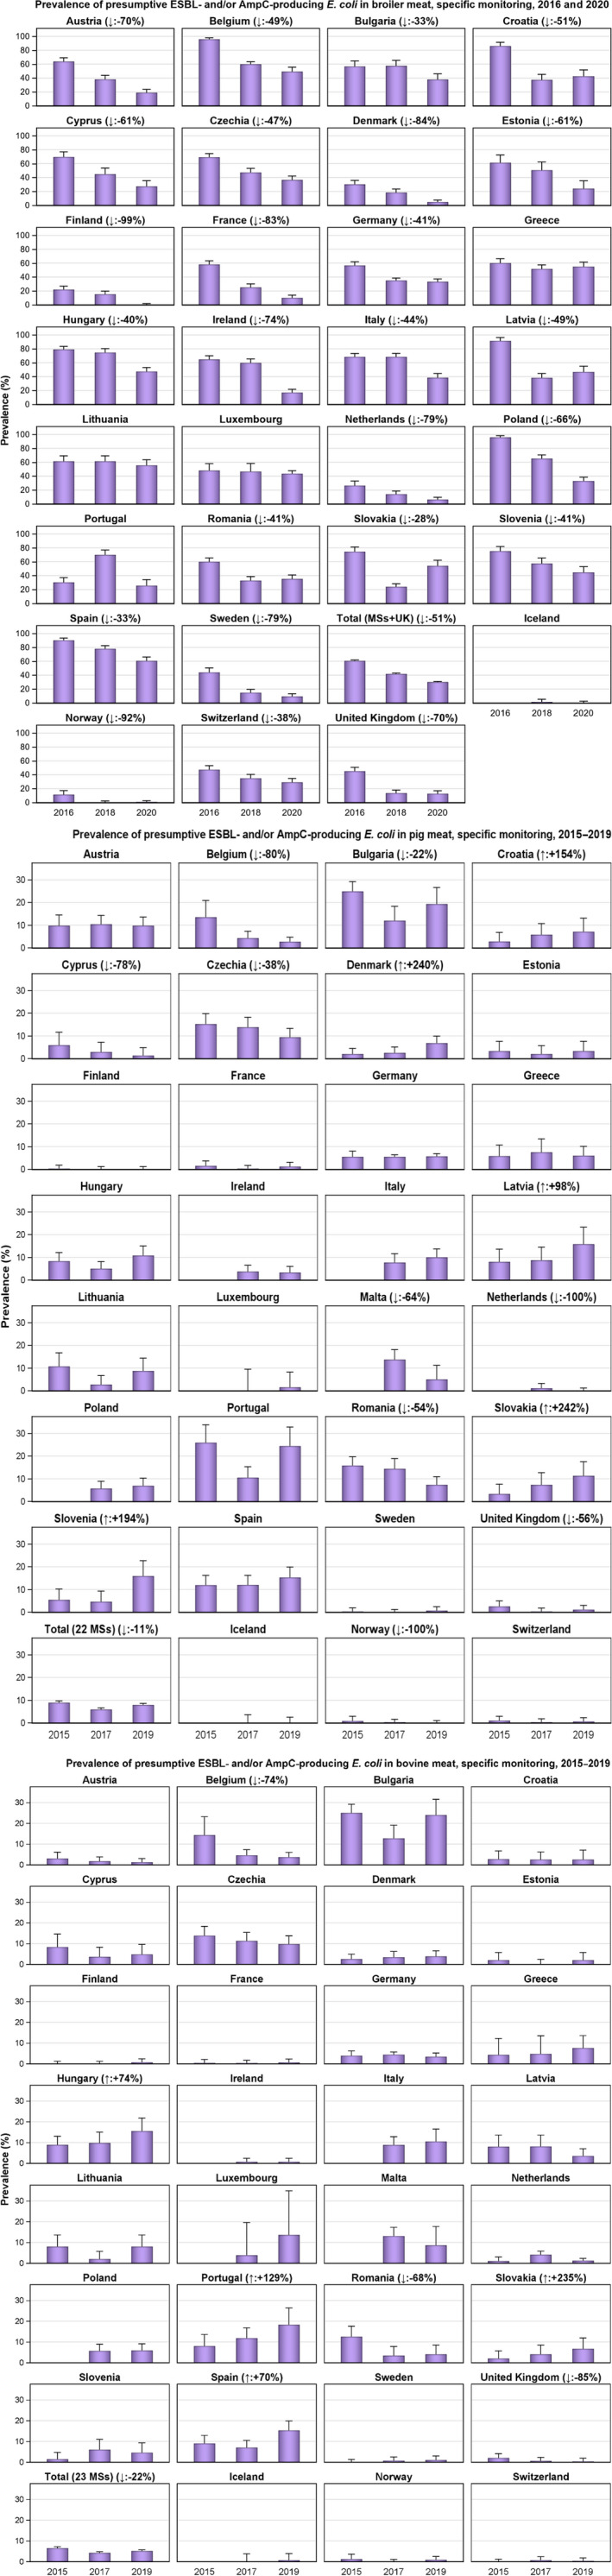
The upper bounds of the 95% confidence interval of the prevalence of ESBL‐ and/or AmpC‐producing E. coli are also indicated. Please note the different scales used for the x‐axis in the sub‐figures to improve the visibility of the variations among countries.
The upper bounds of the 95% confidence interval of the prevalence of ESBL‐ and/or AmpC‐producing E. coli are also indicated. Please note the different scales used for the x‐axis in the sub‐figures to improve the visibility of the variations among countries.
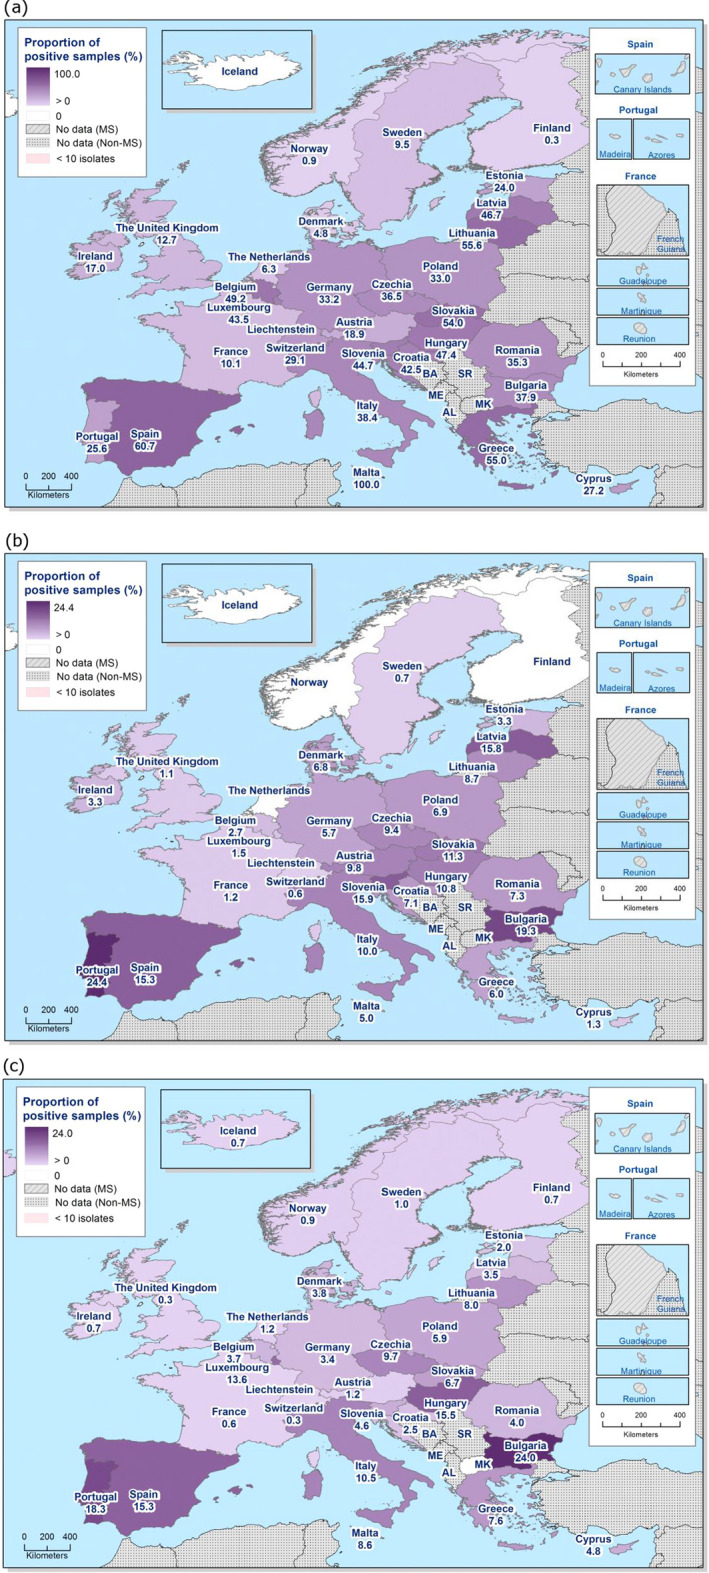
The upper bounds of the 95% confidence interval of the prevalence of ESBL‐ and/or AmpC‐producing E. coli are also indicated. Please note the different scales used for the x‐axis in the sub‐figures to improve the visibility of the variations among countries (a, 0–100%; b–c, 0–30%).
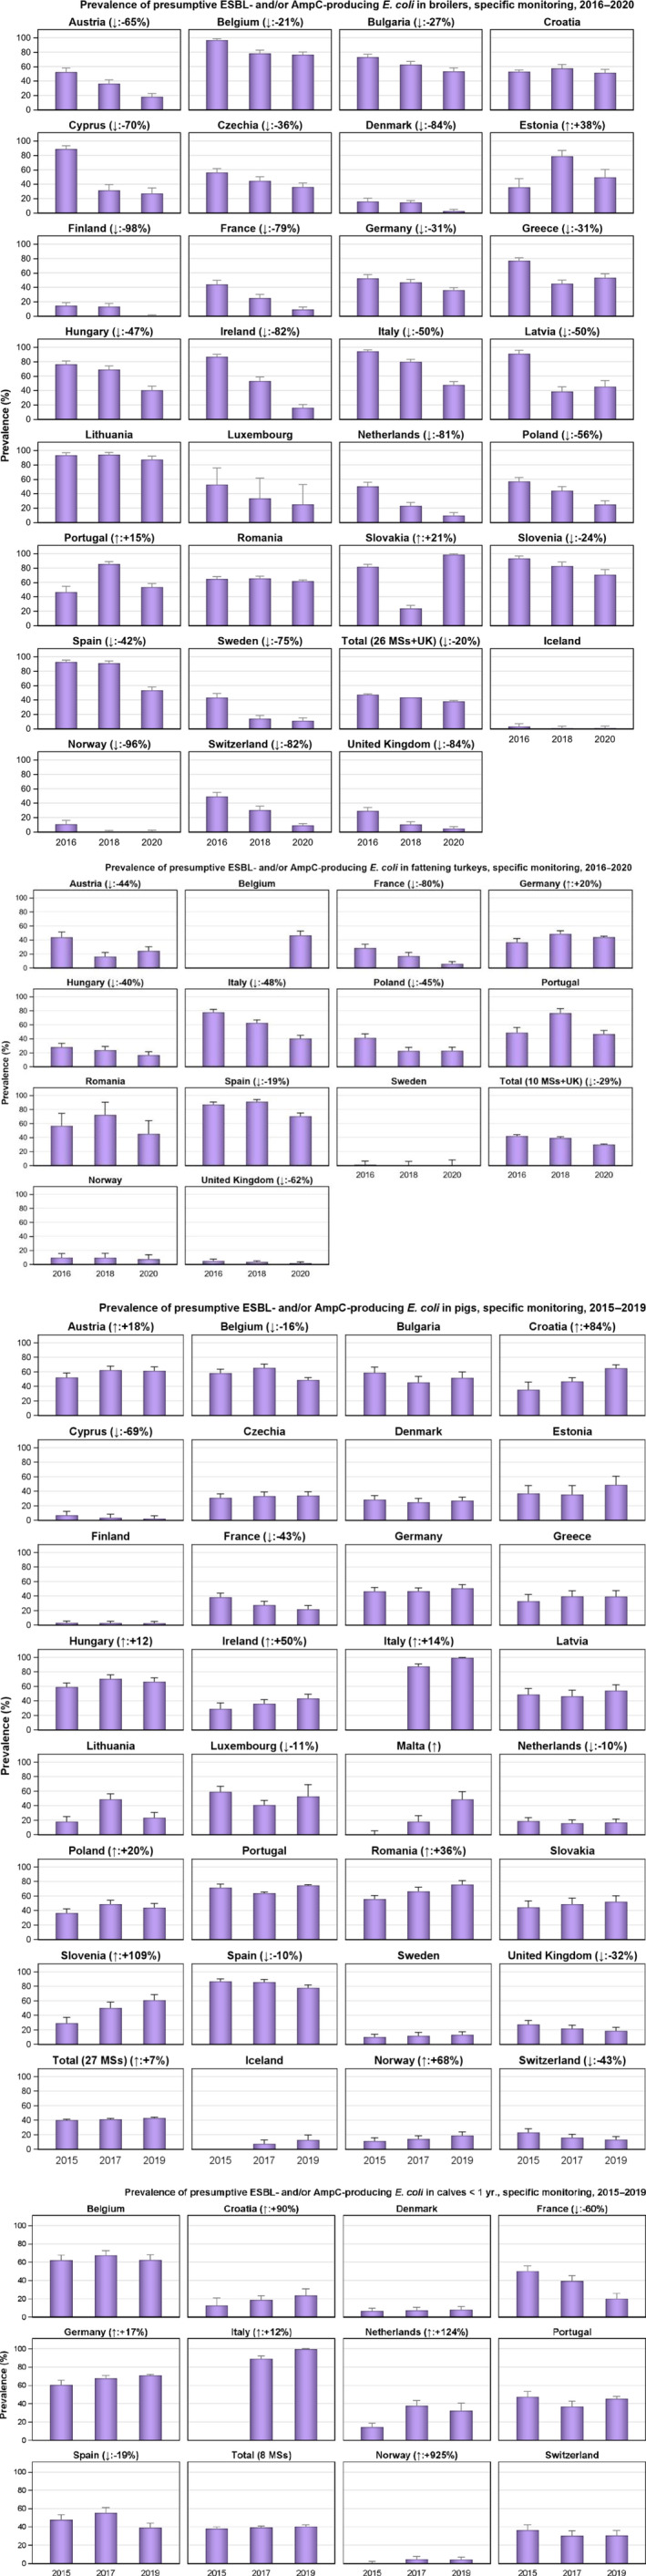
The upper bounds of the 95% confidence interval of the prevalence of ESBL‐ and/or AmpC‐producing E. coli are also indicated.
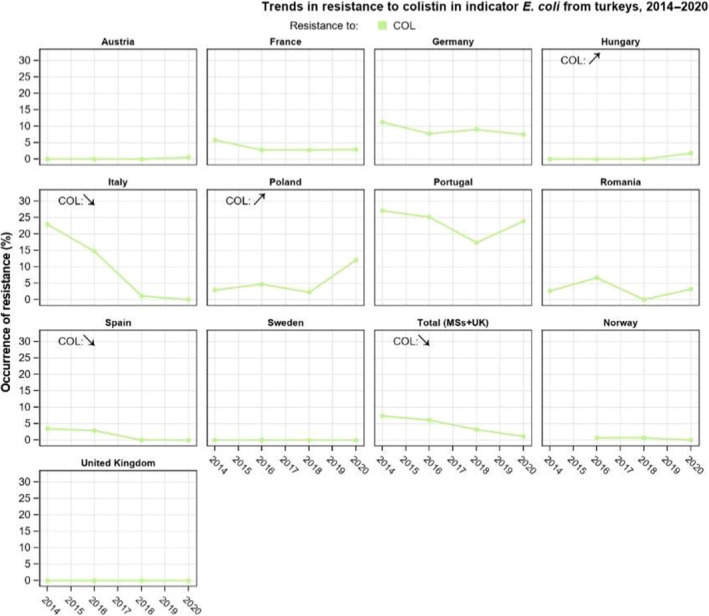
(↓)(↑): indicates statistically significant decreasing/increasing trends over the 2015–2020 period.
Rates of change are shown for the statistically significant decreasing/increasing trends observed.
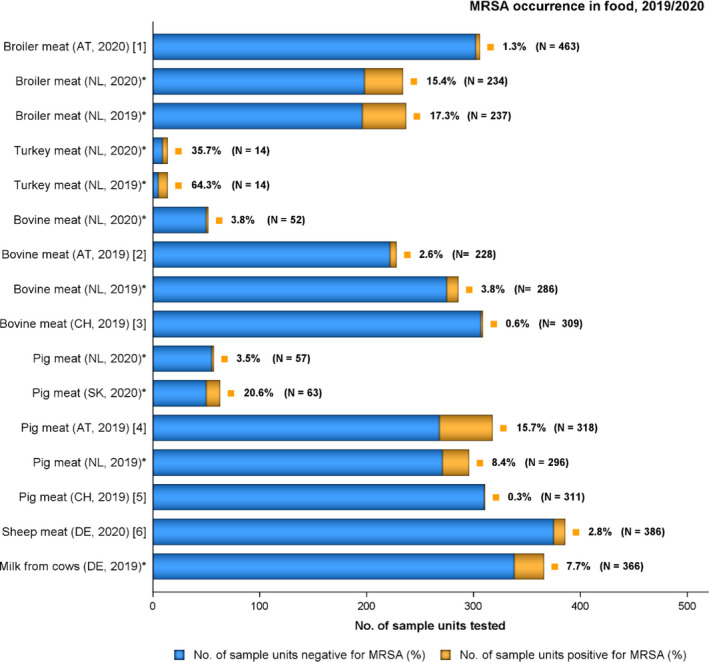
Only food origins where positive isolates were obtained are presented.
N: Total number of sample units tested; AT: Austria; DE: Germany; NL: the Netherlands; SK: Slovakia; CH: Switzerland.
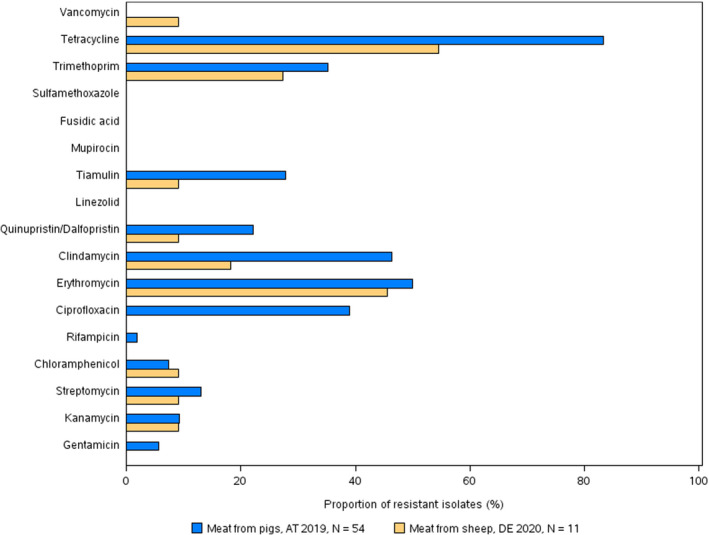
[1] Broiler meat (AT, 2020): spa‐types: t011 (four isolates) t034 (4).
[2] Bovine meat (AT, 2019): spa‐types: t008 ST8 (one isolate), t011 (2), t127 ST1 (2), t2346 (1). The t008 isolate was PVL‐positive; the two t127 isolates were PVL‐negative.
[3] Bovine meat (CH) : spa‐types were not reported; however, both isolates were confirmed to belong to CC398 using the sau1‐hsdS1 CC398 PCR reaction (Stegger et al., 2011).
[4] Pig meat (AT, 2019) : spa‐types : t002 ST5 (1 isolate), t003 ST3944 (1), t008 ST8 (1), t011 (22), t011 ST398 (1), t034 (12), t127 ST1 (2), t321 ST5050 (1), t843 ST130 (1), t899 (5), t1451 (2), t1456 (1). The t002 and t008 isolates were PVL‐positive. The two t127 isolates, as well as the single t003 and t321 isolates were PVL‐negative. The t843 isolate was reported to carry the mecC gene.
[5] Pig meat (CH, 2019) spa‐type was not reported; however, the isolate was confirmed to belong to CC398 using the sau1‐hsdS1 CC398 PCR reaction (Stegger et al., 2011).
[6] Sheep meat (DE, 2020) spa‐type: t011 (2 isolates), t034 (1), t1451 (1), t2576 (1), t19979 ST 398 (1), t223 (2), t267 (1), t1154, ST5 (1) t15010 ST97 (1).
*: spa‐types not reported.
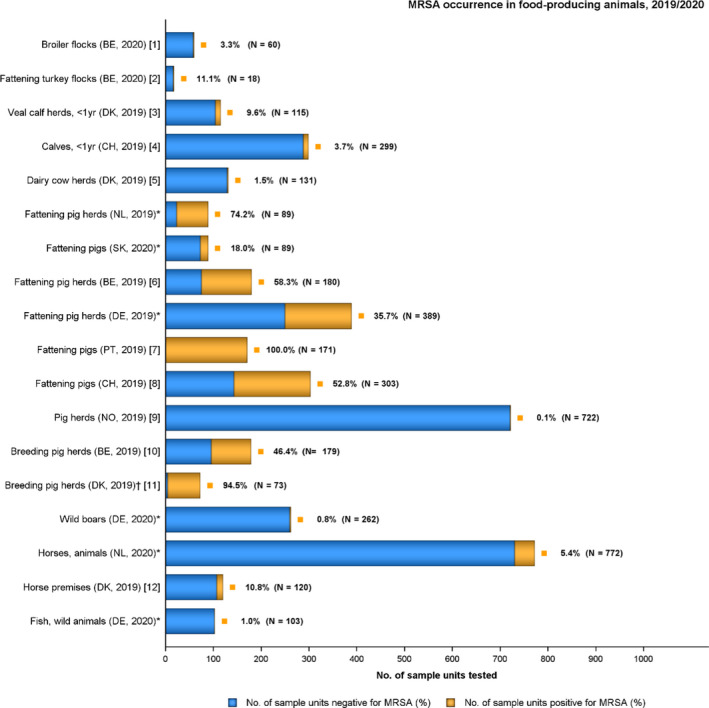
Only animal origins where positive isolates were obtained are presented.
N: Total number of sample units tested; BE: Belgium; CH: Switzerland; DE: Germany; DK: Denmark; NL: the Netherlands; NO: Norway; PT: Portugal.
[1] Broiler flocks, BE 2020: spa‐types: t011 CC398 (2 isolates).
[2] Fattening turkey flocks, BE 2020: spa‐types: t011 CC398 (2 isolates).
[3] Veal calf herds, DK 2019: spa‐types : t011 CC398 (1 isolate), t034 CC398 (8), t779 CC398 (1), t1580 CC398 (1).
[4] Calves < 1 year, CH2019: spa‐types were not reported; however, all 11 isolates were confirmed to belong to CC398 using the sau1‐hsdS1 CC398 PCR reaction (Stegger et al., 2011).
[5] Dairy cow herds, DK 2019 : spa‐types : t127 CC1 (one isolate), t843 CC130 (1). The t127 isolate was PVL‐negative, as well as negative for the human IEC gene scn. Spa‐type t843 was confirmed to carry the mecC gene.
[6] Fattening pig herds (BE 2019) : spa‐types: t011 CC398 (67 isolates), t034 CC398 (11), t1451 CC398 (2), t1457 CC398 (1), t2346 CC398 (1), t2370 CC398 (2), t2383 CC398 (1), t3041 CC398 (1), t3119 CC398 (1), unspecified (18).
[7] Fattening pigs, slaughter batches (PT 2019) : spa‐types : t011 CC398 (3), unspecified (168).
[8] Fattening pigs, (CH 2019) : spa‐types were not reported; however, 159/160 isolates were confirmed to belong to CC398 using the sau1‐hsdS1 CC398 PCR reaction (Stegger et al., 2011). The remaining isolate did not survive cryo‐conservation, therefore typing could not be performed.
[9] Pig herds (NO 2019) : spa‐type : t034 CC398 (1 isolate).
[10] Breeding pig herds (BE 2019) : spa‐types : t011 CC398 (57 isolates), t034 CC398 (18), t108 CC398 (2), t779 CC398 (1), t2346 CC398 (1), t2582 CC398 (1), t2922 CC398 (1), t3119 CC398 (2).
[11] Breeding pig herds (DK 2019) : spa‐types: t011 CC398 (10 isolates), t034 CC398 (57), t1928 CC398 (1), t4652 CC398 (1). † These comprised multiplier herds.
[12] Horse premises (DK 2019) : spa‐types: t011 CC398 (4 isolates), t034 CC398 (6), t1451 CC398 (1), t843 CC130 (1), t3256 CC130 (1). Spa‐types t843 and t3256 were confirmed to carry the mecC gene.
*: spa‐types not reported.
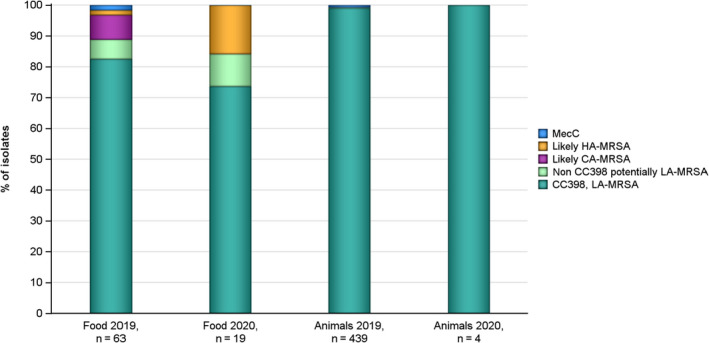
N = number of reported isolates with typing data, mecC: MRSA harbouring the mecC gene, HA‐MRSA: hospital acquired MRSA, CA‐MRSA: community acquired MRSA, LA‐MRSA: livestock associated MRSA, CC: clonal complex.
Inferred MRSA types in 2019 were recovered from pigs (243 isolates), cattle (13 isolates) and horses (13 isolates) at the herd/slaughter batch/stable level, as well as individual fattening pigs (159 isolates) and calves at slaughter (11 isolates). Isolates from animals in 2020 were derived from broiler flocks (2 isolates) and fattening turkey flocks (2 isolates).
Inferred MRSA types in food in 2019 were recovered from cattle meat (8 isolates) and pig meat (55 isolates). Isolates from food in 2020 were recovered from broiler meat (8 isolates) and meat from sheep (11).
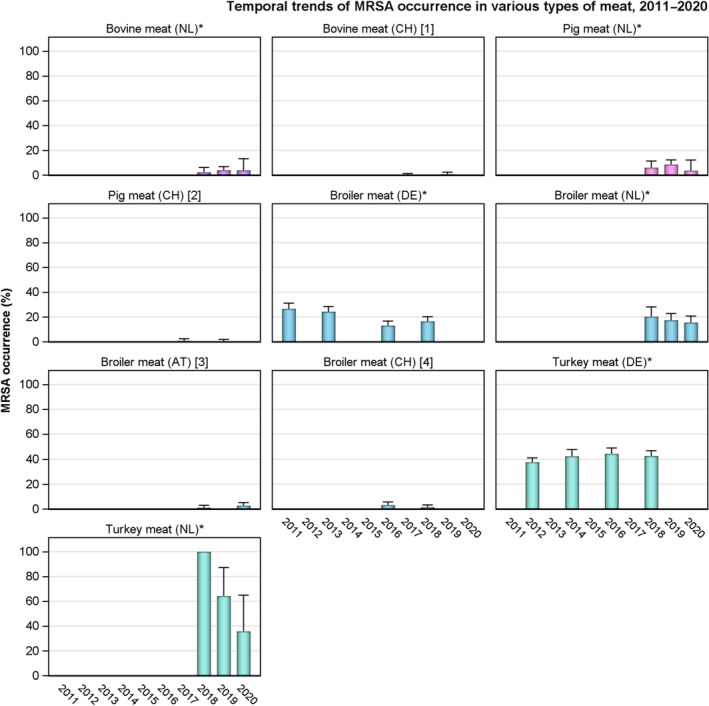
AT: Austria; CH: Switzerland; DE: Germany; NL: the Netherlands.
The 2‐S method of isolation was used by CH and DE from 2011 to 2018; while the 1‐S method was used by the NL from 2018 to 2019, as well as CH in 2019.
*: spa‐types not reported.
[1] In 2019, spa‐types were not reported; however, both isolates were confirmed to belong to CC398 using the sau1‐hsdS1 CC398 PCR reaction (Stegger et al., 2011).
[2] In 2017, spa‐type: t011 (1 isolate), t002 (1). PVL status of the t002 isolate was not reported. In 2019, spa‐type was not reported; however, the isolate was confirmed to belong to CC398 using the sau1‐hsdS1 CC398 PCR reaction (Stegger et al., 2011).
[3] In 2018, spa‐types: t011 (2 isolates), t034 (1 isolate). In 2020, spa‐types: t011 (4 isolates), t034 (4 isolates)
[4] In 2016, spa‐types: t034 (3 isolates), t153 (1), t1430 (3), t2123 (2). PVL status of the t153 isolate was not reported.
In 2018, spa‐types: t034 CC398 (1 isolate), t1430 (1), t571 CC398 (1), t13177 (1).
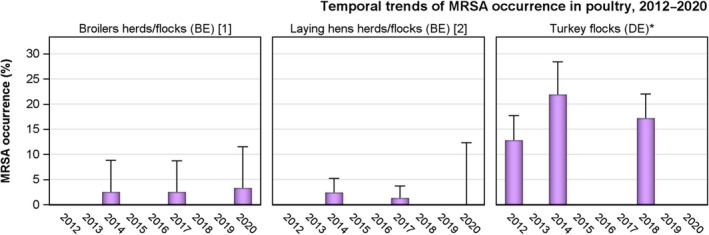
BE: Belgium; DE: Germany.
[1] Broiler flocks in 2014: spa‐types t011 CC398 (one isolate), t1985 CC398 (1)
Broiler flocks in 2017 and 2020: spa‐type t011 (two isolates each)
[2] Laying hens in 2014: spa‐types t011 CC398 (one isolate), t037 (5)
Laying hens in 2017: spa‐types t011 (two isolates), t037 ST239 (1)
*: No spa‐types reported
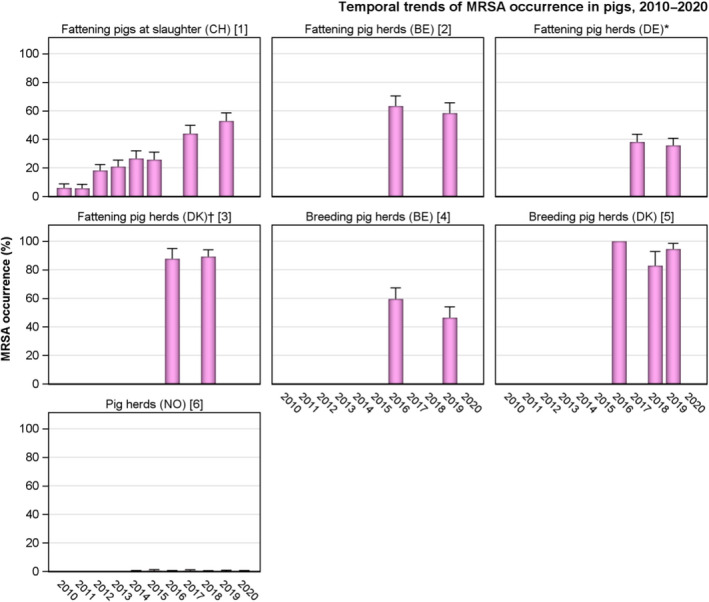
BE: Belgium; CH: Switzerland; DE: Germany; DK: Denmark; NO: Norway.
Note: The 2‐S method of isolation was used by Belgium and Germany from 2016 to 2019, as well as by Denmark in 2016, in Switzerland from 2010 to 2017 and in Norway from 2014 to 2017. The 1‐S method was used by Switzerland since 2019 and by Denmark and Norway since 2018.
*: spa‐types not reported.
†: Prevalence data for fattening pig herds (not raised under controlled housing conditions) from 2018 are not included.
[1] In 2010, spa‐types: t034 ST398 (17 isolates), t011 ST398 (1), t208 ST49 (5). In 2011, spa‐types: t034 ST398 (19 isolates), t011 ST398 (1), t208 ST49 (1), t2279 ST1 (1). In 2012, spa‐types: t034 CC398 (61 isolates), t011 CC398 (9), t208 ST49 (2). In 2013, spa‐types: t034 (63 isolates), t011 (10). In 2014, spa‐types: t034 (57 isolates), t011 (19), t208 (1), t899 (1), t2741 (1). In 2015, spa‐types: t034 (48 isolates), t011 (23), t032 (1), t571 (1), t899 (1), t1145 (1), t1250 (1), t4475 (1). In 2017, spa‐types: t034 (63 isolates), t011 (61), t899 (2), t1451 (3), t2330 (1), t2876 (1). In 2019, spa‐types were not reported; however, 159/160 isolates were confirmed to belong to CC398 using the sau1‐hsdS1 CC398 PCR reaction (Stegger et al., 2011). The remaining isolate did not survive cryo‐conservation, therefore typing could not be performed.
[2] In 2016, spa‐types: t011 CC398 (71 isolates), t1451 (1), t1456 (1), t1456 CC398 (1), t1580 (5), t1985 (8), t1985 CC398 (3), t034 (7), t034 CC398 (2), t037 (1), t898 (1), unspecified (11). In 2019, spa‐types: t011 CC398 (67 isolates), t034 CC398 (11), t1451 CC398 (2), t1457 CC398 (1), t2346 CC398 (1), t2370 CC398 (2), t2383 CC398 (1), t3041 CC398 (1), t3119 CC398 (1), unspecified (18).
[3] In 2016, spa‐types not reported. In 2018, spa‐types: t011 CC398 (22 isolates), t034 CC398 (85), t571 CC398 (3), t898 CC398 (1), t2383 CC398 (1), t2974 CC398 (1), t3423 CC398 (1), t4652 CC398 (1), t9266 CC398 (1).
[4] In 2016, spa‐types: t011 CC398 (55 isolates), t1451 (2), t1456 (1), t1456 CC398 (3), t1580 (1), t1985 (5), t1985 CC398 (1), t034 (1), t034 CC398 (4), t4659 CC398 (1), unspecified (17). In 2019, spa‐types: t011 CC398 (57 isolates), t034 CC398 (18), t108 CC398 (2), t779 CC398 (1), t2346 CC398 (1), t2582 CC398 (1), t2922 CC398 (1), t3119 CC398 (2).
[5] In 2016, spa‐types not reported. In 2018, spa‐types: t011 CC398 (6 isolates), t034 CC398 (24), t1250 CC398 (2), t1793 CC398 (1), t3171 CC398 (1). In 2019, spa‐types t011 CC398 (10), t034 CC398 (57), t1928 CC398 (1), t4652 CC398 (1) were identified in isolates from multiplier pig herds.
[6] In 2014, spa‐type: t011 CC398 (1). In 2015, spa‐type: t034 CC398 (2), t177 CC1 (2). In 2016, spa‐type: t034 CC398 (1).
In 2017, spa‐types: t091 CC7 (1 isolate), t843 CC130 (1), t6292 CC425 (1). The t091 isolate was PVL‐negative, spa‐types t843 and t6292 were confirmed to carry the mecC gene. In 2019, spa‐type: t034 CC398 (1).
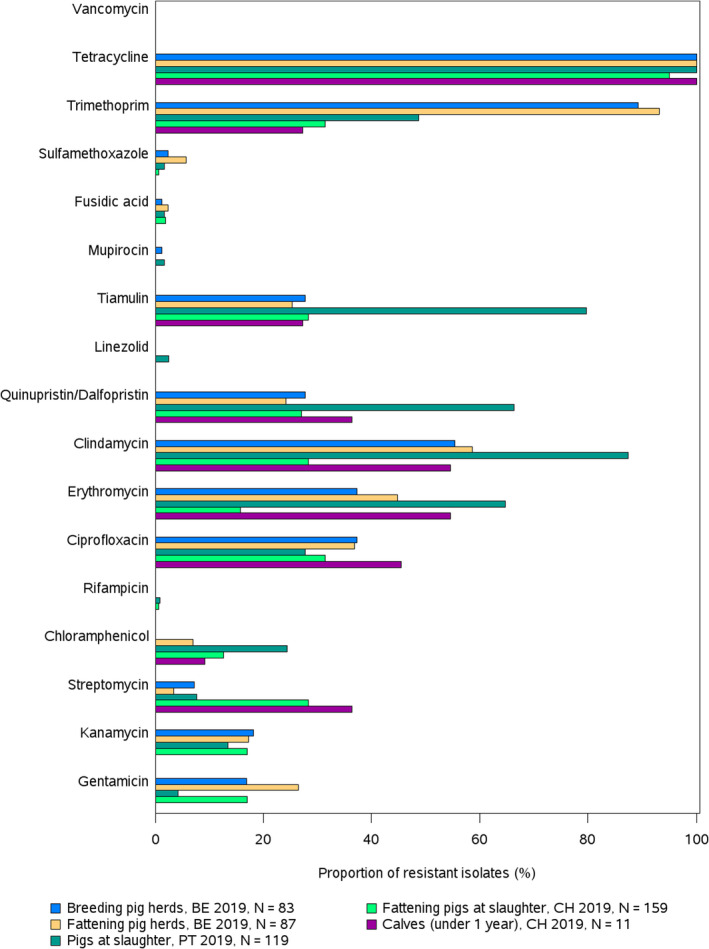
BE: Belgium; CH: Switzerland; PT: Portugal. N: number of tested isolates. All isolates were resistant to Penicillin and Cefoxitin.
Portugal: susceptibility data for a further 52 isolates recovered from batches of fattening pigs at slaughter were not reported. Switzerland: susceptibility data for one isolate recovered from a fattening pig was not available; the isolate did not survive cryo‐conservation.
AT: Austria; DE: Germany. N: number of tested isolates. All isolates were resistant to Penicillin and Cefoxitin.Austria: susceptibility data are also included for four isolates recovered from additional ad hoc sampling.Only food matrices with 10 or more reported isolates per country.
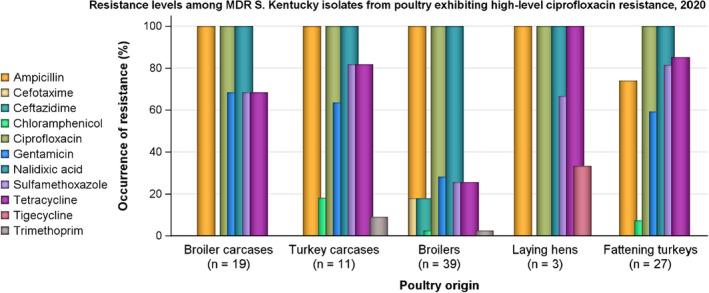
n: Total number of MDR S. Kentucky isolates exhibiting high‐level ciprofloxacin resistance.
NB: The single S. Kentucky isolate recovered from a pig carcase in 2019, which also displayed high‐level ciprofloxacin resistance, additionally showed resistance to AMP‐GEN‐NAL‐SMX‐TET. None of the S. Kentucky isolates reported exhibited either azithromycin or colistin resistance.
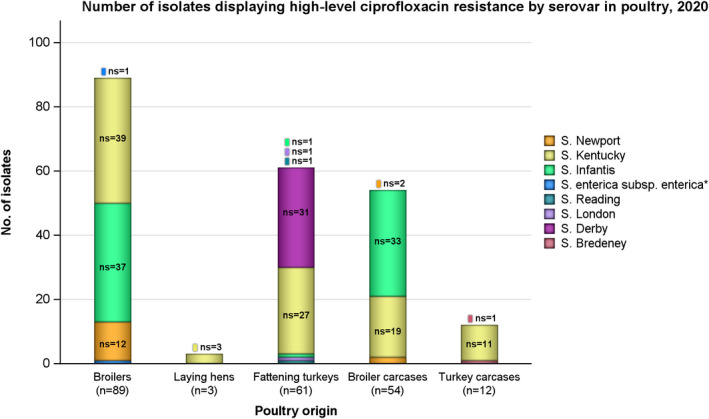
n: Total number of Salmonella isolates exhibiting high‐level ciprofloxacin resistance; ns: number of isolates by serovar exhibiting high‐level ciprofloxacin resistance; * serovar unspecified; salmonellas in the legend are listed according to their predominance within all the animal/carcase origins; in addition, a single S. Kentucky isolate displaying high‐level ciprofloxacin resistance was recovered from a pig carcase in 2019.
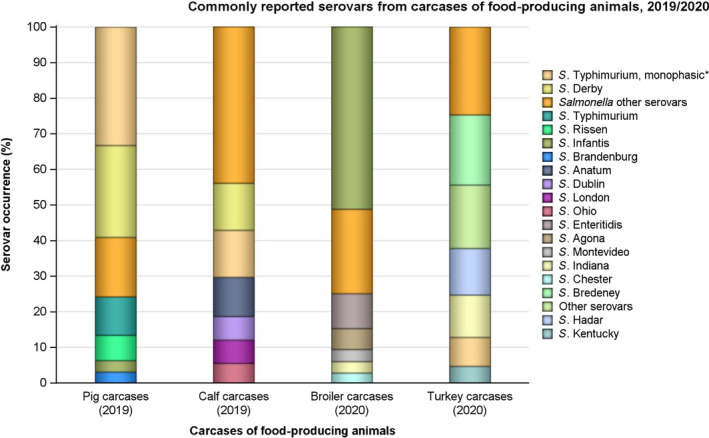
*: Monophasic S. Typhimurium includes antigenic formulas; serovars in the legend are listed according to their predominance within all the carcase origins. From calf carcases, S. Dublin and S. London were joint fourth most frequently reported.
N: Total number of Salmonella spp. or total number of particular serovars recovered from the carcase monitoring.
*: Monophasic S. Typhimurium includes antigenic formulas.
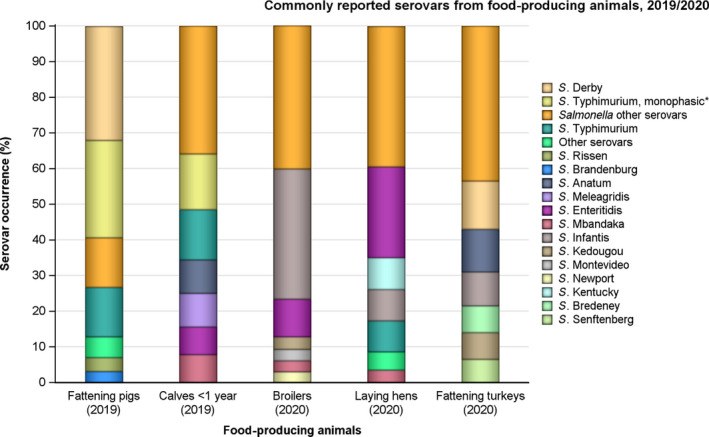
*: Monophasic S. Typhimurium includes antigenic formulas; serovars in the legend are listed according to their predominance within all the animal origins. From calves, S. Anatum and S. Meleagridis were the joint third most frequently reported; S. Enteritidis and S. Mbandaka were the joint fourth most frequently reported.
N: Total number of Salmonella spp. or total number of particular serovars recovered from the monitoring of animals.
*: Monophasic S. Typhimurium includes antigenic formulas.
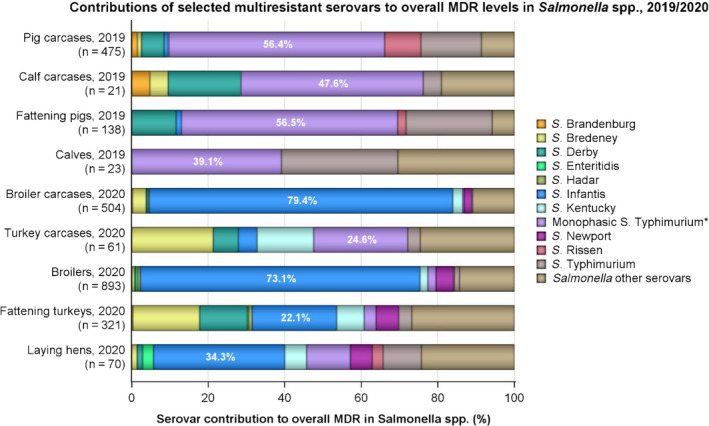
n: Total number of Salmonella isolates exhibiting MDR; serovars contributing the highest levels of MDR to overall MDR levels in Salmonella spp. are illustrated with a percentage; * monophasic S. Typhimurium includes antigenic formulas; serovars in the legend are listed according to their predominance within all the animal/carcase origins.
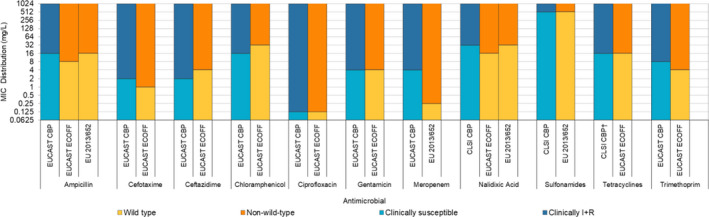
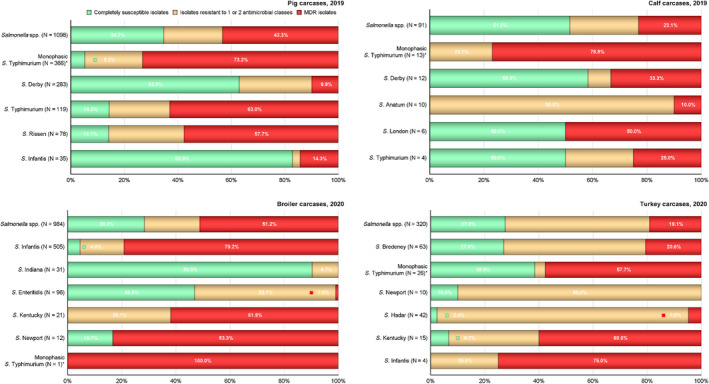
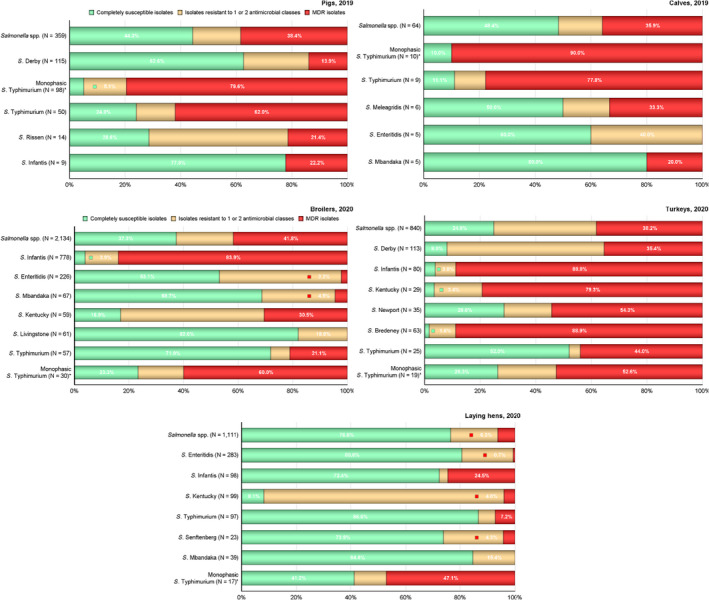
*: EUCAST has changed the definitions of SIR from 2019 (EUCAST, 2019 –
http://www.eucast.org/newsiandr/ ). For I, the new definition ‘susceptible, increased exposure’ is used when there is a high likelihood of therapeutic success because exposure to the agent is increased by adjusting the dosing regimen or by its concentration at the site of infection. ? Only R category included.
N: Total number of isolates reported by MSs.
N: Total number of isolates reported by MSs.
NB. S. Enteritidis was not reported from turkey carcases.
N: Total number of isolates reported by MSs.
N: Total number of isolates reported by MSs.
N: Total number of isolates reported by MSs.
N: Total number of isolates reported by MSs.
NB: The S. Derby isolate reported from calves was completely susceptible to all of the 14 antimicrobials tested in the harmonised panel.
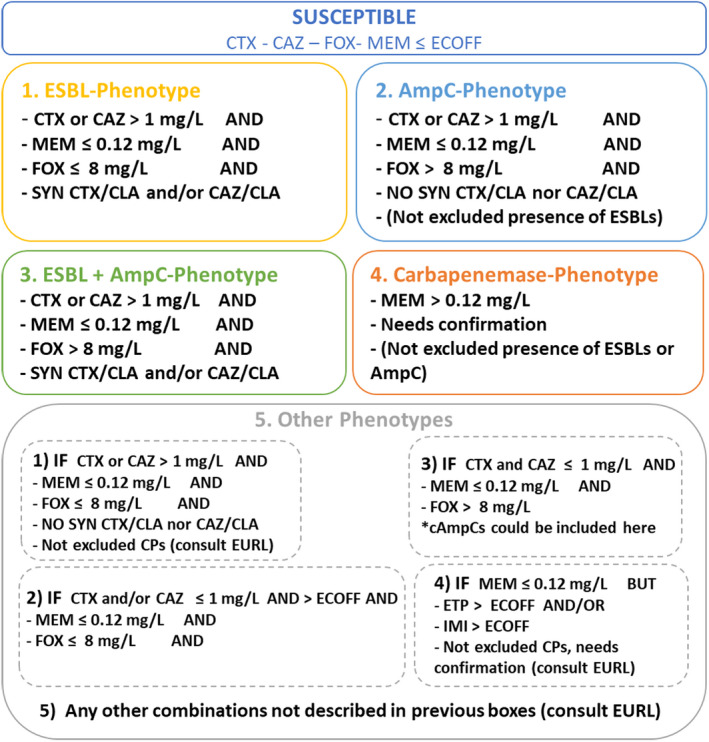
Presumptive ESBL‐producers include isolates exhibiting Phenotype 1 or 3.
Presumptive AmpC producers include isolates exhibiting Phenotype 2 or 3.
References
-
- Alba P, Feltrin F, Cordaro G, Porrero MC, Kraushaar B, Argudin MA, Nykasenoja S, Monaco M, Stegger M, Aarestrup FM, Butaye P, Franco A and Battisti A, 2015. Livestock‐associated methicillin resistant and methicillin susceptible staphylococcus aureus sequence type (CC)1 in European Farmed Animals: high genetic relatedness of isolates from italian cattle herds and humans. PLoS One, 10, e0137143. 10.1371/journal.pone.0137143 - DOI - PMC - PubMed
-
- Alt K, Fetsch A, Schroeter A, Guerra B, Hammerl JA, Hertwig S, Senkov N, Geinets A, Mueller‐Graf C, Braeunig J, Kaesbohrer A, Appel B, Hensel A and Tenhagen BA, 2011. Factors associated with the occurrence of MRSA CC398 in herds of fattening pigs in Germany. BMC Veterinary Research, 7, 7–69. 10.1186/1746-6148-7-69 - DOI - PMC - PubMed
LinkOut - more resources
Full Text Sources