. 2022 Apr;19(189):20210903.
doi: 10.1098/rsif.2021.0903. Epub 2022 Apr 6.

A stochastic mathematical model of 4D tumour spheroids with real-time fluorescent cell cycle labelling

Affiliations

A stochastic mathematical model of 4D tumour spheroids with real-time fluorescent cell cycle labelling

Jonah J Klowss et al. J R Soc Interface. 2022 Apr.

Abstract

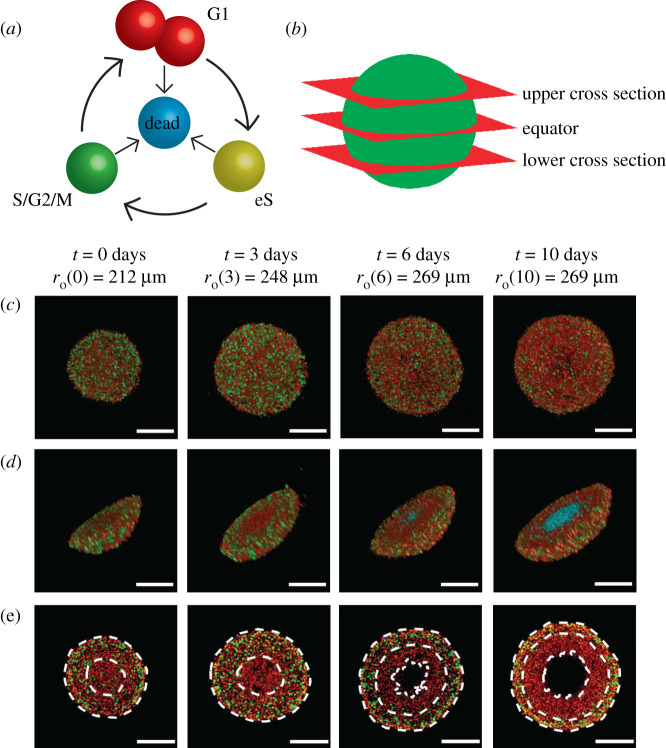
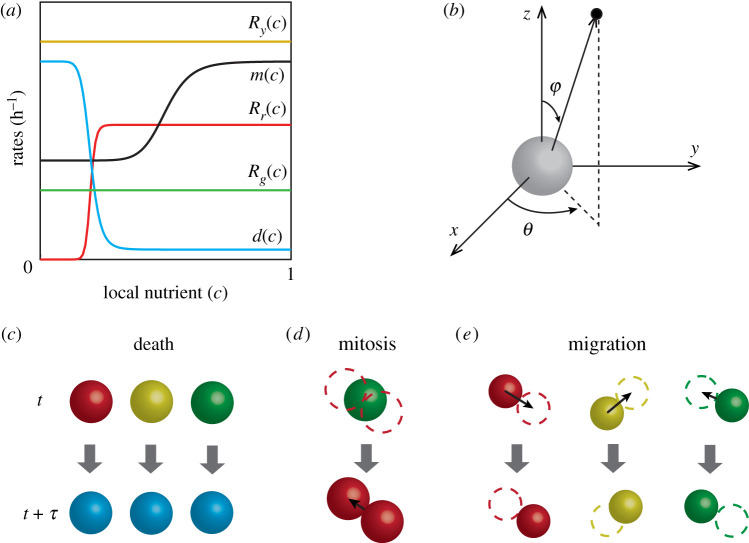
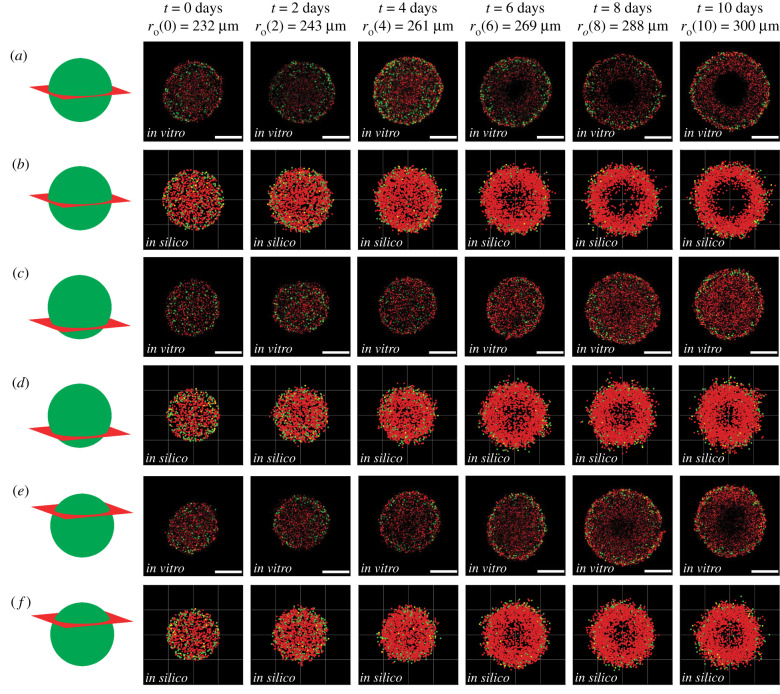
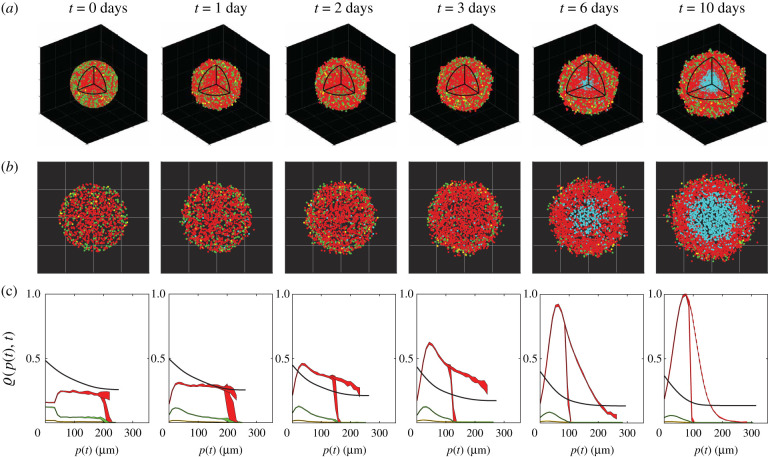
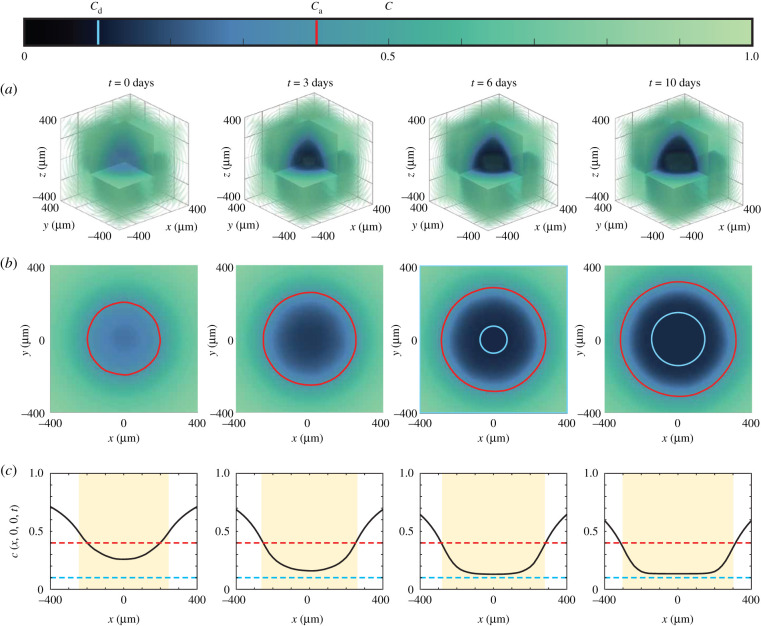
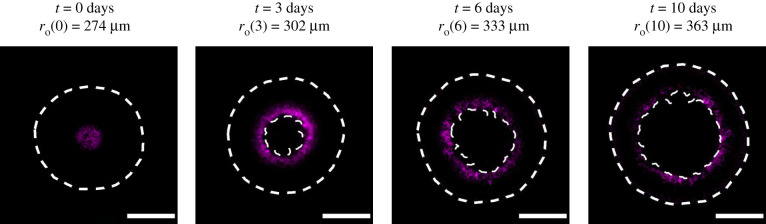
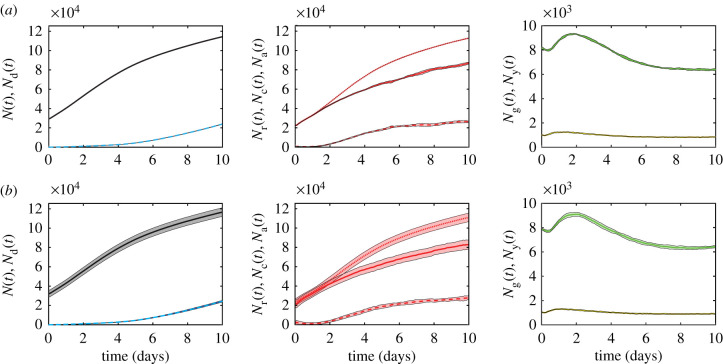
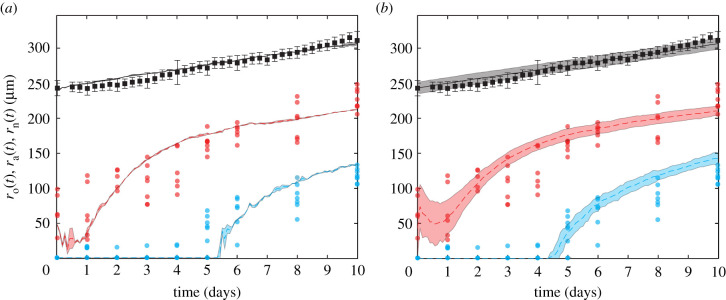
In vitro tumour spheroids have been used to study avascular tumour growth and drug design for over 50 years. Tumour spheroids exhibit heterogeneity within the growing population that is thought to be related to spatial and temporal differences in nutrient availability. The recent development of real-time fluorescent cell cycle imaging allows us to identify the position and cell cycle status of individual cells within the growing spheroid, giving rise to the notion of a four-dimensional (4D) tumour spheroid. We develop the first stochastic individual-based model (IBM) of a 4D tumour spheroid and show that IBM simulation data compares well with experimental data using a primary human melanoma cell line. The IBM provides quantitative information about nutrient availability within the spheroid, which is important because it is difficult to measure these data experimentally.

Keywords: FUCCI; cancer; individual-based model; melanoma; population dynamics.


Conflict of interest statement

We declare we have no competing interests.

Figures

Figure 1.
Figure 1.
Motivation. (a) A schematic of the cell cycle, indicating the transition between different cell cycle phases, and their associated FUCCI fluorescence. Red, yellow and green colouring indicates cells in G1, eS and S/G2/M phase, respectively. (b) Locations of the upper cross section, equator and lower cross section. (ce) Experimental images of a tumour spheroid using the human melanoma cell line WM793B at days 0, 3, 6 and 10 (after formation) showing. (c) Full spheroids, viewed from above, (d) spheroid hemispheres and (e) spheroid slices, where the cross section is taken at the equator. White dashed lines in (e) denote the boundaries of different regions, where the outermost region is the proliferative zone, the next region inward is the G1-arrested region, and the innermost region at days 6 and 10 is the necrotic core. In (a) and (d), we use cyan colouring for dead cells, which assist in identifying the necrotic core in (d). Spheroid outer radii are labelled alongside their corresponding time points, and scale bars represent 200 μm.
Figure 2.
Figure 2.
IBM schematic. (a) Nutrient-dependent rates (equations (2.1)–(2.5)). (b) Random directions for migration and mitosis are obtained by sampling the polar angle θ, and the azimuthal angle φ separately. (ce) Schematics showing agent-level events; death, mitosis and migration, across a time interval of duration τ. (c) Any living agent may die, removing it from the simulation. (d) An agent located at xn undergoes mitosis to produce two daughter agents in G1 phase and dispersed a distance of σ/2 from xn in opposite, randomly chosen directions. (e) Any living agent can migrate in a random direction with step length μ.
Figure 3.
Figure 3.
Comparison of in vitro and in silico 4D spheroids. Experimental results (a,c,e) are compared with simulation results (b,d,f) by examining 2D slices at the equator, lower and upper cross section, respectively. Agent colour (red, yellow, green) corresponds to FUCCI labelling (G1, eS, S/G2/M). Schematics in the left-most column indicate the location of the 2D cross section. The images are taken at (ab) the equator, (cd) the lower cross section, and (ef) the upper cross section. Experimental spheroid radii at the equator are labelled at each time point, and scale bars represent 200 μm.
Figure 4.
Figure 4.
Typical IBM simulation, showing: (a) visualizations of in silico spheroids including dead agents (cyan) and (b) cross sections through the spheroid equator with dead agents. (c) Relative concentrations ϱ(p, t) of nutrient (black) and cycling red, yellow and green agents (coloured appropriately), based on distance from the periphery p(t)=ro(t)r, averaged over 10 identically prepared simulations. The dashed red line shows the relative density of arrested red agents, also averaged over 10 simulations with identical initial conditions. For nutrient, ϱ(p, t) = c. For agents, ϱ(p, t) is the relative agent density (electronic supplementary material, S10). Shaded areas represent plus or minus one standard deviation about the mean, and are non-zero as a consequence of stochasticity in the model, even though the 10 simulations start with identical populations and radii.
Figure 5.
Figure 5.
Nutrient concentration profiles (a) in three spatial dimensions, (b) at the equator z = 0, with the arrest critical level ca shown in red, and the size of the necrotic region in white. (c) Nutrient profiles along the midline y = z = 0, where the shaded region represents the size of the spheroid, and the red and cyan lines are the critical levels for arrest and death, ca and cd respectively. The colour bar corresponds to the profiles in (ab), and denotes the values ca (red) and cd (cyan).
Figure 6.
Figure 6.
Spheroids stained for hypoxia at 0, 3, 6 and 10 days after spheroid formation, imaged at the spheroid equator. Hypoxia-positive staining fluoresces magenta, and white dashed lines denote ro(t) and rn(t), detected with image processing, to contextualize the regions of hypoxia. For clear visualization, we label the outer radii of the spheroid with the corresponding days. Image intensity was adjusted for visual purposes, and scale bar corresponds to 200 μm.
Figure 7.
Figure 7.
Modelling results for the population growth of different spheroid populations, averaged over 10 simulations with (a) identical initial conditions for each realization and (b) introduced experimental variability in initial spheroid radius and population, with the agent density held constant and initial radius ro(t)[232.75,235.47,238.97,242.19,244.89,247.76,247.93,251.23,251.48,260.13]μm. In each row, left: living (black) and dead (cyan dashed) populations, N(t) and Nd(t), respectively, centre: arrested red (dashed), cycling red (solid) and total red (dotted) populations, Na(t), Nc(t) and Nr(t), respectively, and right: yellow and green populations, Ny(t) and Ng(t), respectively. Shaded areas represent plus or minus one standard deviation. Initial subpopulations in each simulation in both (a) and (b) are variable, as initial cell cycle status is assigned randomly (electronic supplementary material, S8), and so the initial subpopulations in (b) also naturally vary with the overall initial population, N(0).
Figure 8.
Figure 8.
Comparison of computational estimates of ro(t) (black), ra(t) (red) and rn(t) (cyan) with experimental data. The experimental data (dots) are compared with (a) simulations with each run starting with an identical parameter set and (b) simulations with variations of the initial spheroid radius and population, with each initial radius selected from experimentally measured radii at t = 0 days and agent density kept constant. Computational results are the average of 10 simulations, and error regions represent plus or minus 1 s.d. The initial subpopulations vary in both (a) and (b), due to randomly assigning cell cycle status (electronic supplementary material, S8). In (b), we also naturally see higher variations in each subpopulation initially, due to explicitly including initial population variability, which in turn induces variability in ra(0).

References

    1. Nunes AS, Barris AS, Costa EC, Moreira AF, Correia IJ. 2018. 3D tumor spheroids as in vitro models to mimic in vivo human solid tumors resistance to therapeutic drugs. Biotechnol. Bioeng. 116, 206-226. (10.1002/bit.26845) - DOI - PubMed
    1. Lazzari G, Couvreur P, Mura S. 2017. Multicellular tumor spheroids: a relevant 3D model for the in vitro preclinical investigation of polymer nanomedicines. Polymer Chem. 8, 4947-4969. (10.1039/C7PY00559H) - DOI
    1. Spoerri L, Beaumont KA, Anfosso A, Haass NK. 2017. Real-time cell cycle imaging in a 3D cell culture model of melanoma. Methods Mol. Biol. 1612, 401-416. (10.1007/978-1-4939-7021-6_29) - DOI - PubMed
    1. Haass NK, Beaumont KA, Hill DS, Anfosso A, Mrass P, Munoz MA, Kinjyo I, Weninger W. 2014. Real-time cell cycle imaging during melanoma growth, invasion, and drug response. Pigment Cell Melanoma Res. 27, 764-776. (10.1111/pcmr.12274) - DOI - PubMed
    1. Mehta G, Hsiao AY, Ingram M, Luker GD, Takayama S. 2012. Opportunities and challenges for use of tumor spheroids as models to test drug delivery and efficacy. J. Control Release 164, 192-204. (10.1016/j.jconrel.2012.04.045) - DOI - PMC - PubMed

Publication types