. 2022 Apr;19(189):20210811.
doi: 10.1098/rsif.2021.0811. Epub 2022 Apr 6.

Multi-scale modelling reveals that early super-spreader events are a likely contributor to novel variant predominance

Affiliations

Multi-scale modelling reveals that early super-spreader events are a likely contributor to novel variant predominance

Ashish Goyal et al. J R Soc Interface. 2022 Apr.

Abstract

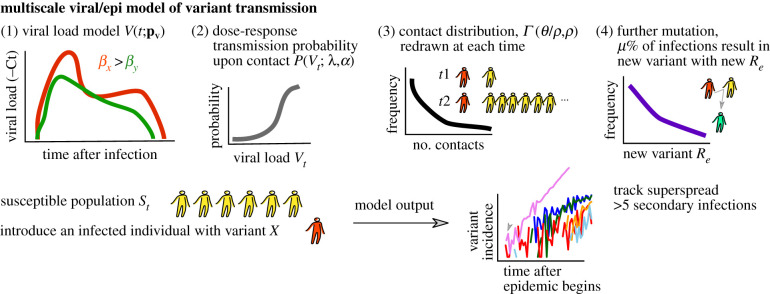
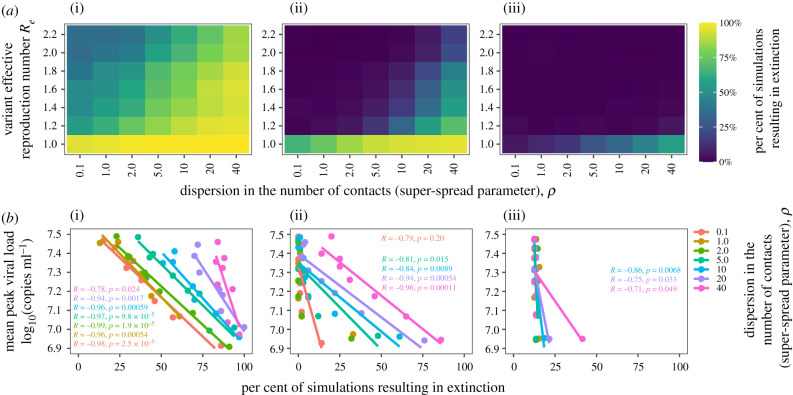
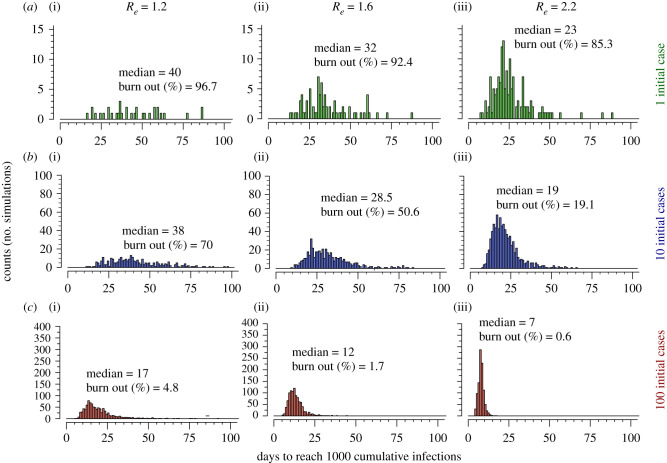
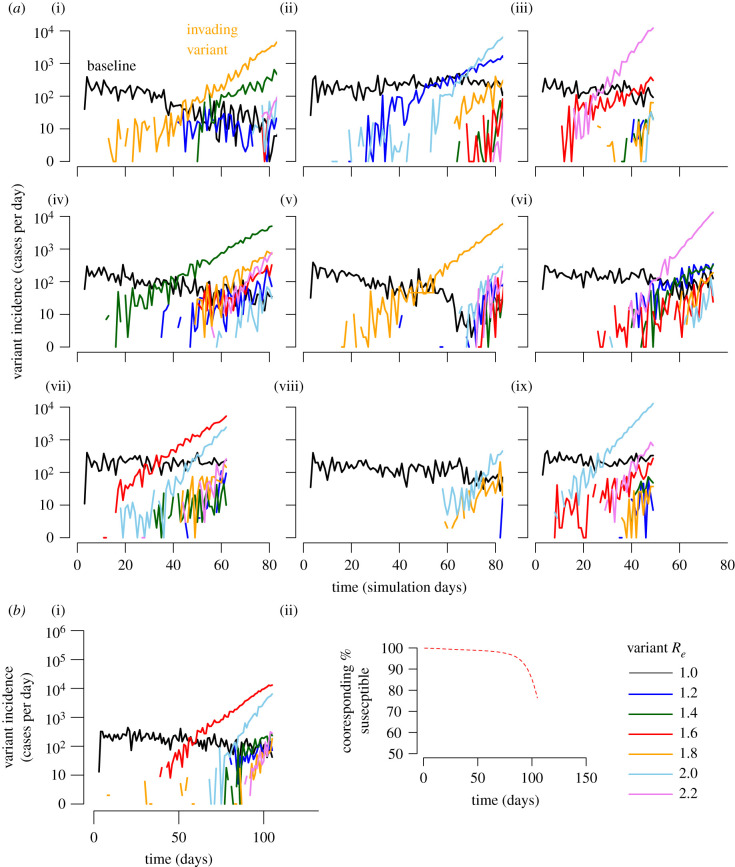
The emergence of new SARS-CoV-2 variants of concern (VOC) has hampered international efforts to contain the COVID-19 pandemic. VOCs have been characterized to varying degrees by higher transmissibility, worse infection outcomes and evasion of vaccine and infection-induced immunologic memory. VOCs are hypothesized to have originated from animal reservoirs, communities in regions with low surveillance and/or single individuals with poor immunologic control of the virus. Yet, the factors dictating which variants ultimately predominate remain incompletely characterized. Here we present a multi-scale model of SARS-CoV-2 dynamics that describes population spread through individuals whose viral loads and numbers of contacts (drawn from an over-dispersed distribution) are both time-varying. This framework allows us to explore how super-spreader events (SSE) (defined as greater than five secondary infections per day) contribute to variant emergence. We find stochasticity remains a powerful determinant of predominance. Variants that predominate are more likely to be associated with higher infectiousness, an SSE early after variant emergence and ongoing decline of the current dominant variant. Additionally, our simulations reveal that most new highly infectious variants that infect one or a few individuals do not achieve permanence in the population. Consequently, interventions that reduce super-spreading may delay or mitigate emergence of VOCs.

Keywords: COVID-19; SARS-CoV-2; mathematical modelling; novel variants.


Conflict of interest statement

The authors have no competing interests.

Figures

Figure 1.
Figure 1.
Multi-scale model schematic. We model an epidemic in which infected individuals with given variants (e.g. red) are introduced into a susceptible population (e.g. yellow). Individual viral load trajectories are tracked, and viral load is assumed to influence infection probability as a dose–response type function. Contacts occur stochastically over time and are drawn from a distribution in which potential SSEs (greater than five infections) are possible but not common. As incidence increases, additional variants each with potentially different transmissibility can emerge, though the depletion of susceptible individuals may influence these onward dynamics.
Figure 2.
Figure 2.
New SARS-CoV-2 variants with high transmissibility (Re > 1) often extinguish with low initial cases, but extinction is unlikely after an early super-spreading event. We simulated the introduction of 1 (i), 10 (ii) or 100 (iii) infected cases (columns) with a given variant into a population of 1 million susceptible individuals and allowed for time-varying viral load, stochastic transmission and super-spreading. (a) Heatmaps illustrate the percentage of simulations that resulted in extinction (blue: no extinction, yellow: frequent extinction) across ranges of super-spread parameter (gamma-distributed network dispersion) and variant reproduction number. Super-spread parameter ranges encompass low (ρ = 0.1, a realistic value for influenza) to high super-spread potential (ρ = 40, an upper estimate of SARS-CoV-2 infection). Ranges of effective reproductive number (Re) encompass values from throughout the COVID-19 pandemic, which can be modulated by factors such as circulating variant transmissibility, social distancing, masking and/or proportion immune at a given time. Note the electronic supplementary material, figure S1 shows that Re is not strongly influenced by the super-spreading parameter. (b) Correlation between extinction probability and peak viral load, coloured by super-spread parameter, illustrate viral load kinetics influence transmission dynamics, particularly for lower dispersion and single-case introduction. Here, peak viral load is a determinant of Re.
Figure 3.
Figure 3.
Time to invasion among SARS-CoV-2 simulations which do not burn out. Invasion is defined as 1000 cumulative infections. Scenarios (ac) modulate the number of initial cases (1, 10 and 100) and columns modulate the effective reproductive number of the initial variant, respectively. Low Re and low number of initial cases (a(i)) is associated with a higher median and larger variance in time to invasion. Differences in y-axis scale through rows highlight that there is less extinction in scenarios with higher numbers of initial cases and higher Re.
Figure 4.
Figure 4.
Relationship between timing and number of SSEs and time to invasion. Invasion is defined as 1000 cumulative infections. Scenarios assume varying definitions of SSEs as (a) greater than 5, (b) greater than 10 and (c) greater than 20 secondary infections on any day. Each plot also varies the invading variant reproductive number (noted in bold Re). Correlations were tested between the day of the first SSE as well as the number of SSEs against the time of invasion (defined as reaching 1000 cumulative infections). An early day of the first SSE predicts more rapid time to invasion, particularly when the invading variant had higher Re and an SSE is defined as greater than 20 infections in a day (see lower red panels). The total number of SSEs was generally not predictive of time to invasion. Pearson correlation coefficient (r) and corresponding trendlines are only noted in plots for which p < 0.05.
Figure 5.
Figure 5.
New variant predominance depends on timing of variant introduction, variant effective reproductive numbers and numbers of ongoing infections. (a) Nine out of 100 simulations starting with 1000 infections of a baseline variant (black line) with Re = 1 are shown. New variants (e.g. orange line in (i)) are randomly generated in 1% of transmissions and coloured according to Re (drawn from a uniform distribution in bins of 0.2). The first new variant to reach 10 cases per day usually predominates though occasionally subsequent more-transmissible variants will expand and reach predominance (light blue in (ii)). Third-generation new variants become much more common as second-generation variants increase the total number of circulating infections (e.g. many lines in (iv, vi) after day 50). (b) A single example of a simulation with 1000 infected individuals but tracking until 250 000 cumulative infections admits similar kinetics and demonstrates only minor depletion of susceptible individuals.
Figure 6.
Figure 6.
Histograms of Re of invading variants. Given the assumption that 1%, 0.1% and 0.01% of new infections result in transmission of a new variant, we calculated the probability of predominance of new variants with different fitness drawn from an exponential (a), uniform (b) or lognormal (c) distribution. A lower frequency less than 1% of new variant introductions increased the likelihood that the baseline variant with Re = 1 continued to predominate. (d) If the baseline variant had Re = 1.2, it had a much higher chance (approx. 50%) of remaining dominant even with 1% variant generation unless the emerging variants had high transmissibility (i.e. Re > 1.8).

References

    1. Davies NG, et al. 2021. Estimated transmissibility and impact of SARS-CoV-2 lineage B.1.1.7 in England. Science 72, eabg3055. ( 10.1126/science.abg305) - DOI - PMC - PubMed
    1. Davies NG, Jarvis CI, Edmunds WJ, Jewell NP, Diaz-Ordaz K, Keogh RH. 2021. Increased mortality in community-tested cases of SARS-CoV-2 lineage B.1.1.7. Nature 593, 270-274. ( 10.1038/s41586-021-03426-1) - DOI - PMC - PubMed
    1. Sabino EC, et al. 2021. Resurgence of COVID-19 in Manaus, Brazil, despite high seroprevalence. Lancet 397, 452-455. ( 10.1016/S0140-6736(21)00183-5) - DOI - PMC - PubMed
    1. Coutinho RM, et al. 2021. Model-based estimation of transmissibility and reinfection of SARS-CoV-2 P.1 variant. medRxiv 2021.2003.2003.21252706.
    1. Faria NR, et al. 2021. Genomics and epidemiology of the P.1 SARS-CoV-2 lineage in Manaus, Brazil. Science 372, 815-821. ( 10.1126/science.abh2644) - DOI - PMC - PubMed

Publication types

Supplementary concepts