. 2022 Apr 6;7(1):99.
doi: 10.1038/s41392-022-00918-y.

Cannabis suppresses antitumor immunity by inhibiting JAK/STAT signaling in T cells through CNR2

Affiliations

Cannabis suppresses antitumor immunity by inhibiting JAK/STAT signaling in T cells through CNR2

Xinxin Xiong et al. Signal Transduct Target Ther. .

Abstract

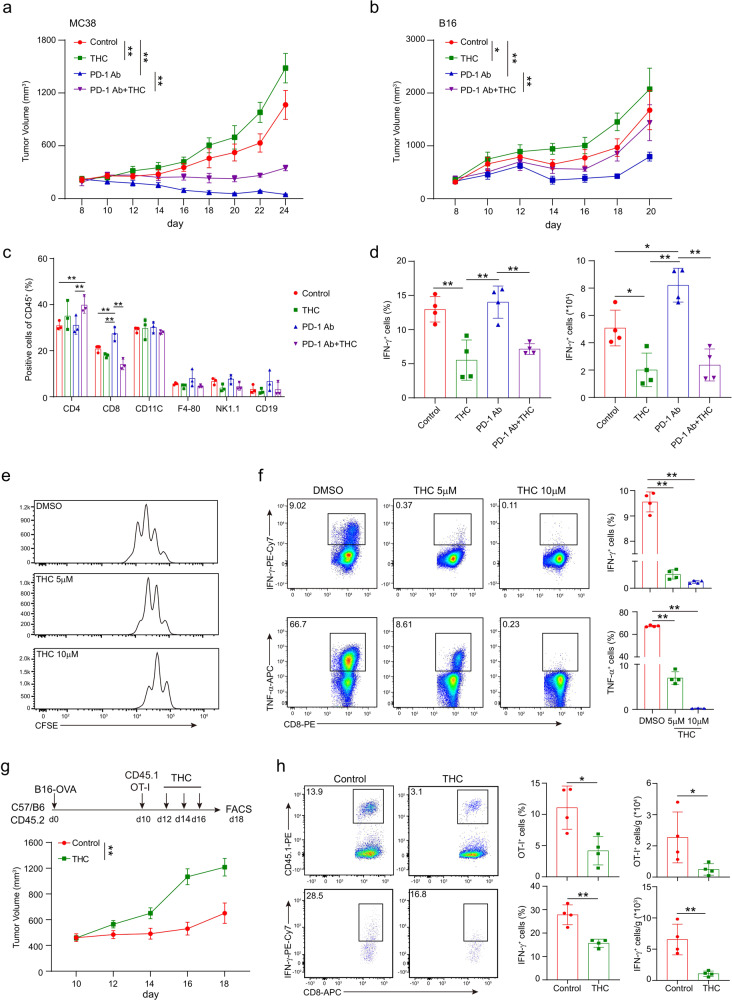
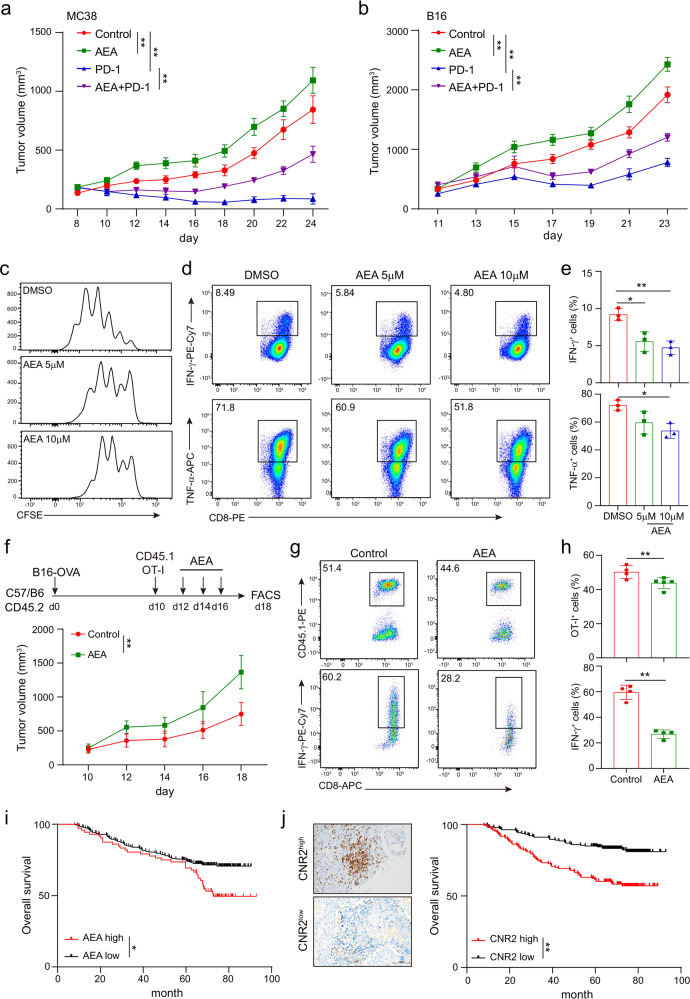
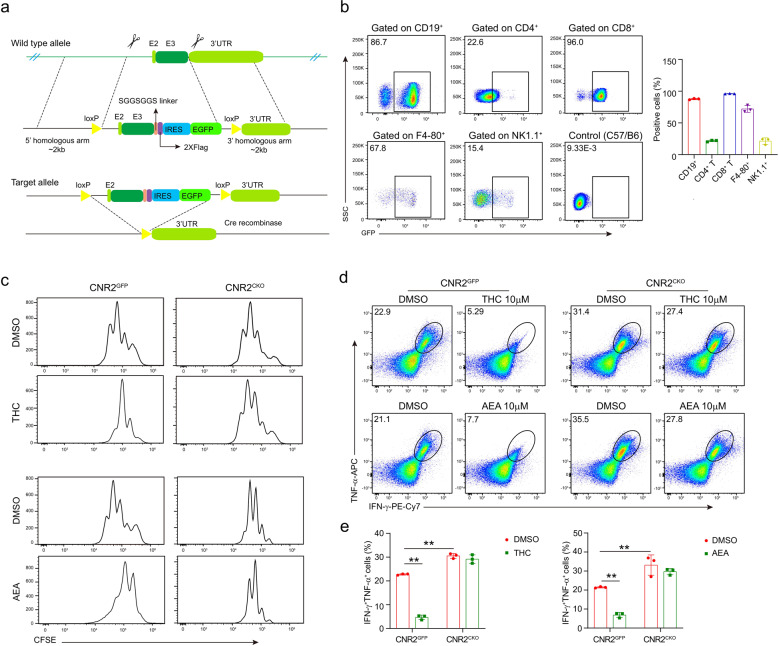
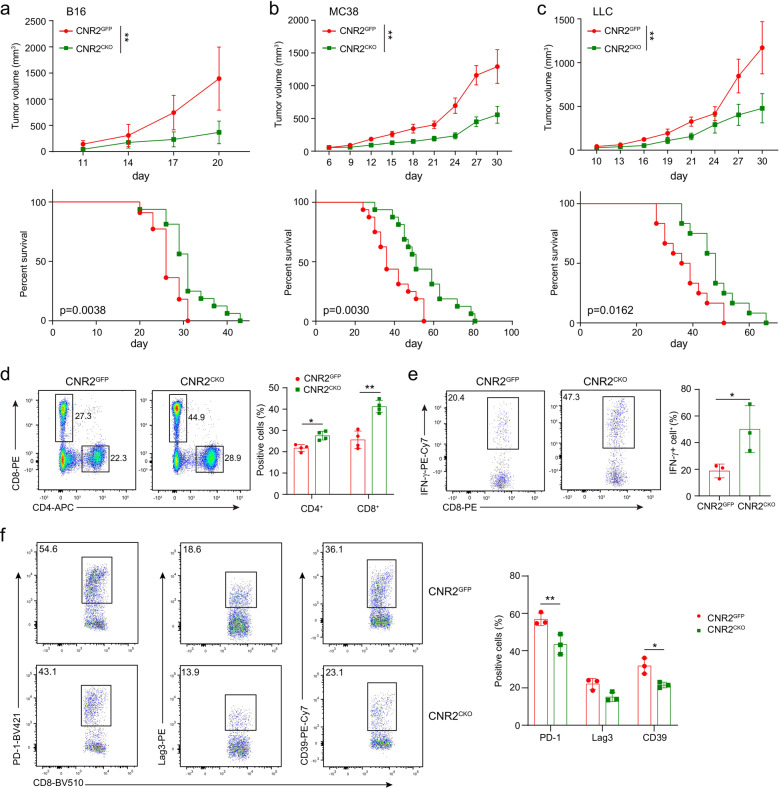
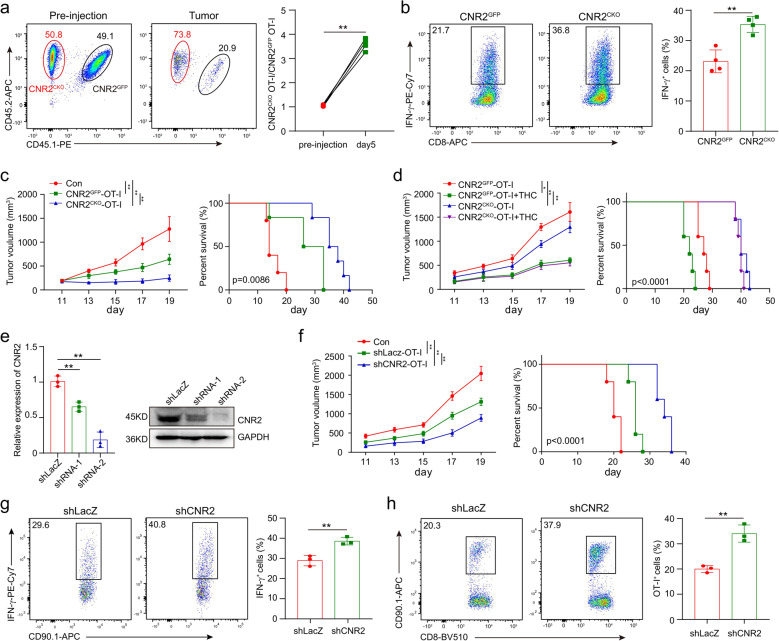
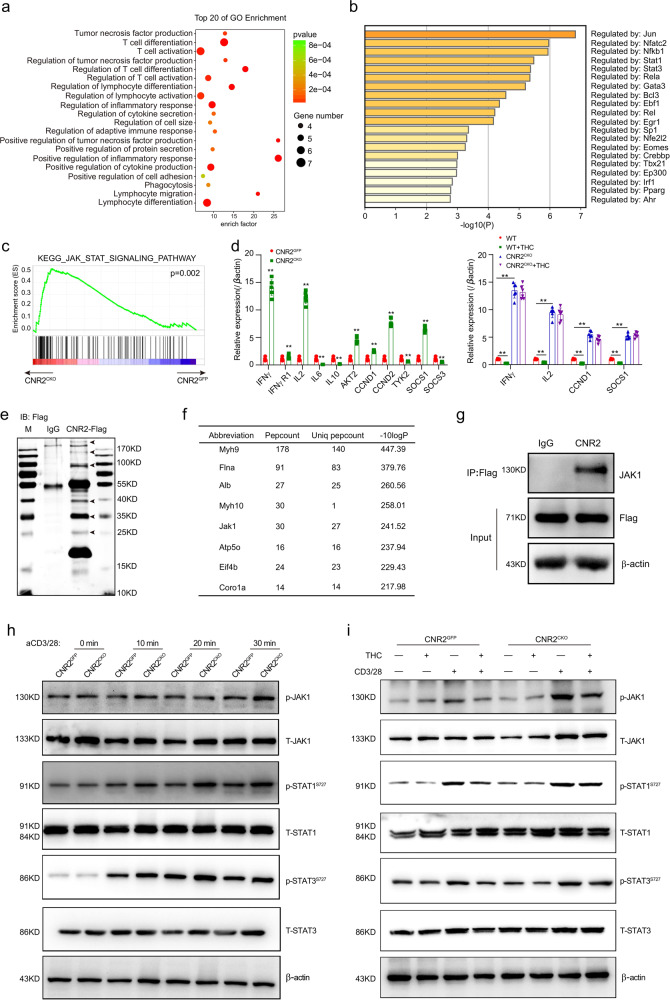
The combination of immune checkpoint blockade (ICB) with chemotherapy significantly improves clinical benefit of cancer treatment. Since chemotherapy is often associated with adverse events, concomitant treatment with drugs managing side effects of chemotherapy is frequently used in the combination therapy. However, whether these ancillary drugs could impede immunotherapy remains unknown. Here, we showed that 9-tetrahydrocannabinol (THC), the key ingredient of drugs approved for the treatment of chemotherapy-caused nausea, reduced the therapeutic effect of PD-1 blockade. The endogenous cannabinoid anandamide (AEA) also impeded antitumor immunity, indicating an immunosuppressive role of the endogenous cannabinoid system (ECS). Consistently, high levels of AEA in the sera were associated with poor overall survival in cancer patients. We further found that cannabinoids impaired the function of tumor-specific T cells through CNR2. Using a knock-in mouse model expressing a FLAG-tagged Cnr2 gene, we discovered that CNR2 binds to JAK1 and inhibits the downstream STAT signaling in T cells. Taken together, our results unveiled a novel mechanism of the ECS-mediated suppression on T-cell immunity against cancer, and suggest that cannabis and cannabinoid drugs should be avoided during immunotherapy.


Conflict of interest statement

The authors declare no competing interests.

Figures

Fig. 1
Fig. 1
THC suppresses T-cell immunity against cancer. Mice bearing MC38 (a) or B16 (b) tumors were treated with DMSO, THC, PD-1 antibody, or THC plus PD-1 antibody on day 10 after tumor inoculation. Tumor volumes were measured every other day (two-way ANOVA, mean ± SEM; *P < 0.05, and **P < 0.01). c The percentages of CD3+ T cells, CD4+ T cells and CD8+ T cells were analyzed by flow cytometry in the B16 tumors on day 17. d The expression of INF-γ in T cells isolated from tumor was detected by intracellular staining after in vitro re-stimulation with PMA and Ionomycin for 4 h. Statistical analysis was performed on biological replicates, ordinary one-way ANOVA, mean ± SD; *P < 0.05, and **P < 0.01. e, f Wild-type CD8+ T cells were pretreated with different concentrations of THC and anti-CD3 (5 μg/ml) plus anti-CD28 (5 μg/ml) simultaneously for 48 h. Proliferation was determined by CFSE dilution assay (e) and the production of IFN-γ and TNF-α was detected by intracellular staining (f). one-way ANOVA, mean ± SD. **P < 0.01. Data are representative of three independent experiments. g, h 6–10 weeks old C57BL/6J mice were subcutaneously engrafted with 105 B16-OVA tumor cells in 200 μl PBS. 10 days later, 1 × 106 OT-I (CD45.1+) T cells were transferred intravenously through tail veins, and THC was intraperitoneally injected on day 12, 14 and 16. Tumor growth was measured every other day (g), and the frequencies and numbers of OT-I T cells and the production of IFN-γ in OT-I T cells after in vitro activation were measured by flow cytometry (h). Two-tailed unpaired Student’s t-test, mean ± SD; *P < 0.05, **P < 0.01. Data are representative of three independent experiments.
Fig. 2
Fig. 2
Endocannabinoid AEA inhibits function and expansion of CD8+ T cells. Mice bearing MC38 (a) or B16 (b) tumors were treated with DMSO, AEA, PD-1 antibody, or AEA plus PD-1 antibody on day 10 after tumor inoculation. Tumor volumes were measured every other day (two-way ANOVA, mean ± SEM, *P < 0.05, and **P < 0.01). Wild-type CD8+ T cells were stimulated with 5 μg/ml plate-bound anti-CD3 and anti-CD28 antibodies, and were incubated with different concentrations of endocannabinoid AEA simultaneously for 48 h. c The proliferation of CD8+ T cells was measured by CFSE dilution. d, e The production of IFN-γ and TNF-α cytokines in CD8+ T cells were detected by intracellular staining (mean ± SD, *P < 0.05, **P < 0.01). Statistical significance was assessed by ordinary one-way ANOVA. Data are representative of three independent experiments. B16-OVA tumors were established subcutaneously in 6–10 weeks old C57BL/6J mice 10 days before adoptive cell transfer of 1× 106 OT-I T cells (CD45.1+) and AEA was intraperitoneally injected on day 12, 14, and 16. f Tumors were measured every 2 days and the volume was calculated. Data in bar graphs represent mean ± SEM, three independent experiments were performed. g, h The frequencies and numbers of OT-I T cells in tumors and the production of IFN-γ in OT-I T cells from tumor after in vitro activation with PMA and Ionomycin were shown. i Kaplan–Meier estimates of overall survival comparing high to low levels of AEA in serum of lung cancer patients measured by ELISA. Data are shown as mean ± SEM; log-rank test. j Representative IHC images of CNR2high and CNR2low tumor sections stained with CNR2 (left). Scale bars correspond to 100 μm. Kaplan–Meier estimates of patients’ overall survival comparing high to low expression of CNR2 (right). Statistical significance was assessed by the log-rank (Mantel–Cox) test of survival curve.
Fig. 3
Fig. 3
Cannabinoids impair T-cell-mediated antitumor immunity through CNR2. a Schematic diagram depicting the strategy used to generate Cnr2 condition knockout (Cnr2CKO, CNR2flox/floxCD4cre) mice (E: exon). LoxP sites flanking exon 2 of Cnr2 are indicated. Cnr2-2xFlag-IRES-Egfpflox/flox mice (Cnr2GFP) were crossed with CD4cre mice to delete the second exon of Cnr2. b Flow cytometry analysis of CNR2 expression from CNR2-GFP reporter mice in immune cell subsets, showing B cell (CD45+CD3CD19+), T-cell (CD45+CD3+CD4+/CD8+), macrophage (CD45+CD3-F4-80+) and NK cell (CD45+CD3NK1.1+). Cells from wild-type C57BL/6J mice were served as the negative control. Cnr2GFP and Cnr2CKO CD8+ T cells were treated with AEA or THC and stimulated by anti-CD3 plus anti-CD28 for 48 h. DMSO was used as the negative control. c Proliferation of CD8+ T cells was determined by CFSE dilution assay. d, e The production of IFN-γ and TNF-α in Cnr2GFP and Cnr2CKO CD8+ T cells were measured by intracellular staining (two-way ANOVA, mean ± SD, **P < 0.01).
Fig. 4
Fig. 4
CNR2 facilitates tumor development by suppressing immune response. Tumor growth and survival were assessed in B16 (a), MC38 (b) and LLC (c) models in Cnr2GFP and Cnr2CKO mice. Data are representative of three independent experiments. Statistical significance was assessed by ordinary one-way ANOVA or log-rank (Mantel–Cox) test of survival curve, mean ± SEM. **P < 0.01. d Flow cytometric analysis of CD4+ and CD8+ T cells of Cnr2GFP and Cnr2CKO mice bearing B16 tumor. e The production of IFN‐γ in CD8+ T cells from B16 tumors was assessed by flow cytometric analysis. Data are representative of three independent experiments. Statistical significance was assessed by two-way ANOVA (d) or two-tailed unpaired Student’s t-test (e), mean ± SD, *P < 0.05, **P < 0.01. f Flow cytometry (left) and quantification (right) of PD-1, LAG3, and CD39 positive cells in Cnr2GFP and Cnr2CKO OT-I cells from B16-OVA tumors. Two-tailed unpaired Student’s t-test, mean ± SD, *P < 0.05, **P < 0.01.
Fig. 5
Fig. 5
Cnr2 deficiency promotes T-cell-mediated antitumor immunity. a Cnr2GFP (CD45.1+ CD45.2+) and Cnr2CKO (CD45.2+) OT-I CD8+ T cells were 1:1 mixed and intravenously injected into mice (CD45.1+) with B16-OVA tumor. Flow cytometric analysis shows the frequencies of Cnr2GFP and Cnr2CKO OT-I T cells from TILs in tumors (left). The representative ratio of wild-type to Cnr2CKO OT-I T cells in the tumor were evaluated on day 5 (right). b Flow cytometry analysis of the production of IFN‐γ in Cnr2GFP and Cnr2CKO OT-I T cells isolated from tumors stimulated with PMA and Ionomycin in vitro. Data are representative of three independent experiments. Statistical significance was assessed by two-tailed unpaired Student’s t-test, mean ± SD. *P < 0.05 and **P < 0.01. c Mice bearing B16-OVA tumors were treated with 1 × 106 Cnr2GFP or Cnr2CKO OT-I T cells. PBS was used as control. Tumor volume was measured every other day (mean ± SEM, **P < 0.01) (Left). The survival curves of the three groups were compared (right). Statistical significance was assessed by the two-way ANOVA (left), or log-rank (Mantel–Cox) test of survival curve (right). d Mice bearing B16-OVA tumors were treated with 1 × 106 Cnr2GFP, Cnr2CKO OT-I T cells, Cnr2GFP OT-I T cells plus THC and Cnr2CKO OT-I T cells plus THC. Tumor volume were measured every other day (mean ± SEM, **P < 0.01) (left). The survival curves of the three groups were compared (right). Statistical significance was assessed by the two-way ANOVA (left), or log-rank (Mantel–Cox) test of survival curve (right). e T cells were transduced for 48 h by lentivirus and positive cells were sorted by flow cytometry. The expression of CNR2 was validated by qPCR and Western blotting. f Mice bearing B16-OVA tumors were treated with 1 × 106 shLacZ or shCnr2 OT-I T cells. PBS was used as control. Tumor volume was measured every other day (mean ± SEM, **P < 0.01). The survival curves of the three groups were compared. Statistical significance was assessed by the two-way ANOVA, or log-rank (Mantel–Cox) test of survival curve. g The frequencies of OT-I T cells in tumors were shown. h Flow cytometry analysis of the production of IFN-γ in shLacZ and shCnr2 OT-I T cells isolated from tumors stimulated with PMA and Ionomycin in vitro. Statistical significance was assessed by two-tailed unpaired Student’s t-test, mean ± SD, **P < 0.01.
Fig. 6
Fig. 6. CNR2 binds to JAK1 and inhibits the STATs signaling.
CNR2 binds to JAK1 and inhibits the STATs signaling. a, b Gene Ontology (GO) category analysis and Heatmap GO analysis of RNA-seq data of Cnr2CKO and Cnr2GFP CD8+ T cells treated with anti-CD3 plus (5 μg/ml) anti-CD28 (5 μg/ml) for 24 h by using Metascape website (http://metascape.org). c GSEA analysis of the differentially expressed genes (RNA-seq datasets) of the JAK-STAT signaling pathway in Cnr2-deficient CD8+ T cells versus wild-type CD8+ T cells. d qPCR validation of the expression of genes downstream JAK-STAT signaling pathway in Cnr2-deficient and wild-type CD8+ T cells (Left), and in THC-treated Cnr2-deficient and wild-type CD8+ T cells (Right). Data are presented as the mean ± SD. of three biological replicates. **P < 0.01. e Mass spectrum analysis of CNR2 associated proteins in CD8+ T cells from Cnr2-2xFlag-IRES-Egfpflox/flox reporter mice after Flag pull-down assay. Six protein bands detected by silver-staining in the FLAG group but not in the IgG group were cut and performed mass spectrum analysis. f The top ten identified peptides were shown in the list. g Cnr2-2xFlag-IRES-Egfpflox/flox CD8+ T cells were treated with THC or DMSO as a control for 24 h. Cell lysates were then immunoprecipitated with Flag antibody and analyzed by immunoblot with anti-JAK1 and anti-Flag. h Cnr2GFP and Cnr2CKO CD8+ T cells were stimulated with anti-CD3 plus anti-CD28 for 10–30 min. Cell lysates were analyzed by immunoblot with anti-phosphorylated JAK1, anti-phosphorylated STAT1, anti-phosphorylated STAT3, anti-total STAT1, and anti-total STAT3. i Cnr2GFP and Cnr2CKO CD8+ T cells were pretreated with THC or DMSO for 24 h and then stimulated by anti-CD3 plus anti-CD28 for 30 min. Cell lysates were analyzed by immunoblot with anti-phosphorylated JAK1, anti-phosphorylated STAT1, anti-phosphorylated STAT3, anti-total STAT1, and anti-total STAT3.

References

    1. Pardoll DM. The blockade of immune checkpoints in cancer immunotherapy. Nat. Rev. Cancer. 2012;12:252–264. doi: 10.1038/nrc3239. - DOI - PMC - PubMed
    1. Topalian SL, Taube JM, Anders RA, Pardoll DM. Mechanism-driven biomarkers to guide immune checkpoint blockade in cancer therapy. Nat. Rev. Cancer. 2016;16:275–287. doi: 10.1038/nrc.2016.36. - DOI - PMC - PubMed
    1. Postow MA, Sidlow R, Hellmann MD. Immune-related adverse events associated with immune checkpoint blockade. N. Engl. J. Med. 2018;378:158–168. doi: 10.1056/NEJMra1703481. - DOI - PubMed
    1. Minn AJ, Wherry EJ. Combination cancer therapies with immune checkpoint blockade: convergence on interferon signaling. Cell. 2016;165:272–275. doi: 10.1016/j.cell.2016.03.031. - DOI - PubMed
    1. Xin YuJ, et al. Trends in clinical development for PD-1/PD-L1 inhibitors. Nat. Rev. Drug Discov. 2020;19:163–164. doi: 10.1038/d41573-019-00182-w. - DOI - PubMed

Publication types