. 2022 Apr 5;13(1):1822.
doi: 10.1038/s41467-022-29280-x.

Gain-of-function and loss-of-function GABRB3 variants lead to distinct clinical phenotypes in patients with developmental and epileptic encephalopathies

Affiliations

Gain-of-function and loss-of-function GABRB3 variants lead to distinct clinical phenotypes in patients with developmental and epileptic encephalopathies

Nathan L Absalom et al. Nat Commun. .

Abstract

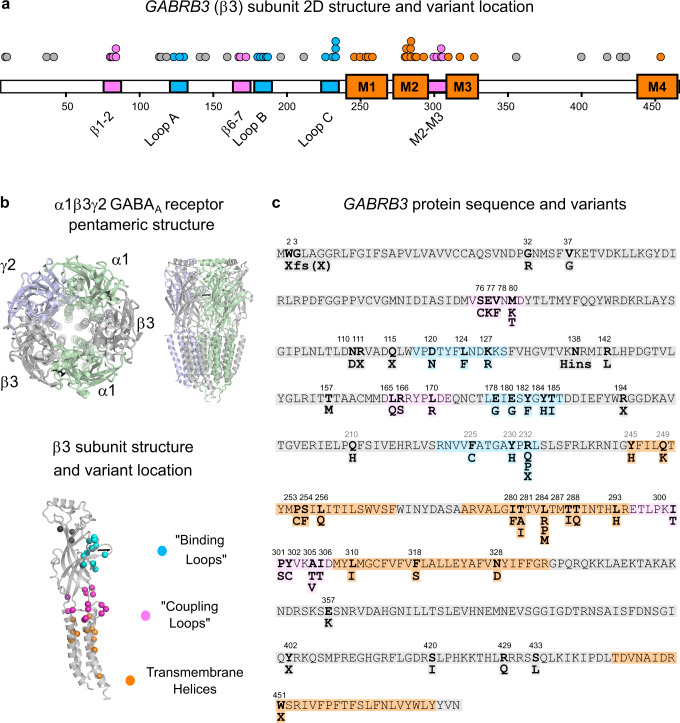
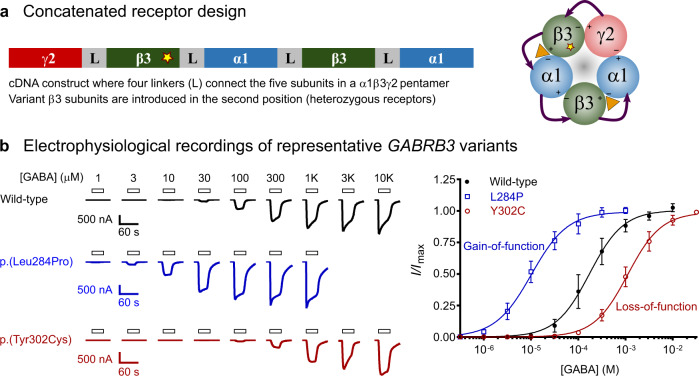
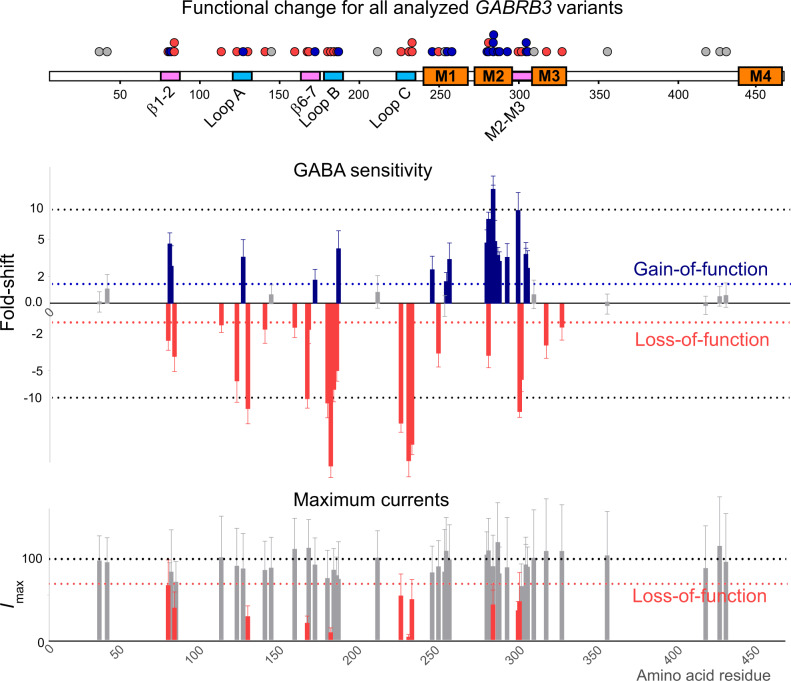
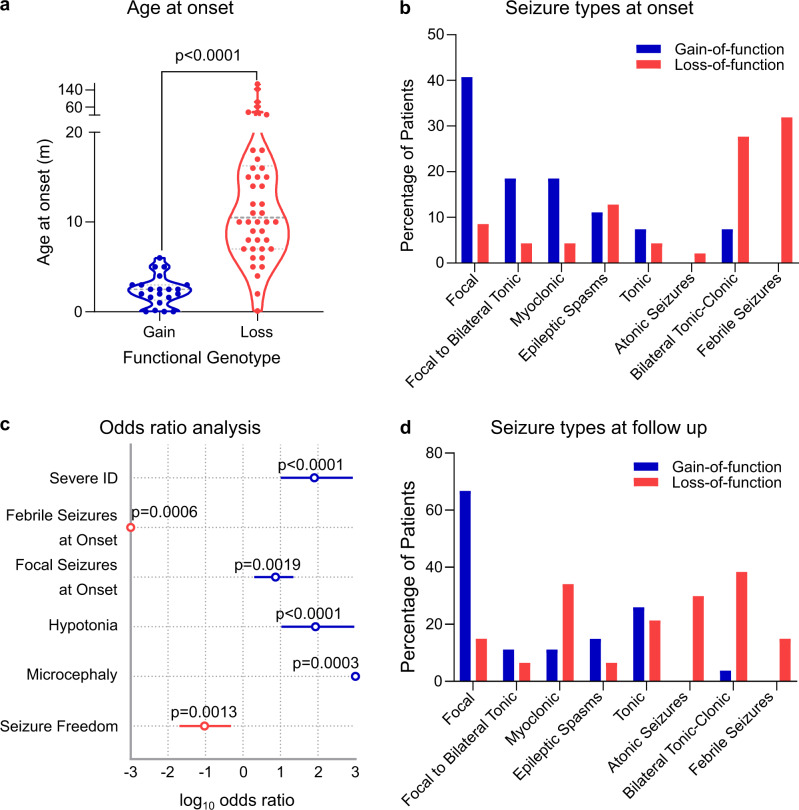
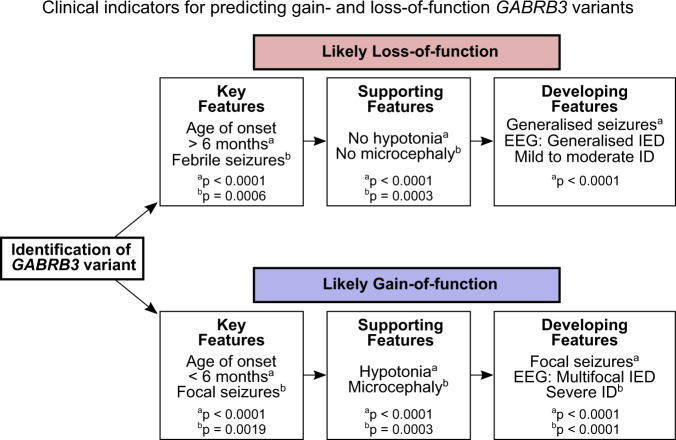
Many patients with developmental and epileptic encephalopathies present with variants in genes coding for GABAA receptors. These variants are presumed to cause loss-of-function receptors leading to reduced neuronal GABAergic activity. Yet, patients with GABAA receptor variants have diverse clinical phenotypes and many are refractory to treatment despite the availability of drugs that enhance GABAergic activity. Here we show that 44 pathogenic GABRB3 missense variants segregate into gain-of-function and loss-of-function groups and respective patients display distinct clinical phenotypes. The gain-of-function cohort (n = 27 patients) presented with a younger age of seizure onset, higher risk of severe intellectual disability, focal seizures at onset, hypotonia, and lower likelihood of seizure freedom in response to treatment. Febrile seizures at onset are exclusive to the loss-of-function cohort (n = 47 patients). Overall, patients with GABRB3 variants that increase GABAergic activity have more severe developmental and epileptic encephalopathies. This paradoxical finding challenges our current understanding of the GABAergic system in epilepsy and how patients should be treated.


Conflict of interest statement

The authors declare no competing interests.

Figures

Fig. 1
Fig. 1. GABRB3 epilepsy-associated variants.
a Two-dimensional representation (top) of a GABAA receptor β3 subunit (pdb:6hup) highlighting binding loops (blue), coupling loops (pink) and four transmembrane regions (orange). Dots represent individual variants associated with DEE. b 3D cartoon structure of the pentameric α1β3γ2 GABAA receptor from above and the side. α1 (pale green) β3 (silver) and γ2 (light purple) subunits are colour coded and the GABA molecule is represented as black sticks. A 3D cartoon structure of a β3 subunit showing the location of variants as spheres coloured by their location in the binding loops (blue), coupling loops (pink), transmembrane regions (orange) or elsewhere (dark grey). c The GABRB3 sequence is shown with missense amino acid variants numbered and in bold. Structural features of the binding, coupling loops and transmembrane regions are coloured.
Fig. 2
Fig. 2. Functional evaluation of GABRB3 missense variants.
a Concatenated receptor design showing the γ2-β3-α1-β3-α1 DNA construct used to introduce single missense variants. A pentameric receptor that arranges with a single β3 variant (star) is depicted. b Raw electrophysiological recordings and concentration–response curves at selected concatenated γ2-β3-α1-β3-α1 wild-type (black), p.(Leu284Pro) (blue) and p.(Tyr302Cys) (red) β3 variant receptors that represent a gain-of-function and a loss-of-function variant, respectively. Bars indicate GABA applications and scale bars for each trace are shown. Peak current amplitudes were measured at each GABA concentration and a Hill equation was fitted to the data. Thereafter the dataset was normalized to its respective maximum current amplitude for each cell. Black circles (wild-type, n = 12 independent cells), blue open squares (p.(Leu284Pro), n = 12) and red open circles (p.(Tyr302Cys), n = 12) represent the mean ± s.d (n ≥ 12) and the lines represent the fitted Hill equation at each receptor. Gain-of-function variants shift the concentration–response curve to the left, loss-of-function to the right. Source data are provided in the Source Data file.
Fig. 3
Fig. 3. Changes in GABA sensitivity and maximum currents of GABRB3 missense variants.
A two-dimensional representation (top) of a GABAA receptor β3 subunit depicting binding loops (blue), coupling loops (pink) and four transmembrane regions (orange) is shown. Bar graph summarizing the fold-shift in GABA sensitivity (mean ΔlogEC50 ± s.d.) and maximum current (mean Imax ± s.d.) for each variant according to their amino acid residue. At GABA sensitivity, blue bars indicate variants that have significantly increased the GABA sensitivity with the direction of the bars upwards, red bars indicate variants that have significantly decreased the GABA sensitivity with the direction of the bars downwards and grey bars indicate no significant change. Significance was determined by one-way ANOVA (F (53, 725) = 355.5) and multiple comparisons with corrected Dunnett’s post-hoc test (p < 0.0001, n = 135 independent cells (wild-type); 10 (G32R, M80T, R142L, A305T, A305V, I306T); 11 (E77K, M80K, D120N, T157M, Y182F, Y184H, Q249K, S254F, L256Q, T281I, L284M, T287I, T288N, L293H, P301L); 12 (S76C, V78F, L124F, L170R, E180G, F225C, Y230H, Y245H, P253L, I280F, L284R, L284P, Y302C, F318S, N328D, E357K, S420I, R429Q, S433L); 13 (E178G, T185I); 14 (K127R, L165Q, Q210H, R232Q, T281A); 15 (V37G, N110D, ins138_139H, R166S, I300T); 17 (L310I). At maximum current, grey bars indicate no significant change and red bars indicate significantly reduced maximum currents. Significance was determined by one-way Kruskal–Willis ANOVA (H(55, 1653) = 674.4) and multiple comparisons with corrected Dunn’s post-hoc test (p < 0.0001, n = 256 independent cells (wild-type); 22 (R232P, L284R, I300T, Y302); 23 (D120N, L124F, L284, P301L, A305T); 24 (E77K, V78F, M80K, K127R, L165Q, Q210H, R232Q, Y245H, P253L, S254F, L256Q, I280F, T281A, T281I, L284M, T287I, T288N, L293H, A305V, I306T); 26 (M80T, Y184H, Q249K); 27 (G32R, S76C, R142L, L170R, E180G, Y182F); 28 (L310I); 29 (F318S, E357K, R429Q, S433L); 30 (ins138_139H, Q210H); 33 (V37G), p.(R166S); 36 (S420Ile); 39 (N328D). Individual data points are in the supplementary information (Supplementary Fig S2). Source data are provided in the Source Data file.
Fig. 4
Fig. 4. Clinical features of patients harbouring a LOF or GOF GABRB3 variant.
a Violin plot of age of seizure onset at gain-of-function (blue; n = 21 patients) and loss-of-function (red; n = 43 patients) variants. Dots represent individual data points, dotted lines represent median and quartiles. Two-sided unpaired Mann–Whitney U test, p = 1.1 × 10⁻¹¹, U = 39). b Selected seizure types reported at onset for patients with gain-of-function (blue bars) and loss-of-function (red bars) variants. Percentage of patients reporting each seizure type is shown. c Odds ratio of key clinical outcomes in gain-of-function vs. loss-of-function variants with the centre circle showing the log10 odds ratio and 95 % confidence interval. Blue indicates significant enrichment in gain-of-function variants, and red indicates significant enrichment in the loss-of-function variants. For each indication, the total number of patients reporting were n = 18, 27, 27, 16, 11 and 19 gain-of-function patients, and n = 40, 47, 47, 27, 24 and 36 loss-of-function patients for severe intellectual disability, febrile seizures, focal seizures, hypotonia, microcephaly and seizure freedom, respectively. Fisher’s exact test, two-sided, p = 2.7 × 10⁻⁸, 2 × 10⁻⁵, 0.019, 3.5 × 10⁻⁷, 3 × 10⁻⁴ and 0.013, respectively. d Selected seizure types reported at follow-up for patients with a gain-of-function (blue bars) and loss-of-function (red bars) variants. Percentage of patients reporting each seizure type is shown. Source data are provided in the supplementary information (Supplementary Table S1).
Fig. 5
Fig. 5. Representative electroencepholagram from patients harbouring a GOF or LOF variant.
Interictal EEG showed a disorganized background activity with intermixed 12–15 Hz component (blue boxes) and multifocal epileptiform abnormalities (red circles) in patients with gain-of-function variants and normal/slightly delayed background activity, with generalized high amplitude 3–4 Hz activity/spike and slow waves (dotted lines) in patients with loss-of-function variants.
Fig. 6
Fig. 6. 2D structural map of pathogenic and benign missense GABRB3 variants.
a, b Two-dimensional representation of a GABAA receptor β3 subunit depicting binding loops (blue), coupling loops (pink) and four transmembrane regions (orange) is shown with a row of black dots indicating the location of benign variants in the gnomAD database. The upper row of dots indicates pathogenic or likely pathogenic GOF (blue), LOF (red) variants, benign or likely benign (grey) variants and VUS (white) variants. Source data are provided in the Source Data file.
Fig. 7
Fig. 7. 3D structural map and concentration–response curves.
3D structure of GABAA receptor β3 subunit displaying the location of: gain-of-function (blue), loss-of-function (red) and dual (purple) variants, with the variants showing no functional change in grey. ae Structure of the β3 subunit with the backbone coloured in grey and a close-up view of residues a directly binding GABA; b in the outer shell of GABA binding; c β1-2 coupling loop; d M2-M3 coupling loop and e M2 region with amino acid sidechains of residues containing variants in sticks. Red indicates loss-of-function, blue indicates gain-of-function variants and GABA is in black. Concentration–response curves for variants directly binding GABA. Dots represent mean ± s.d. and lines the fitted Hill equation. Wild-type concentration–response curves run on the same days as the variants are shown in black. Red indicates loss-of-function and blue indicates gain. For each panel, a n = 35, 12, 11, 12, 12 independent experiments at wild-type, E180G, Y182F, F225C, Y230H; b n = 34, 11, 12, 14, 13, 11, 13, 14 at wild-type, D120N, L124F, K127R, E178G, Y184H, T185I, R232Q; c n = 34, 12, 11, 12, 11, 10 at wild-type, S76C, E77K, V78F, M80K, M80T; d n = 36, 15, 11, 12, 10, 10, 24 at wild-type, I300T, P301L, Y302C, A305T, A305V, I306T; e n = 57, 12, 14, 11, 11, 12, 12, 11, 11, 11 at wild-type, I280F, T281A, T281I, L284M, L284P, L284R, T287I, T288N, L293H. Source data are provided in the Source Data file.
Fig. 8
Fig. 8. Flowchart for predicting LOF and GOF GABRB3 variants based on clinical indicators.
When a GABRB3 missense variant is identified, there are several clinical features that can help predict whether the variant is LOF or GOF. Key features of LOF variants include an age of onset of 6 months or older and the presence of febrile seizures. Supporting features include a lack of hypotonia and microcephaly. As patients develop, LOF variants typically result in generalised seizures (includes atonic, myoclonic and bilateral tonic-to-clonic seizures), EEG with generalised interictal epileptiform discharges (IEDs) and ID in the normal or mild to moderate spectrum. For GOF variants, key features are focal seizures that present at an age of onset less than 6 months, and supporting features include hypotonia and microcephaly. As the patient ages, GOF variants feature focal seizures, EEG with multifocal interictal epileptiform discharges, and severe ID. If the patient presentation has a mixture of these indications, functional testing of the variant is needed to determine whether it has LOF or GOF traits. p-values comparing the clinical indicators for patients with LOF and GOF variants are included (also see Fig. 4).

Comment in

References

    1. Heyne HO, et al. De novo variants in neurodevelopmental disorders with epilepsy. Nat. Genet. 2018;50:1048–1053. - PubMed
    1. Hernandez CC, Macdonald RL. A structural look at GABAA receptor mutations linked to epilepsy syndromes. Brain Res. 2019;1714:234–247. - PubMed
    1. Maljevic S, et al. Spectrum of GABAA receptor variants in epilepsy. Curr. Opin. Neurol. 2019;32:183–190. - PubMed
    1. Moller RS, et al. Mutations in GABRB3: From febrile seizures to epileptic encephalopathies. Neurology. 2017;88:483–492. - PMC - PubMed
    1. Myers KA, et al. Contribution of rare genetic variants to drug response in absence epilepsy. Epilepsy Res. 2021;170:106537. - PubMed