. 2022 Apr 5;13(1):1761.
doi: 10.1038/s41467-022-29289-2.

Global field observations of tree die-off reveal hotter-drought fingerprint for Earth's forests

Affiliations

Global field observations of tree die-off reveal hotter-drought fingerprint for Earth's forests

William M Hammond et al. Nat Commun. .

Abstract

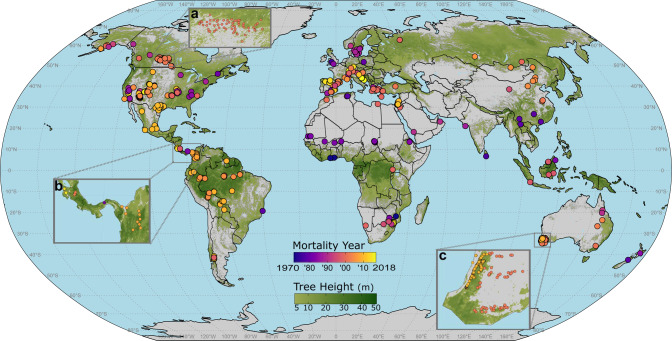
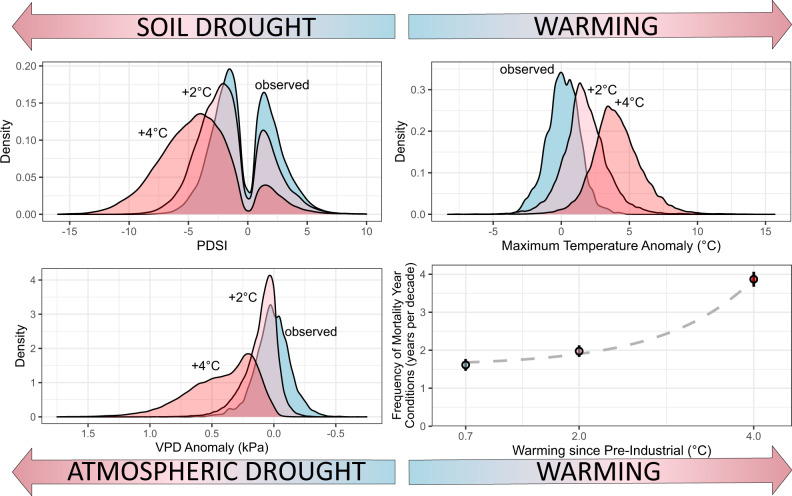
Earth's forests face grave challenges in the Anthropocene, including hotter droughts increasingly associated with widespread forest die-off events. But despite the vital importance of forests to global ecosystem services, their fates in a warming world remain highly uncertain. Lacking is quantitative determination of commonality in climate anomalies associated with pulses of tree mortality-from published, field-documented mortality events-required for understanding the role of extreme climate events in overall global tree die-off patterns. Here we established a geo-referenced global database documenting climate-induced mortality events spanning all tree-supporting biomes and continents, from 154 peer-reviewed studies since 1970. Our analysis quantifies a global "hotter-drought fingerprint" from these tree-mortality sites-effectively a hotter and drier climate signal for tree mortality-across 675 locations encompassing 1,303 plots. Frequency of these observed mortality-year climate conditions strongly increases nonlinearly under projected warming. Our database also provides initial footing for further community-developed, quantitative, ground-based monitoring of global tree mortality.


Conflict of interest statement

The authors declare no competing interests.

Figures

Fig. 1
Fig. 1. Global distribution of hotter-drought tree mortality plots.
Geo-referenced tree mortality plots (n = 1303) in the database. Dots are color coded according to the year of mortality. Each point has been precisely georeferenced. Insets show examples of dense plot networks in Canada, Central America, and Southwest Australia. To illustrate the extent of global forests, a background layer in green shows canopy height, with darker green shading indicating taller forests. Inset a shows a broad plot network from aspen die-off during drought in Canada. Inset b shows dense plot networks in Costa Rica, Panama, and Colombia. Inset c shows plots in the Jarrah and Wandoo forests of Southwest Australia.
Fig. 2
Fig. 2. Biomes of global tree mortality plots.
Whittaker biome plot of database locations, showing the mean annual temperature (°C) and mean annual precipitation (cm) for all 1303 database plots. Each point represents a plot from the global database where climate-induced tree mortality happened. These mortality locations have occurred in all forested biomes, across a range of 30 °C of mean annual temperatures, and a four-meter annual precipitation gradient. Point color represents elevation, which ranged from sea level to 3488 m. Climate data for mean annual precipitation and mean annual temperature are taken from TerraClimate and represent the average over 1970–2000. These data illustrate that whether a site is typically cool, warm, dry, or wet—eventually, a locally extreme hot drought can lead to tree mortality.
Fig. 3
Fig. 3. Hotter-drought fingerprint of global tree mortality.
The z-scores of climate variables during climatological warmest/driest months for the 4 years preceding, 4 years following, and during the onset of tree mortality events. For each variable, circles indicate the mean z-score of all sites (n = 675), while whiskers represent the 95% confidence interval of that mean. Panels are arranged chronologically from left to right, top to bottom, from 4 years before mortality began through 4 years after. During the year of onset of mortality, a hotter-drought fingerprint on forest mortality events was revealed as the mean of plot z-scores for all climate variables significantly shifted toward values characteristic of warmer and drier conditions, with the year prior and the year following mortality showing similar, but weaker, tendencies (this 3-year window, centered on the year mortality began, is outlined in red). The z-scores for TMAX, VPD, and CWD are shown with their original sign, while the sign of z-scores for PPT, SOIL M, and PDSI were flipped such that positive indicates warm/dry, and negative indicates cool/wet across all variables. Point color represents the variable condition relative to long-term (1958–2019) climate: white indicates no difference, blue is significantly wetter/cooler, and red is significantly warmer/drier.
Fig. 4
Fig. 4. Hotter-drought fingerprint by Whittaker biome type.
The 3-year window, centered on the mortality start year, is displayed for each biome. Above each biome triptych the number of sites included is listed (Woodland/Shrubland n = 355, Temperate Seasonal Forest n = 99, Tropical Seasonal Forest/Savanna n = 81, Subtropical Desert n = 64, Temperate Grassland n = 53, Tropical Rain Forest n = 19, and Boreal Forest n = 18). Points represent the mean z-score for each variable, and whiskers are the 95% confidence interval in that mean. Strong signals appear in woodland/shrubland, temperate grassland/desert, both temperate seasonal forests, and tropical seasonal forests/savannas, and even boreal forests (with a small sample) show significant indicators of hotter drought. Tropical rainforests do not show this particular hotter-drought signal in our present analyses—highlighting that a combination of data scarcity and diverse responses of various forest types in the tropics will need further investigation, as outlined in point (5) of the future research opportunities listed in the main text.
Fig. 5
Fig. 5. Mortality year TMAX warming faster than all years.
Linear regressions showing the trend of TMAX anomalies during the typically warmest month across all years (1970–2018, blue trend line is model fit of the linear regression) and mortality event years in the database (red trend line is model fit of the linear regression, as in Supplementary Fig. S7A). Blue dots show the mean values for TMAX anomaly during the typically warmest month, for all years at all sites, and the faded gray dots the raw data. Black open circles indicate mortality year TMAX anomalies for each site. For both regressions, gray shading represents the standard error of model fit. TMAX Anomalies are increasing faster during mortality event years (red line), than during the chronic background warming illustrated by the all-years, all-sites regression (blue line).
Fig. 6
Fig. 6. Warming triple-threat accelerates mortality risks.
Under two warming scenarios, leading indicators of tree mortality representing the triple-threat that warming poses to tree survival at the plots in our analysis departed from recent values toward drier (PDSI (a), VPD (c)) and warmer (TMAX values, b) indicating further warming will shift climatic space toward that recently associated with mortality events. In ac, the density distributions of PDSI, TMAX, and VPD during observed (+0.7 °C, light blue) and warmed +2 °C (pink) and +4 °C (red) climate scenarios are shown. In d, open circles show the mean (n = 675 sites) frequency of mortality year hotter-drought fingerprint conditions (when for a particular location, all 6 monthly variables met or exceeded the local hotter-drought fingerprint conditions of the mortality year), while the x-axis represents the mean warming since pre-industrial (1850–1879) climate. Error bars represent 95% confidence interval and the dashed gray line is an exponential fit.

References

    1. IPCC. Climate Change 2014: Impacts, Adaptation, and Vulnerability. Part A: Global and Sectoral Aspects. Contribution of Working Group II to the Fifth Assessment Report of the Intergovernmental Panel on Climate Change (eds Field, C. B. et al.) (Cambridge University Press, 2014).
    1. Beech E, Rivers M, Oldfield S, Smith PP. GlobalTreeSearch: the first complete global database of tree species and country distributions. J. Sustain. Forestry. 2017;36:454–489.
    1. Pan Y, et al. A large and persistent carbon sink in the world’s forests. Science. 2011;333:988–993. - PubMed
    1. Mcdowell NG, et al. Pervasive shifts in forest dynamics in a changing world. Science. 2020;368:eaaz9463. - PubMed
    1. Lindenmayer DB, Laurance WF. The ecology, distribution, conservation and management of large old trees: ecology and management of large old trees. Biol. Rev. 2017;92:1434–1458. - PubMed

Publication types