. 2022 Apr 5;13(1):1823.
doi: 10.1038/s41467-022-29341-1.

ACKR3 regulates platelet activation and ischemia-reperfusion tissue injury

Affiliations

ACKR3 regulates platelet activation and ischemia-reperfusion tissue injury

Anne-Katrin Rohlfing et al. Nat Commun. .

Abstract

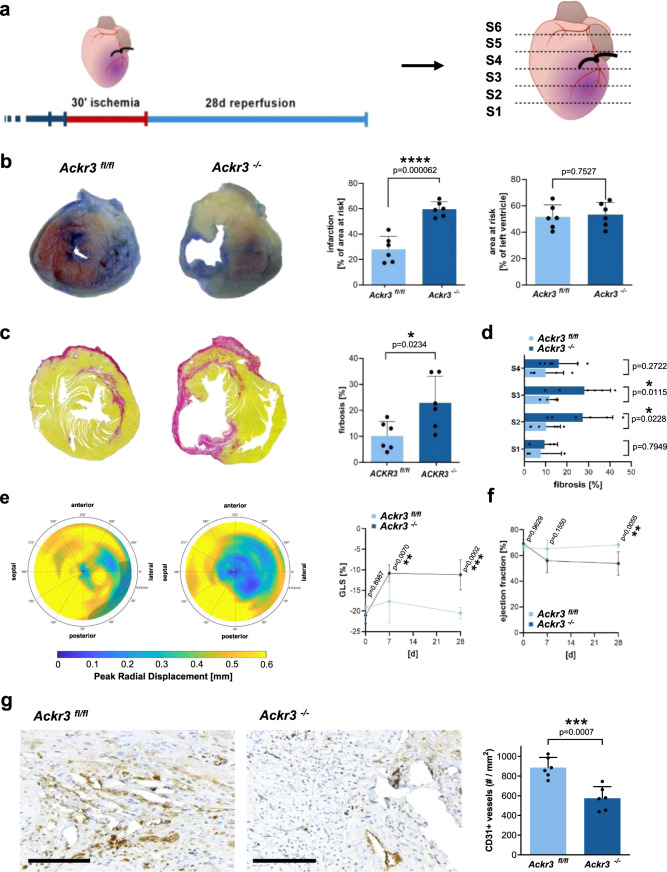
Platelet activation plays a critical role in thrombosis. Inhibition of platelet activation is a cornerstone in treatment of acute organ ischemia. Platelet ACKR3 surface expression is independently associated with all-cause mortality in CAD patients. In a novel genetic mouse strain, we show that megakaryocyte/platelet-specific deletion of ACKR3 results in enhanced platelet activation and thrombosis in vitro and in vivo. Further, we performed ischemia/reperfusion experiments (transient LAD-ligation and tMCAO) in mice to assess the impact of genetic ACKR3 deficiency in platelets on tissue injury in ischemic myocardium and brain. Loss of platelet ACKR3 enhances tissue injury in ischemic myocardium and brain and aggravates tissue inflammation. Activation of platelet-ACKR3 via specific ACKR3 agonists inhibits platelet activation and thrombus formation and attenuates tissue injury in ischemic myocardium and brain. Here we demonstrate that ACKR3 is a critical regulator of platelet activation, thrombus formation and organ injury following ischemia/reperfusion.


Conflict of interest statement

The authors declare no competing interests.

Figures

Fig. 1
Fig. 1. Platelet surface expression of ACKR3 and clinical prognosis.
a Kaplan–Meier curves showing all-cause mortality stratified according to low (1st tertile) vs high (2nd and 3rd tertile) platelet ACKR3 surface exposure levels in patients with symptomatic CAD (n = 320). b Bar diagrams showing all-cause mortality stratified according to low (1st tertile) vs high (2nd and 3rd tertile) platelet ACKR3 surface exposure levels in the overall cohort as well as CCS (n = 172) and ACS (n = 160) patients. c Bar diagrams (mean ± S.E.M.) showing multiplate® multiple electrode aggregometry with thrombin receptor activating peptide (TRAP) stimulation stratified according to low (1st tertile) vs high (2nd and 3rd tertile) platelet ACKR3 surface exposure levels in the overall cohort (low ACKR3: n = 107; high ACKR3: n = 213) as well as CCS (low ACKR3: n = 51; high ACKR3: n = 103) and ACS (low ACKR3: n = 55; high ACKR3: n = 111) patients. Plotted: mean ± S.D.; statistics: two-tailed Student’s t test; 95% confidence interval.
Fig. 2
Fig. 2. Generation and characterization of Ackr3−/− Pf4-cre+ mice.
a Graphical presentation of the Ackr3 Pf4-cre+ knock-out mouse generation. b Example of western blots (total n = 5) illustrating the loss of ACKR3 in isolated Ackr3−/− platelets compared to Ackr3fl/fl. α-tubulin was used as loading control. c Example DIC image and immunofluorescence staining of Ackr3−/− and Ackr3fl/fl platelets with anti-ACKR3 antibodies, phalloidin and corresponding IgG control (total n = 3; scale bar = 5 µm). d Body weight (Ackr3fl/fl n = 17; Ackr3−/− n = 14;), body length (Ackr3fl/fl n = 12; Ackr3−/− n = 8) compared between Ackr3−/− (n = 14) and Ackr3fl/fl (n = 17). Plotted: mean ± S.E.M.; statistics: Student’s t test (two tailed); 95% confidence interval. e Platelet count compared between Ackr3−/− and Ackr3fl/fl animals (n = 12). f Bleeding time compared between Ackr3−/− (n = 9) and Ackr3fl/fl (n = 10). g Statistical analysis of the receptor expression on Ackr3−/− platelets compared to Ackr3fl/fl (n = 5). h Representative SICM images from Ackr3−/− and Ackr3fl/fl platelets. Statistical analysis of the platelet images obtained by SICM of Ackr3−/− (n = 28) and Ackr3fl/fl (n = 17) platelets. i Representative images of Ackr3−/− (n = 55) and Ackr3fl/fl (n = 63) platelets spread on fibrinogen and activated by 1 µg/ml CRP (scale = 10 µm). Statistical analysis of the platelet images obtained by DIC microscopy of Ackr3−/− and Ackr3fl/fl platelets. j Representative TEM images and organelle count in TEM cross-section of murine platelets of Ackr3−/− and Ackr3fl/fl mice. Left: Dense bodies per platelet cross-section (>2 µm diameter) in murine platelets, Ackr3fl/fl (n = 30) vs Ackr3−/− (n = 48). Middle: Alpha granules per platelet cross-section (>2 µm diameter) in murine platelets, Ackr3fl/fl (n = 30) vs Ackr3−/− (n = 48). Right: Mitochondria per platelet cross-section (>2 µm diameter) in murine platelets, Ackr3fl/fl (n = 30) vs Ackr3−/− (n = 48) (scale = 1 µm).
Fig. 3
Fig. 3. Loss of platelet-ACKR3 promotes platelet activation and thrombus formation.
a P-selectin surface expression after stimulation on Ackr3−/− compared to Ackr3fl/fl platelets. resting: n = 11; CRP: n = 10; Plotted: mean ± S.E.M.; statistics: Student’s t test (two-tailed); 95% confidence interval. b Representative ATP release curve and statistical comparison of Ackr3−/− and Ackr3fl/fl platelets upon activation with 0.005 U/ml thrombin. 0.0025 U/ml Thr: Ackr3fl/fl n = 4, Ackr3−/− n = 3; 0.005 U/ml Thr: Ackr3fl/fl n = 7, Ackr3−/− n = 7; 0.02 U/ml Thr: Ackr3fl/fl n = 7, Ackr3−/− n = 5; Plotted: mean ± S.E.M.; statistics: Student’s t test (two-tailed); 95% confidence interval. c Upper row: Representative calcium measurements and statistical analysis of the extrinsic calcium influx upon activation with 5 µg/ml CRP or 0.02 U/ml thrombin and addition of 1 mM Ca2+ to the medium. 5 µg/ml CRP: Ackr3fl/fl n = 7, Ackr3−/− n = 6; 0.02 U/ml Thr: Ackr3fl/fl n = 7, v n = 7; Plotted: mean ± S.E.M.; statistics: two-tailed Student’s t test; 95% confidence interval. Lower row: Representative calcium measurements and statistical analysis of intrinsic calcium release upon activation with 5 µg/ml CRP or 0.02 U/ml thrombin and Ca2+ deprivation by addition of 0.5 mM EGTA to the medium. 5 µg/ml CRP: Ackr3fl/fl n = 7, Ackr3−/− n = 6, 0.02 U/ml Thr: Ackr3fl/fl n = 5, Ackr3−/− n = 5; Plotted: mean ± S.E.M.; statistics: two-tailed Student’s t test; 95% confidence interval. d Whole blood from Ackr3−/− and Ackr3fl/fl mice was perfused over a collagen-coated surface (100 µg/ml) for 15 min at a shear rate of 1,000 s-1. Representative phase contrast images (scale = 100 µm) and statistical analysis of thrombus coverage shows a significant increase in coverage in Ackr3−/− animals compared to Ackr3fl/fl, n = 6. Plotted: mean ± S.D.; statistics: Student’s t test (two-tailed); 95% confidence interval. e Representative images of the thrombus formation within the left carotid artery after a 5 min ligature and graphical representation of the thrombus area after ligature of the left carotid artery of Ackr3−/− compared to Ackr3fl/fl mice, n = 4.
Fig. 4
Fig. 4. Ackr3−/− platelets promote thrombo-inflammation in vitro.
a Schematic drawing of a modified Boyden chamber used for the following experiments and representative images (scale bar = 200 µm). Statistical analysis of the monocyte migration toward RPS and APS (5 µg/ml CRP-XL) derived from Ackr3−/− or Ackr3flfl. The migration of monocytes was enhanced towards APS derived from Ackr3−/− platelets compared to Ackr3fl/fl APS. 50 ng/ml MCP-1 was used as a positive control. Ackr3fl/fl n = 6, Ackr3−/− n = 5; MCP-1 n = 4; Plotted: mean ± S.E.M.; statistics: Student’s t test (two-tailed); 95% confidence interval. b Representative images of flow chamber experiments were performed with isolated human monocytes. The monocytes were perfused over Ackr3fl/fl (left panel) and Ackr3−/− (right panel) platelets spread (1 µg/ml CRP) on fibrinogen-coated cover slides. Yellow arrowheads point at rolling monocytes whereas asterisks indicate adhesive monocytes (scale bar=100 µm). Statistical analysis of the number of rolling monocytes within 40 s of perfusion. An enhanced adhesion between Ackr3−/− platelets and human monocytes compared to Ackr3fl/fl platelets was observed, n = 6; Plotted: mean ± S.E.M.; statistics: two-tailed Student’s t test; 95% confidence interval. c Statistical analysis of the static adhesion of Ackr3−/− platelets to murine monocytes compared to wild-type control platelets after 2 h incubation period. An enhanced adhesion between Ackr3−/− platelets and murine monocytes was observed compared to Ackr3fl/fl platelets after thrombin (0.1 U/ml) stimulation, n = 6; Plotted: mean ± S.E.M.; statistics: Student’s t test (two-tailed); 95% confidence interval. d Statistical analysis of the spontaneous co-aggregate formation of Ackr3fl/fl and Ackr3−/− platelets measured by flow cytometry analysis under unstimulated and stimulated conditions (1 µg/ml CRP-XL). Image stream images from Ly6G+/platelet aggregates, n = 7; Plotted: mean ± S.E.M.; statistics: two-tailed Mann–Whitney U.
Fig. 5
Fig. 5. Deficiency in platelet ACKR3 aggravates myocardial injury and inflammation following I/R.
a Graphic display of I/R of the heart, including representative images of Evans-Blue and TTC staining of heart sections (healthy tissue=blue, infarct=white, area at risk=red/white areas). Statistical comparison of infarction area [%] of left ventricle and area at risk [%] of left ventricle measured in Ackr3−/− and Ackr3fl/fl after I/R, n = 6; Plotted: mean ± S.D.; statistics: two-tailed Student’s t test; 95% confidence interval. b Representative fluorescence images of infarct area of Ackr3−/−Pf4Cre+ROSA animals with ubiquitous dTomato expression, except in Pf4Cre+ platelets (endogenous GFP). Representative images (scale bar=100 µm) and statistical analysis of CD42b specific DAB staining of the infarct area. Ackr3fl/fl Sham: n = 4, Ackr3fl/fl I/R: n = 8, Ackr3−/−: n = 5; Plotted: mean ± S.E.M.; statistics: two-tailed Student’s t test; 95% confidence interval. c Representative images (scale bar=100 µm) and statistical analysis of Ly6G, MHCII CD3, and B220-specific DAB staining of cell migration into infarct area. Ackr3fl/fl Sham: n = 4, Ackr3fl/fl I/R: n = 8 (CD3 Ackr3fl/fl I/R: n = 7), Ackr3−/−: n = 6; Plotted: mean ± S.E.M.; statistics: Student’s t test; 95% confidence interval. d Representative HE staining images (scale bar=200 µm) and statistical analysis of the number of infiltrating cells/mm into infarct area, n = 6; Plotted: mean ± S.E.M.; statistics: two-tailed Student’s t test; 95% confidence interval. e NanoString analysis of infarct area in Ackr3−/− and Ackr3fl/fl after I/R. Upper left: Scatter plot of mRNA expression showing significantly adjusted p values (p < 0.05, upregulation=red, downregulation=blue; displayed: log2; n = 6). Upper right: KEGG pathway enrichment analysis of significantly altered mRNAs (downregulation = blue, upregulation=red). The number of different KEGG genes of each group (n = 5) is displayed next to it. Semi-quantitative alteration of genes is presented using log2-transformed fold change of mRNA. Lower left: Volcano plot analysis of significance detecting quantitative changes in mRNA levels. p < 0.05=dark blue, n = 6. Lower right: Heat map analysis of significantly regulated mRNAs (upregulation = red, downregulation = green; n = 6). Color density legend on the right indicates plotted variation in z-scores of mRNA expression.
Fig. 6
Fig. 6. 30 min ischemia and 28-day reperfusion of the heart in Ackr3−/− versus Ackr3fl/fl mice.
a Schematic drawing of the timeline and heart sectioning for long-term functional outcome of MI and reperfusion. b Representative TTC/Evans blue staining of the heart section. Statistical analysis of the area at risk of the left ventricle in percent and the infraction of the area at risk in percent, n = 6; Plotted: mean ± S.D.; Statistics: Student’s t test; 95% confidence interval. c Representative pictures of Sirius Red staining of the fibrosis within the heart section 4 and statistical analysis of the fibrosis in the whole heart, n = 6; Plotted: mean ± S.D.; Statistics: Student’s t test; 95% confidence interval. d Statistical analysis of the fibrosis separated by heart sections S1 to S4. S1: Ackr3fl/fl: n = 3, Ackr3−/−: n = 3; S2: Ackr3fl/fl: n = 6, Ackr3−/−: n = 6; S3: Ackr3fl/fl: n = 6, Ackr3−/−: n = 6; S4: Ackr3fl/fl: n = 5, Ackr3−/−: n = 6. Plotted: mean ± S.D.; Statistics: two-tailed Student’s t test; 95% confidence interval. e Strain analysis of the heart in Ackr3−/− versus Ackr3fl/fl mice, n = 6; Plotted: mean ± S.D.; Statistics: two-tailed Student’s t test; 95% confidence interval. f Statistical analysis of the ejection fraction of the heart over time in Ackr3−/− versus Ackr3fl/fl mice, n = 6; Plotted: mean ± S.D.; Statistics: two-tailed Student’s t test; 95% confidence interval. g Representative images of CD31 staining and statistical analysis CD31+ vessels in Ackr3−/− versus Ackr3fl/fl mice. Scale bar = 50 µm, n = 6; Plotted: mean ± S.D.; Statistics: two-tailed Student’s t test; 95% confidence interval.
Fig. 7
Fig. 7. Deficiency in platelet ACKR3 aggravates brain injury and inflammation following ischemia/reperfusion.
a Diagram of the tMCAO of the brain and representative images. Statistic comparison of the infarct volume and Grip test of Ackr3−/− and Ackr3fl/fl after tMCAO. Ackr3fl/fl: n = 10, Ackr3−/−: n = 14; Plotted: mean ± S.E.M.: statistics: Student’s t test; 95% confidence interval. b Graphic display of 7 days tMCAO of the brain, and representative images of the sections. Statistic comparison of infarct volume of Ackr3−/− and Ackr3fl/fl after tMCAO and 7 d reperfusion. Ackr3fl/fl: n = 8, Ackr3−/−: n = 6; Plotted: mean ± S.D.; statistics: two-tailed Student’s t test; 95% confidence interval. c Analysis of NanoString data obtained from brain section after tMCAO. Further statistical analysis of mRNA data was performed using one-way ANOVA of four different animals per genotype. Upper left: Scatter plot of mRNA expression levels in Ackr3−/− versus Ackr3fl/fl. NanoString data showing adjusted p values (p < 0.05) of altered mRNAs, up- or downregulation is highlighted in red and blue respectively. Data displayed using log2 of mRNA reads (n = 4). Nine mRNA were significantly upregulated whereas eight showed downregulation in Ackr3fl/fl. Upper right: Pathway enrichment analysis (KEGG pathway database) of the significantly altered mRNA from the panel on the left. Coloring indicates upregulation or downregulation in the brain section of Ackr3−/−. The semi-quantitative alteration of mRNA is arrayed using log2-transformed fold change comparing Ackr3−/− versus Ackr3fl/fl. The number of different KEGG genes of each group (n = 10) is displayed. Lower left: Volcano plot analysis of changes in mRNA levels in the infarct area of Ackr3−/− and Ackr3fl/fl. Significant changes of NanoString data with adjusted p values (p < 0.05) are displayed in dark blue, n = 4. Lower right: Heat map analysis of significantly upregulated or downregulated mRNAs of all eight individuals comparing Ackr3−/− and Ackr3fl/fl. Upregulated mRNA in brain sections are displayed in red, downregulation is shown in green. Color density legend on the right indicates the plotted variation in z-scores of mRNA expression.
Fig. 8
Fig. 8. Deficiency in platelet ACKR3 results in altered cell migration into the brain following ischemia/reperfusion.
Immunostaining and statistical analysis of tMCAO brain sections. Ly6G+ staining, n = 3; CD3+ staining, Ackr3fl/fl: n = 4, Ackr3−/−: n = 3; GFPA+ staining representing activated astrocytes, n = 3; IBA+ staining, n = 3. Plotted: mean ± S.D.; statistics: one-way ANOVA, 95% confidence interval.
Fig. 9
Fig. 9. Activation of ACKR3 inhibits platelet activation, thrombus formation, and myocardial injury following I/R.
a Upper left: Statistical analysis of platelet P-selectin (CD62P) flow cytometry signals after treatment with ACKR3 agonists (100 µM). ADP: n = 7; CRP: n = 5; Plotted: mean ± S.E.M.; statistics: one-way ANOVA; 95% confidence interval. Upper right/lower row: Dose–response curves of P-selectin expression after treatment with ACKR3 agonists acquired by flow cytometry. b Impedance platelet aggregometry measurements of treated human blood. Control: n = 5; 100 µM VUF11207: n = 3; 100 µM C10: n = 5; control substance 100 µM C46: n = 5; Plotted: mean ± S.E.M.; statistics: Student’s t test, 95% confidence interval. c Representative images of flow chamber experiments conducted with human blood (1000 s-1 on collagen, scale bar = 100 µm) and statistical analysis of ACKR3 agonists effects upon thrombus area [%]. Control: n = 9; 100 µM VUF11207: n = 17; 100 µM C10: n = 14; 100 µM C46: n = 16; Plotted: mean ± S.E.M.; statistics: one-way ANOVA, 95% confidence interval. d Representative images of thrombus formation and analysis of thrombus area [px2] within the left carotid artery after 5 min ligature of C57BL/6 J treated with ACKR3 agonist, n = 5; Plotted: mean ± S.E.M.; statistics: Student’s t test. 95% confidence interval. e Flow cytometry measurements of murine platelets treated with ACKR3 agonist (100 µM C10; vehicle control: 1% DMSO), n = 10; Plotted: mean ± S.E.M.; statistics: Student’s t test, 95% confidence interval. f Representative images of flow chamber experiments conducted with murine whole blood (1000 s-1 on collagen; scale bar=100 µm) and statistical analysis of 100 µM C10 effects upon thrombus area [%]. Ackr3fl/fl: n = 11; Ackr3−/−: n = 10; 100 µM C10: n = 4; Plotted: mean ± S.E.M.; statistics: Student’s t test, 95% confidence interval. g Effect of VUF11207 (300 µg) treatment on Ackr3fl/fl and Ackr3−/− upon I/R of the heart with statistical analysis. Ackr3fl/fl control: n = 8; Ackr3fl/fl Agonist: n = 7; Ackr3−/− control: n = 5; Ackr3−/− Agonist: n = 6; Plotted: mean ± S.D.; statistics: Student’s t test, 95% confidence interval. h, i HE staining and statistical analysis of the infarct area h Ackr3fl/fl control: n = 8; Ackr3fl/fl Agonist: n = 7; i Ackr3−/− control: n = 5; Ackr3−/− Agonist: n = 5.

References

    1. Ziegler M, et al. A single-chain antibody-CD39 fusion protein targeting activated platelets protects from cardiac ischaemia/reperfusion injury. Eur. Heart J. 2018;39:111–116. - PubMed
    1. Schuhmann MK, Langhauser F, Kraft P, Kleinschnitz C. B cells do not have a major pathophysiologic role in acute ischemic stroke in mice. J. Neuroinflammation. 2017;14:112. - PMC - PubMed
    1. Massberg S, et al. A critical role of platelet adhesion in the initiation of atherosclerotic lesion formation. J. Exp. Med. 2002;196:887–896. - PMC - PubMed
    1. Huo Y, et al. Circulating activated platelets exacerbate atherosclerosis in mice deficient in apolipoprotein E. Nat. Med. 2003;9:61–67. - PubMed
    1. Vogel S, et al. Platelet-derived HMGB1 is a critical mediator of thrombosis. J. Clin. Investig. 2015;125:4638–4654. - PMC - PubMed

Publication types