. 2022 Apr 5;13(1):1827.
doi: 10.1038/s41467-022-29098-7.

Cell-intrinsic Aryl Hydrocarbon Receptor signalling is required for the resolution of injury-induced colonic stem cells

Affiliations

Cell-intrinsic Aryl Hydrocarbon Receptor signalling is required for the resolution of injury-induced colonic stem cells

Kathleen Shah et al. Nat Commun. .

Abstract

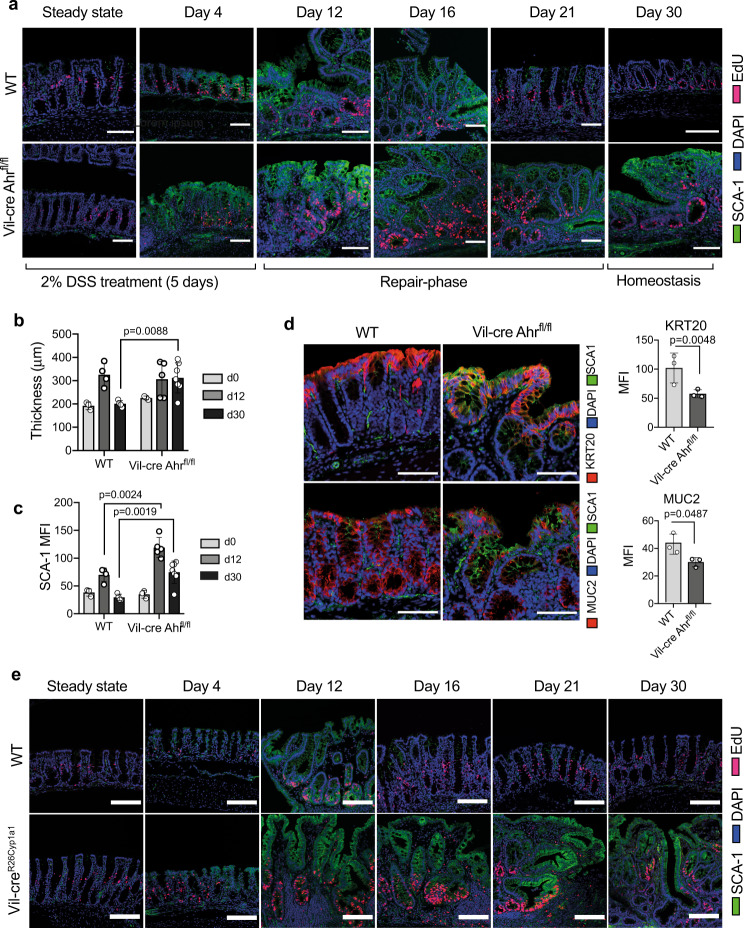
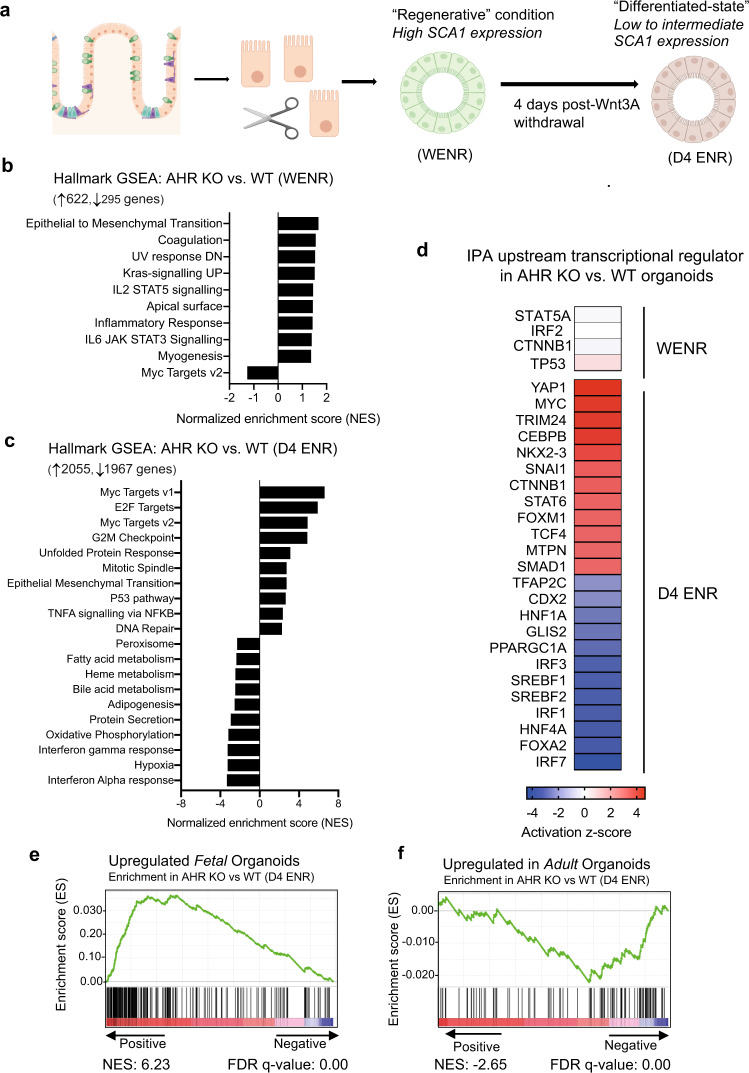
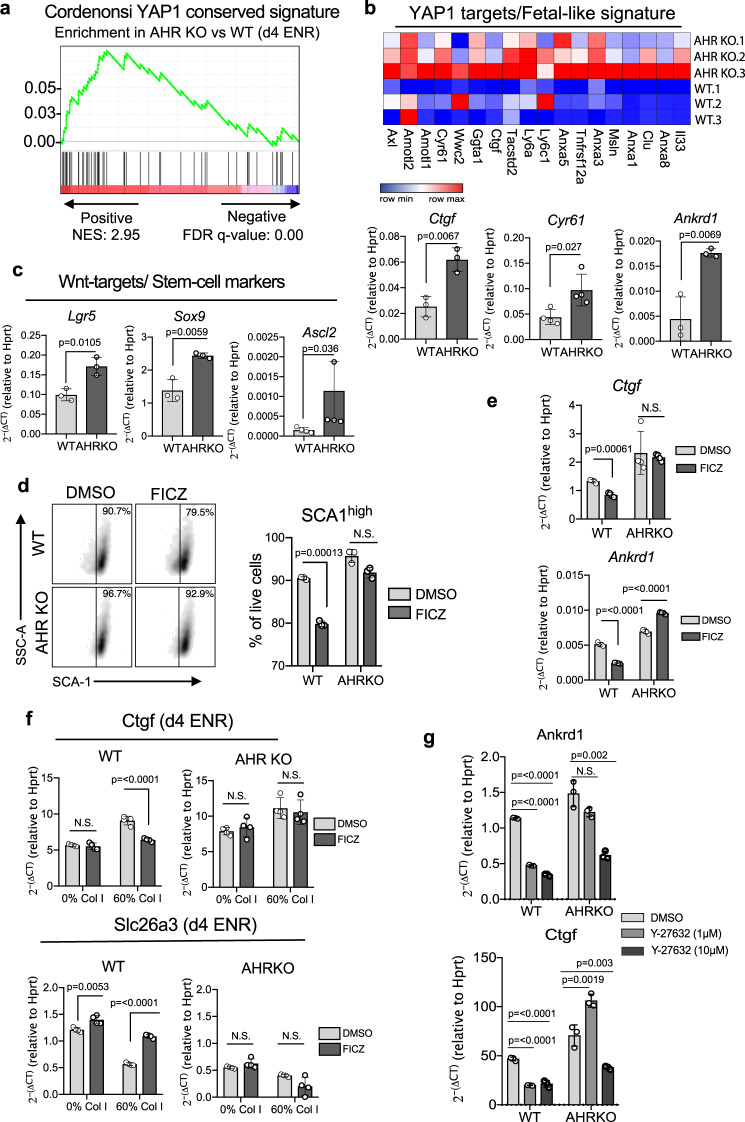
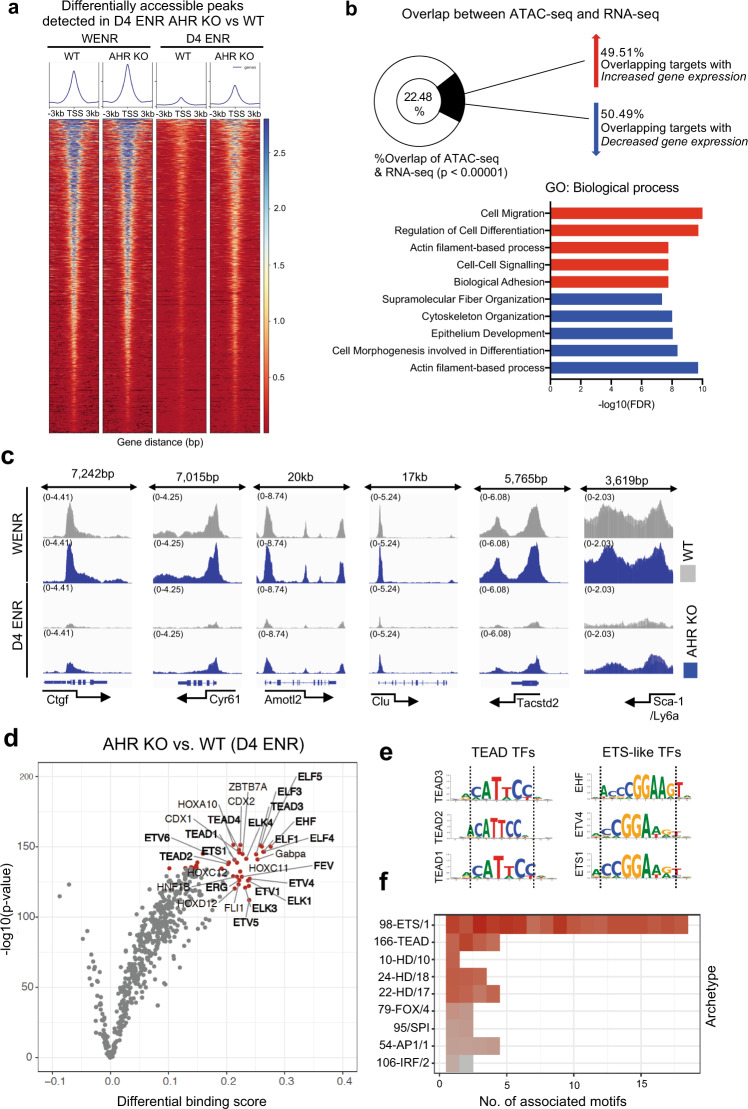
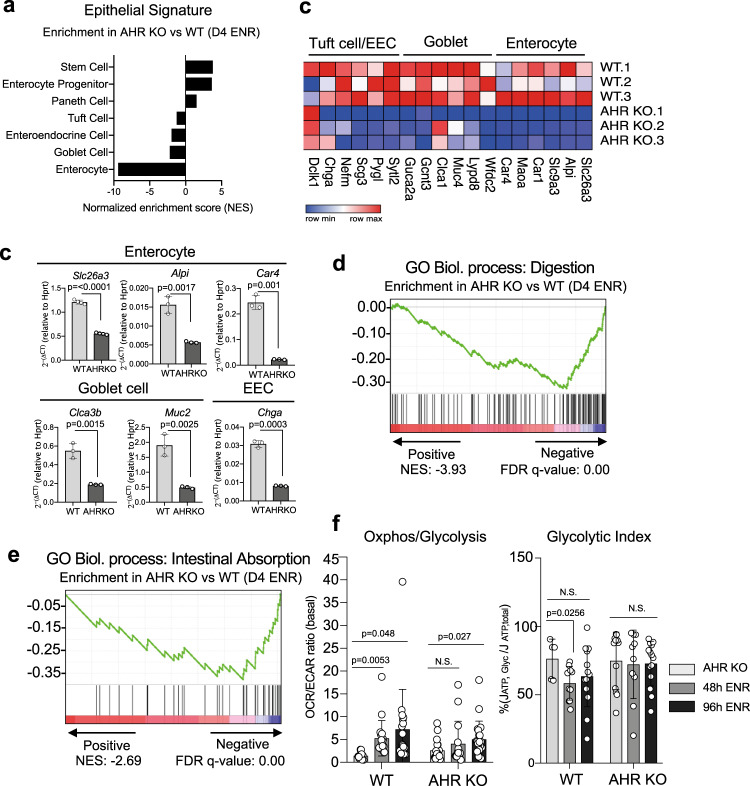
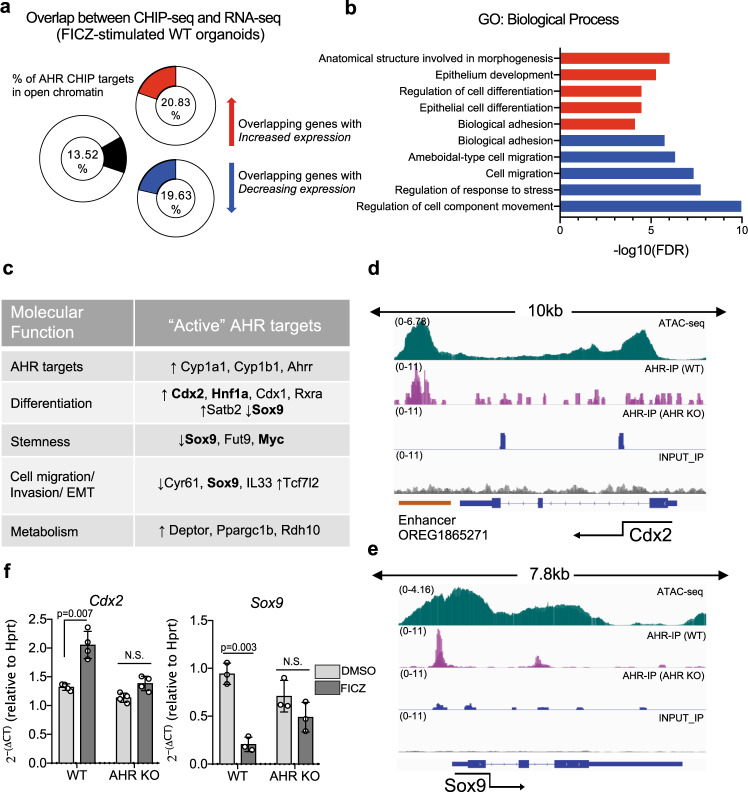
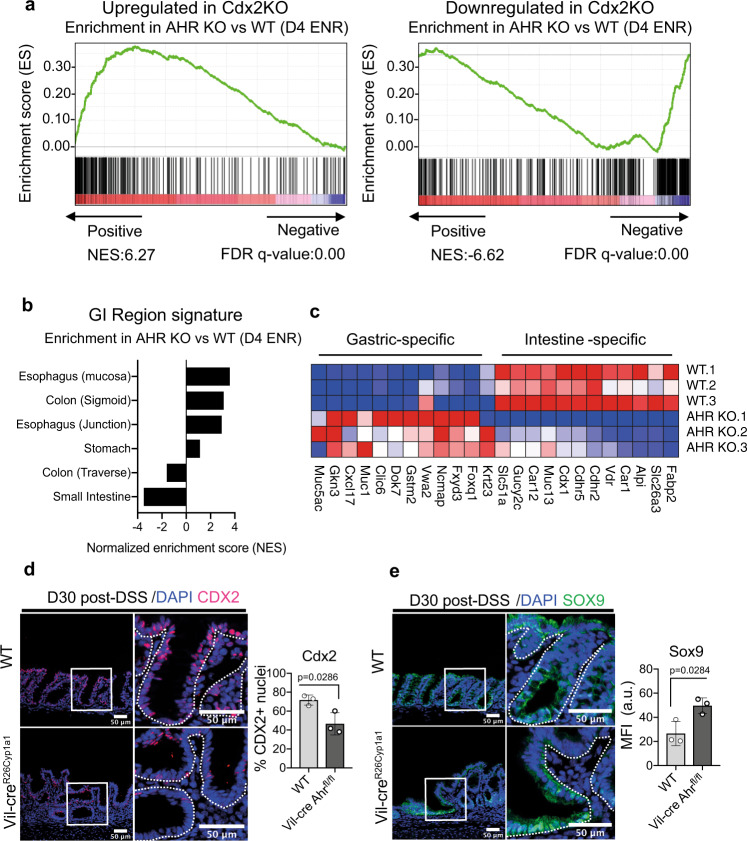
The aryl hydrocarbon receptor (AHR) is an environmental sensor that integrates microbial and dietary cues to influence physiological processes within the intestinal microenvironment, protecting against colitis and colitis-associated colorectal cancer development. Rapid tissue regeneration upon injury is important for the reinstatement of barrier integrity and its dysregulation promotes malignant transformation. Here we show that AHR is important for the termination of the regenerative response and the reacquisition of mature epithelial cell identity post injury in vivo and in organoid cultures in vitro. Using an integrative multi-omics approach in colon organoids, we show that AHR is required for timely termination of the regenerative response through direct regulation of transcription factors involved in epithelial cell differentiation as well as restriction of chromatin accessibility to regeneration-associated Yap/Tead transcriptional targets. Safeguarding a regulated regenerative response places AHR at a pivotal position in the delicate balance between controlled regeneration and malignant transformation.


Conflict of interest statement

The authors declare no competing interests.

Figures

Fig. 1
Fig. 1. AHR drives termination of colonic epithelial regeneration.
a Representative images showing Sca-1 (green) expression and proliferative (EdU+, red) cells in regenerative foci in the colon of DSS-treated Vil-cre AHRfl/fl and WT control mice. Regenerative foci are identified as regions with epithelial Sca-1+ expression and significant crypt dysplasia as well as proliferating cells (EdU; 2 h post-i.p injection). b Measurement of mucosal and submucosal thickness and c Sca-1 MFI at d0, d12 and d30 post-DSS treatment. (d) Representative images showing expression of differentiation markers Muc2 (goblet cell, red) and Krt20 (pan-differentiation marker, red) in epithelial cells co-stained with Sca1 (green) and DAPI (blue) within regenerative foci in the colon of Vil-cre Ahrfl/fl mice and WT controls at d30 post-DSS challenge. Quantifications for (b, c) were done measuring mean ± SD distances or mean MFI ± SD per mouse. The data-points represent n = 3 (d0), n = 4 (d12, d30) WT control mice and n = 3 (d0), n = 5 (d12), n = 7 (d30) Vil-cre AHRfl/fl mice). Statistical significance between genotypes per timepoint was determined by Multiple t-test. P value of >0.05 was considered not significant (n.s.). Data-points for (d) represents n = 3 mice per genotype and quantifications graphed are mean MFI ± SD per mouse; an unpaired t-test (two-tailed) was used to assess statistical significance. Representative images show Sca-1 (green) expression and proliferative (EdU+, red) cells in regenerative foci found in the colon of Vil-cre R26LSL-Cyp1a1 and WT control mice (e) during the course of DSS. DAPI staining (blue) was used to identify nuclei in all images. Data is representative of at least 2–3 independent experiments. Scale bars: 100 µm. Source data for (1bd) are provided with this paper in the source data file.
Fig. 2
Fig. 2. Altered transcriptional program in d4 ENR AHR KO organoids.
a Schematic for RNA-seq of organoids in WENR/Regenerative or d4 ENR/differentiating conditions (created in BioRender). Normalized enrichment scores (NES) from GSEA; MsigDB Hallmark datasets of genes significantly upregulated or downregulated (FDR < 0.05) in AHR KO vs WT colon organoids grown in (b) regenerative (WENR) and (c) differentiating conditions (d4 ENR). d Heatmap for activation z-score of known transcriptional regulators predicted to be upstream of differentially expressed genes in either WENR or d4 ENR AHR KO vs WT organoids (full list in the source data; predicted factors with a p value of <0.0001 are shown). e Enrichment plot for transcriptional signature of d4 ENR AHR KO organoids compared to gene set upregulated in (e) fetal spheroids (NES: 6.23, FDR q value: 0.00) and (f) adult organoids (NES: -2.05, FDR q value: 0.00), respectively. Source data for (2bd) are provided with this paper in the source data file.
Fig. 3
Fig. 3. Enrichment for Yap/Tead targets in d4 ENR AHR KO organoids.
a Enrichment plot for transcriptional signature of d4 ENR AHR KO organoids compared to the Cordenonsi Yap1 conserved signature dataset (GSEA C6: Oncogenic datasets - NES: 2.95, FDR q value: 0.00) (b) Heatmap of select Yap1 targets and fetal-like genes differentially expressed in d4 ENR AHR KO organoids; expression of YAP1 target Ctgf, Cyr61 and Ankrd1 validated by qPCR. c expression of Lgr5, Ascl2 and Sox9 by qPCR. d Representative flow cytometry plots and percentage of cells expressing high levels of surface Sca-1 (e) qPCR expression of Yap targets in WT and AHR KO organoids in WENR conditions after 24 h and 4 h of FICZ-stimulation, respectively. f qPCR expression of Ctgf and colonocyte differentiation marker Slc26a3 in organoids grown in matrigel containing either 0% or 60% Collagen I. Cells were stimulated with either DMSO (vehicle) or FICZ and expression was assessed 24 h post-treatment. g qPCR expression of Ctgf and Ankrd1 in WT and AHR KO organoids grown in 60% Collagen I (d4 ENR) treated with either 1 µM or 10 µM of ROCK-inhibitor (Y-27632). Organoids used for experiments were generated from either n = 3 (i.e. Lgr5, Sox9, Ankrd1, Ctgf) or n = 4 (i.e. Cyr61, Ascl2) mice per genotype. Data-points for the collagen and Y-27632 experiments are generated from n = 4 and n = 3 mice per genotype respectively. Statistical significance was determined by (a, b) unpaired t-test (two-tailed) (cf) two-way ANOVA with Sidak’s multiple comparison test, (g) statistical differences between treatment and DMSO control per genotype was done using an ordinary one-way ANOVA with Dunnett’s multiple comparison test. P value of >0.05 was considered not significant (n.s.). Error bars displayed on graphs represent the mean ± SD of at least two independent experiments. Source data for (3bg) are provided with this paper in the source data file.
Fig. 4
Fig. 4. AHR restricts genomic accessibility to Yap/Tead targets.
a Deeptools heatmap showing accessibility data of differentially expressed peaks identified in d4 ENR AHR KO vs WT organoids across samples (FDR < 0.05) (b) GO gene ontology (biological process) was conducted on genes that overlap between differentially accessible targets identified by ATAC-seq and differentially upregulated or downregulated genes in AHR KO vs WT organoids grown in D4 ENR conditions as determined by RNA-seq (FDR < 0.05). Statistical significance was determined by permutation testing of the overlap between the datasets (p value <0.00001). c IgV images of accessibility peaks (open regions) of known Yap/Tead targets (Ctgf, Cyr61, Amotl2) and fetal-like genes (Clu, Tacstd2, Ly6a) in d4 ENR WT and AHR KO organoids (d) Pairwise comparison of TF activity between differentiated AHR KO and WT organoids (d4 ENR). The volcano plots show the differential binding activity against the –log10 (p value) of all investigated TF motifs represented by a dot. Only the top 5% (both by fold-change, -log10 p value) of TF motifs identified are highlighted in red. TFs belonging to Tead and Ets-1 like family of factors are bolded. e Motif sequences of some identified TFs belonging to Tead (Tead 3, Tead4, Tead1) and Ets-1 family are shown, and the dotted line highlights the similarity in the binding sequence of these factors (f) Top 5% of identified motifs were aligned to each other and matched to an archetypal consensus motif. The color represents the fold-change (Red to grey – highest to lowest) in differential binding score between d4 AHR KO vs WT organoids. Source data for (4b, d) are provided with this paper in the source data file.
Fig. 5
Fig. 5. Loss of AHR impairs colonic epithelial differentiation.
a Enrichment plot for transcriptional signature of d4 ENR AHR KO organoids compared to transcriptional signatures from intestinal epithelial cell subtypes. b Heatmap showing expression of select genes for mature epithelial subsets in either WT or AHR KO cells grown in d4 ENR conditions (c) qPCR expression data of mature epithelial markers for colonocytes (Slc26a3, Alpi, Car4), goblet cells (Clca3b, Muc2) or enteroendocrine cells (Chga) in d4 ENR WT or AHR KO cells. Organoids used for experiments in (c) were generated from either n = 3 (i.e. Muc2, ChgA, Clca3b, Car4) or n = 4 (i.e. Slc26a3) mice per genotype and statistical significance was determined by unpaired t-tests (two-tailed). Error bars displayed on graphs represent the mean ± SD of at least three independent experiments. d GO gene ontology analysis for transcriptional signature associated with mature epithelial function such as digestion (NES: −3.93, FDR q value: 0.00) and (e) absorption (NES: −2.21, FDR q-value: 0.00). f Metabolic analysis by Seahorse of AHR KO organoids compared with WT controls for basal OxPHOS vs glycolysis (left panel) and glycolytic index (right panel) and assessed at either 0 h (WENR conditions), 48 h (d2 ENR) and 96 h (d4 ENR) post-Wnt removal. Data shows mean ± SD expression of technical replicates from organoids generated from n = 3 mice and data pooled from three independent experiments. Multiple t-tests was performed between each timepoint vs WENR condition per genotype to determine statistical significance. Source data for (5c, f) are provided with this paper in the source data file.
Fig. 6
Fig. 6. AHR regulates key factors involved in regenerative response.
a Overlap between identified AHR ChIP targets in open chromatin regions with genes up or downregulated in response to FICZ from RNA-sequenced WT organoids (4h-post FICZ treatment). b Functional annotation of activated (red) or repressed (blue) AHR targets using GO ontology analysis (GO biological process) (c) Selection of active AHR targets with their associated functions. Targets that were also identified by the IPA upstream regulator analysis in d4 ENR AHR KO organoids are in bold (see Fig. 2 C). d IgV graphs showing sites of AHR binding in an enhancer element of Cdx2 and and (e) AHR binding to the Sox9 promoter. f qPCR expression data of Cdx2 and Sox9 in WT and AHR KO organoids treated with FICZ (4 h). Statistical significance was determined by two-way ANOVA with Sidak’s multiple comparison test. P value of >0.05 was considered not significant (n.s.). n = 4 and n = 3 mice per genotype were used for Cdx2 and Sox9 qPCRs respectively. Error bars displayed on graphs represent the mean ± SD of at least two independent experiments. Source data for (6ac, f) are provided with this paper in the source data file.
Fig. 7
Fig. 7. AHR drives reacquisition of intestinal identity post-injury.
a Gene set enrichment plots of AHR KO organoids relative to genes either upregulated (NES: 6.3, FDR q-value: 0.00) or downregulated (NES: -6.62, FDR q value: 0.00) in Cdx2 KO intestinal organoid dataset (b) Gene set enrichment of d4 ENR AHR KO vs WT organoids relative to conserved GI-region specific signatures compiled from GiTEX database (c) Heatmap for expression of canonical genes expressed in either intestine or gastric tissues, in d4 ENR WT and AHR KO organoids. Representative images and quantifications of Cdx2 (d) and Sox9 (e) staining in colonic crypts of WT and Vil-cre AHRfl/fl mice d30 post DSS treatment. Bar graphs show mean MFI ± SD per mouse for Sox9 and mean % of nuclei positive for Cdx2 per mouse (n = 3 mice). Statistical significance was determined using an unpaired t-test (two-tailed). Error bars displayed on graphs represent the mean ± SD. Scale bar: 50 µm. Source data for (7d, e) are provided with this paper in the source data file.

References

    1. Yui S, et al. YAP/TAZ-dependent reprogramming of colonic epithelium links ECM remodeling to tissue regeneration. Cell Stem Cell. 2018;22:35–49 e37. - PMC - PubMed
    1. Burclaff, J. & Mills, J. C. Plasticity of differentiated cells in wound repair and tumorigenesis, part II: skin and intestine. Dis Model Mech11, 10.1242/dmm.035071 (2018). - PMC - PubMed
    1. Mills JC, Sansom OJ. Reserve stem cells: Differentiated cells reprogram to fuel repair, metaplasia, and neoplasia in the adult gastrointestinal tract. Sci. Signal. 2015;8:re8. - PMC - PubMed
    1. Baulies, A., Angelis, N. & Li, V. S. W. Hallmarks of intestinal stem cells. Development147, 10.1242/dev.182675 (2020). - PubMed
    1. Nusse YM, et al. Parasitic helminths induce fetal-like reversion in the intestinal stem cell niche. Nature. 2018;559:109–113. - PMC - PubMed

Publication types

MeSH terms

Substances