. 2022 Apr 5;13(1):1811.
doi: 10.1038/s41467-022-29444-9.

Integrative analysis of non-small cell lung cancer patient-derived xenografts identifies distinct proteotypes associated with patient outcomes

Affiliations

Integrative analysis of non-small cell lung cancer patient-derived xenografts identifies distinct proteotypes associated with patient outcomes

Shideh Mirhadi et al. Nat Commun. .

Abstract

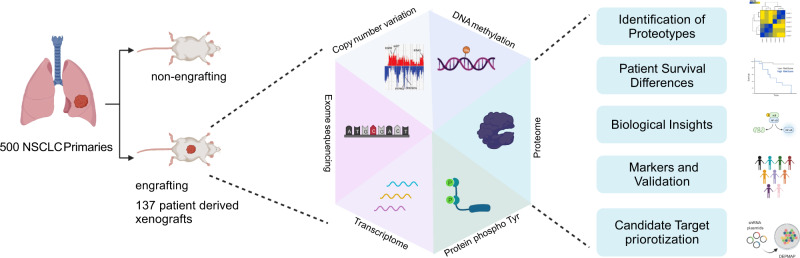
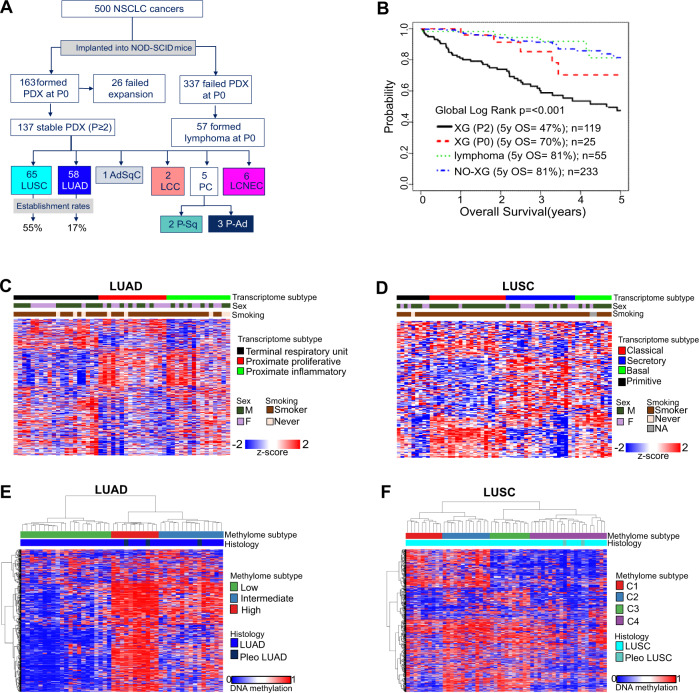
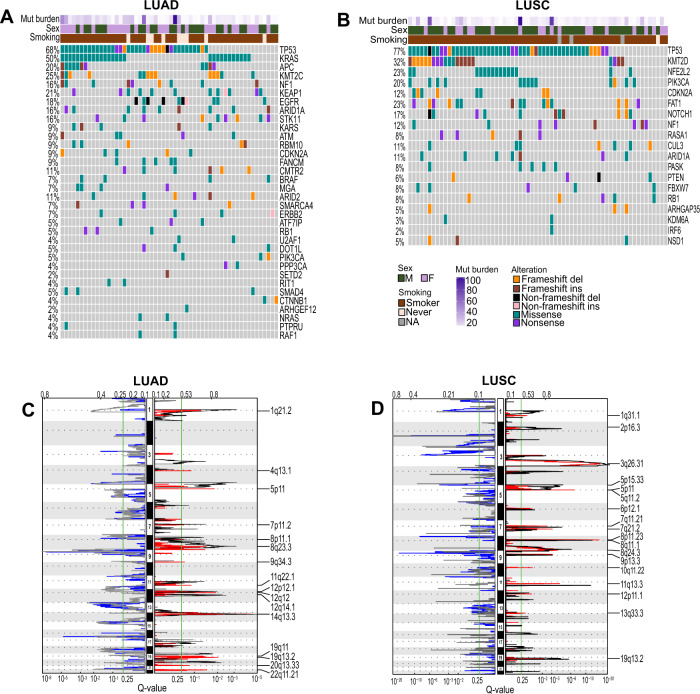
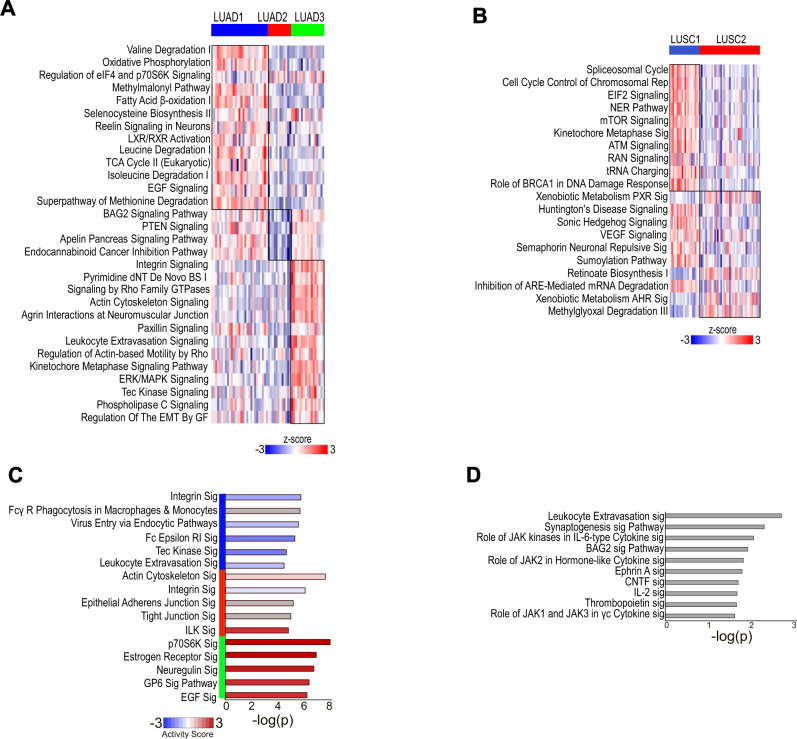
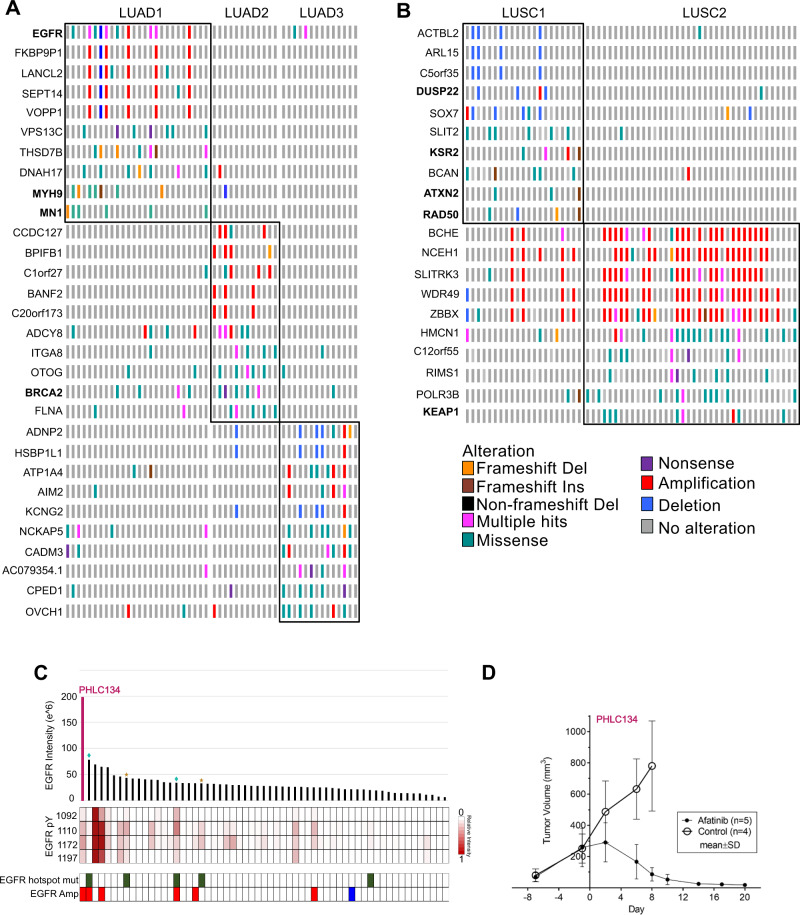
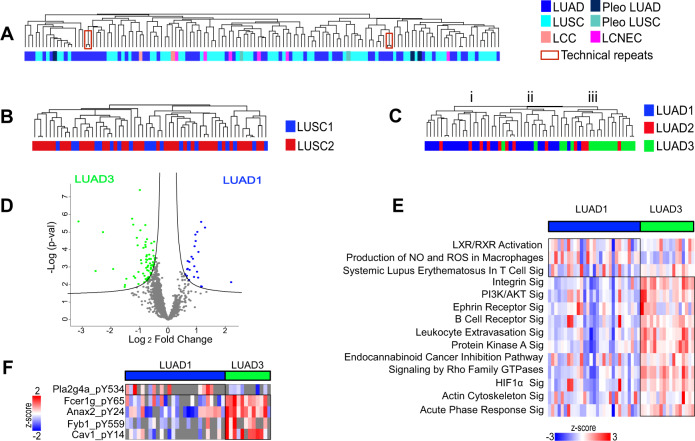
Non-small cell lung cancer (NSCLC) is the leading cause of cancer deaths worldwide. Only a fraction of NSCLC harbor actionable driver mutations and there is an urgent need for patient-derived model systems that will enable the development of new targeted therapies. NSCLC and other cancers display profound proteome remodeling compared to normal tissue that is not predicted by DNA or RNA analyses. Here, we generate 137 NSCLC patient-derived xenografts (PDXs) that recapitulate the histology and molecular features of primary NSCLC. Proteome analysis of the PDX models reveals 3 adenocarcinoma and 2 squamous cell carcinoma proteotypes that are associated with different patient outcomes, protein-phosphotyrosine profiles, signatures of activated pathways and candidate targets, and in adenocarcinoma, stromal immune features. These findings portend proteome-based NSCLC classification and treatment and support the PDX resource as a viable model for the development of new targeted therapies.


Conflict of interest statement

The authors declare no competing interests.

Figures

Fig. 1
Fig. 1. A roadmap to cancer proteotype discovery and utility.
A subset of 137 of 500 primary NSCLC tumors engrafted to yield PDX models. PDXs represent the most aggressive subset of NSCLC and were profiled for gene expression, gene copy number variation, DNA methylation, exome mutations, proteome and phosphotyrosine(pY)-proteome. Proteome profiling revealed proteotypes associated with patient survival differences. Proteotypes display distinctive active pathway features and associated candidate therapeutic targets. Signatures comprising proteotype markers effectively stratify orthogonal NSCLC primary tumors, as well as NSCLC DepMap cell lines, which enables a degree of candidate target validation and prioritization based on alignment with DepMap sensitivities.
Fig. 2
Fig. 2. NSCLC PDX models represent primary tumor transcriptome and methylome features.
A Workflow for generation of NSCLC stable PDX models including primary resections and EBUS recurrences. See also Supplementary Table 1. B 5-year survival Kaplan–Meier plot of primary resected cases. C Assignment of PDXs to the 3 TCGA described LUAD transcriptome subtypes. See also Supplementary Fig. 1. D Assignment of PDXs to the 4 TCGA described LUSC transcriptome subtypes. See also Supplementary Fig. 1. E Identification of three major methylation groups among LUAD and F four major methylation groups among LUSC using unsupervised clustering of top 4000 most variable CpGs (in promoter region or within 1500 bases of the transcription start site).
Fig. 3
Fig. 3. NSCLC PDX models represent primary tumor genomic features.
A, B Oncoprint showing DNA alterations in frequently altered genes of A LUAD and B LUSC. C, D LUAD (C) and LUSC (D) PDXs GISTIC showing significantly amplified regions in red and significantly deleted regions in blue, TCGA CNV is overlaid for comparison with black showing significantly amplified and gray showing significantly deleted CNV regions in LUAD TCGA patients.
Fig. 4
Fig. 4. Proteome measurement of PDX models.
A Pie chart showing 6830 human (tumor), 4423 mouse (stroma) and 2031 ambiguous human/mouse proteins detected by proteome analysis. B Tumor/stromal composition of each PDX sample shows wide range of tumor vs. stroma content. C Histological separation by unsupervised hierarchical clustering of PDXs by tumor proteome. D Differential proteome between histological types LUAD and LUSC (two-sided t-test, FDR < 0.001). E, F Significantly differential upregulated proteins (FDR < 0.001) are ranked based on fold-change (E) for LUSC and (F) LUAD.
Fig. 5
Fig. 5. Lung LUAD and LUSC defined proteotypes associated with differences in patient survival and protein-phosphotyrosine signatures.
A, B Tumor proteome separates (A) LUAD histology PDX samples into three distinct subtypes LUAD1, LUAD2, and LUAD3 and B LUSC into two distinct subtypes LUSC1 and LUSC2. See also Supplementary Fig. 3A–J. C, D 5-year overall survival Kaplan–Meier plot shows significant survival differences between the C LUAD1 and LUAD3 groups and D the two LUSC groups. See also Supplementary Table 4. E, F Stage breakdown of E LUAD and F LUSC proteotypes. G, H Proteotypes of G LUAD and H LUSC have distinctive protein-pY profiles.
Fig. 6
Fig. 6. Proteotypes feature active biological pathway.
A, B Enriched and active pathways of each A LUAD and B LUSC proteotypes by total proteome is shown. The heatmap shows gene set score of the pathway for each sample. See also Supplementary Data 2. C, D Top significant pathways of C LUAD and D LUSC proteotypes by pY proteome is shown. See also Supplementary Data 3.
Fig. 7
Fig. 7. Proteotypes demonstrate recurrent genomic alterations.
A, B Significantly altered genes associated with A LUAD and B LUSC proteotype are shown. Genes in bold are cancer drivers as defined by cBioportal. C EGFR protein expression, active pY sites, driver mutation and amplification status per LUAD cases. Blue diamonds show responders and yellow star cases show non-responders to EGFR TKI. D Tumor volume growth trend in response to Afatinib (n = 6) vs. Control (n = 5) in NSCLC PDX model 134 that has amplification and elevated protein expression of WT EGFR (mean ± SD) (linear mixed effects model, p-value = 2.3E-15). Source data are provided as a Source Data file.
Fig. 8
Fig. 8. Differential stromal composition of LUAD proteotypes 1 and 3.
AC Unsupervised hierarchical clustering of stromal (mouse) proteome does not cluster based on A histological type nor B LUSC proteotypes. C LUAD3 is significantly enriched in stromal proteome cluster (iii) (Fisher’s exact t-test p-value = 3.7E-07). D Significantly differential stromal proteins between LUAD1 and LUAD3 (two-sided t-test, FDR < 0.05). See also Supplementary Data 2. E Significant and active pathways that differ between LUAD1 and LUAD3, based on proteins identified in Fig. 7D. The heatmap shows the gene set score of the pathway for each sample. See also Supplementary Data 2. F Significantly differential pY peptides between LUAD1 and LUAD3 (two-sided t-test, p-value < 0.05).

References

    1. Bray F, et al. Global cancer statistics 2018: GLOBOCAN estimates of incidence and mortality worldwide for 36 cancers in 185 countries. Ca. Cancer J. Clin. 2018;68:394–424. - PubMed
    1. Travis WD, et al. The 2015 World Health Organization Classification of Lung Tumors: impact of genetic, clinical and radiologic advances since the 2004 classification. J. Thorac. Oncol. 2015;10:1243–1260. - PubMed
    1. Lu T, et al. Trends in the incidence, treatment, and survival of patients with lung cancer in the last four decades. Cancer Manag. Res. 2019;11:943–953. - PMC - PubMed
    1. Ferrara R, Mezquita L, Besse B. Progress in the management of advanced thoracic malignancies in 2017. J. Thorac. Oncol. 2018;13:301–322. - PubMed
    1. Tan AC, Tan DSW. Targeted Therapies for Lung Cancer Patients With Oncogenic Driver Molecular Alterations. J. Clin. Oncol. 2022;40:611–625. - PubMed

Publication types

Grants and funding