. 2022 Apr 5;12(1):5680.
doi: 10.1038/s41598-022-08431-6.

Characterisation and natural progression of SARS-CoV-2 infection in ferrets

Affiliations

Characterisation and natural progression of SARS-CoV-2 infection in ferrets

Gough G Au et al. Sci Rep. .

Abstract

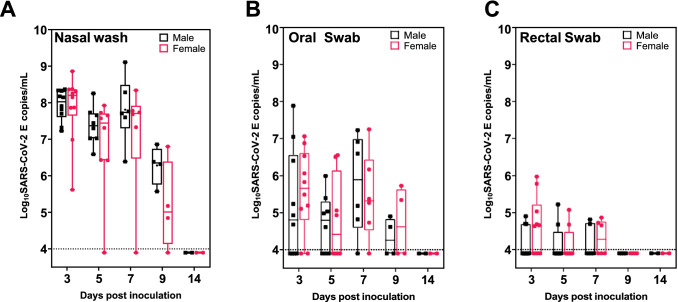
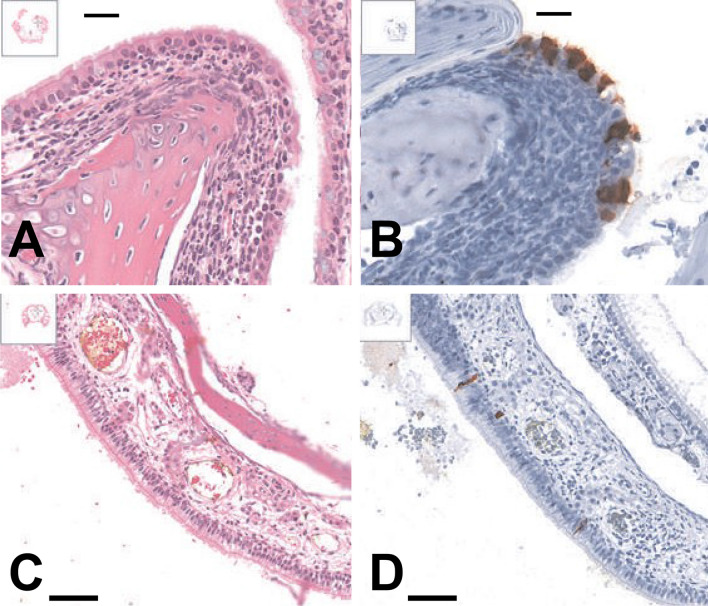
Severe acute respiratory syndrome coronavirus 2 (SARS-CoV-2) is responsible for the infectious disease COVID-19, which has rapidly become an international pandemic with significant impact on healthcare systems and the global economy. To assist antiviral therapy and vaccine development efforts, we performed a natural history/time course study of SARS-CoV-2 infection in ferrets to characterise and assess the suitability of this animal model. Ten ferrets of each sex were challenged intranasally with 4.64 × 10⁴ TCID50 of SARS-CoV-2 isolate Australia/VIC01/2020 and monitored for clinical disease signs, viral shedding, and tissues collected post-mortem for histopathological and virological assessment at set intervals. We found that SARS-CoV-2 replicated in the upper respiratory tract of ferrets with consistent viral shedding in nasal wash samples and oral swab samples up until day 9. Infectious SARS-CoV-2 was recovered from nasal washes, oral swabs, nasal turbinates, pharynx, and olfactory bulb samples within 3-7 days post-challenge; however, only viral RNA was detected by qRT-PCR in samples collected from the trachea, lung, and parts of the gastrointestinal tract. Viral antigen was seen exclusively in nasal epithelium and associated sloughed cells and draining lymph nodes upon immunohistochemical staining. Due to the absence of clinical signs after viral challenge, our ferret model is appropriate for studying asymptomatic SARS-CoV-2 infections and most suitable for use in vaccine efficacy studies.


Figures

Figure 1
Figure 1
Clinical Observations of ferrets after SARS-CoV-2 challenge. (A) Ferrets were observed at least once a day, with twice a day monitoring (approximately 6 h apart) from day 3 onwards. Temperatures were taken during routine clinical monitoring using the identifier microchip on all days apart from the day of virus challenge. Data points indicate mean temperatures ± SEM. (B) Rectal temperatures were taken during the enrolment/acclimatisation phase, and at day 3, 5, 7, 9, and 14 while ferrets were anaesthetised. Data points indicate mean rectal temperatures ± SEM. Statistical significance indicated by * (p < 0.05). (C) Ferret body weight was recorded while anaesthetised at day − 7, − 4, 0, 3, 5, 7, 9, and 14 days post virus challenge. Points and lines represent individual animals. In each of the panels, black squares indicate male animals and rose-coloured circles indicate female animals.
Figure 2
Figure 2
Shedding of SARS-CoV-2 in ferret secretions following intranasal exposure. Virus excretion from (A) nasal wash, (B) oral swab, and (C) rectal swabs at 3, 5, 7, 9, and 14 days post-administration of SARS-CoV-2 as detected by qRT-PCR. Individual data points are plotted, together with box plots show- ing the median values with the whiskers indicating the maximum and minimum viral genome copies/mL. Male data is shown in black and female data in rose. The horizontal dotted line in each panel represents the lower limit of detection.
Figure 3
Figure 3
Distribution of SARS-CoV-2 RNA in ferret tissues and organs after intranasal challenge. Log10 SARS-CoV-2 viral genomes per gram of tissue detected in organs or tissues of ferrets inoculated with SARS-CoV-2 Australia/VIC01 isolate. Panel (A) shows data from two male and two female ferrets euthanased on day 3, (B) day 5, (C) Day 7, (D) day 9, and (E) day 14 respectively. Bars indicate mean values, together with individual data points shown as black squares for males and rose-coloured circles for female ferrets, error bars indicate ± SEM. The horizontal dashed line shows the lower limit of detection. LYMPH RETR represents the retropharyngeal lymph node, LYMPH BRON the bronchial lymph node, OLFAC LOBE the olfactory bulb, and OCCIP LOBE the occipital lobe respectively.
Figure 4
Figure 4
SARS-CoV-2 nucleocapsid IHC labeling in nasal turbinates. (A) Representative image from a ferret euthanased at day 3 post-inoculation (p.i.), intense positive cytoplasmic diffuse labeling in olfactory epithelium. (B) Day 5 p.i., small patches of positively labeled olfactory epithelium. (C) Day 7 p.i., scattered individual antigen-positive epithelial cells in the respiratory epithelium of the nasal turbinates. (D) Day 7 p.i., antigen-positive sloughed epithelial cells admixed with many inflammatory cells and mucus overlying the oropharyngeal mucosa. SARS-CoV-2 IHC sections are labelled with a nucleocapsid- specific polyclonal antibody, HRP-secondary antibody and aminoethyl carbazole chromagen. Scale bars in each panel represent 50 µm.
Figure 5
Figure 5
Positive SARS-CoV-2 antigen labeling was not associated with a specific inflammatory response in the nasal respiratory epithelium. (A, B) show nasal turbinates from a ferret euthanased at day 3 post-inoculation (p.i.) with moderate infiltration of neutrophils and lymphocytes in an antigen-positive region of the respiratory epithelium. Tissues from a ferret humanely killed at 7 days p.i., (C, D) show an antigen-positive region of the respiratory epithelium, not associated with an inflammatory infiltrate. Panels (A, C) represent H&E stained sections. Panels (B, D) represent the corresponding SARS-CoV-2 IHC sections labelled with a nucleocapsid-specific polyclonal antibody, HRP-secondary antibody and aminoethyl carbazole chromagen. Scale bars in each panel represent 50 µm.

References

    1. Dong E, Du H, Gardner L. An interactive web-based dashboard to track COVID-19 in real time. Lancet Infect. Diseases. 2020;20:533–534. doi: 10.1016/S1473-3099(20)30120-1. - DOI - PMC - PubMed
    1. Zhou P, et al. A pneumonia outbreak associated with a new coronavirus of probable bat origin. Nature. 2020;579:270–273. doi: 10.1038/s41586-020-2012-7. - DOI - PMC - PubMed
    1. Gorbalenya AE, et al. The species Severe acute respiratory syndrome-related coronavirus: Classifying 2019-nCoV and naming it SARS-CoV-2. Nat. Microbiol. 2020;5:536–544. doi: 10.1038/s41564-020-0695-z. - DOI - PMC - PubMed
    1. Peiris JSM, et al. Coronavirus as a possible cause of severe acute respiratory syndrome. Lancet. 2003;361:1319–1325. doi: 10.1016/S0140-6736(03)13077-2. - DOI - PMC - PubMed
    1. Masters PS, Perlman S, et al. Coronaviridae. In: Knipe DM, Howley PM, Cohen JI, et al., editors. Fields Virology. Lippincott Williams & Wilkins; 2013. pp. 825–858.

Publication types