. 2022 Apr 5;12(1):5718.
doi: 10.1038/s41598-022-09638-3.

High-throughput translational profiling with riboPLATE-seq

Affiliations

High-throughput translational profiling with riboPLATE-seq

Jordan B Metz et al. Sci Rep. .

Abstract

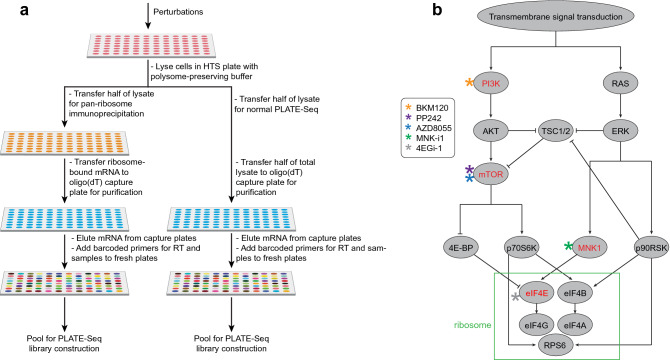
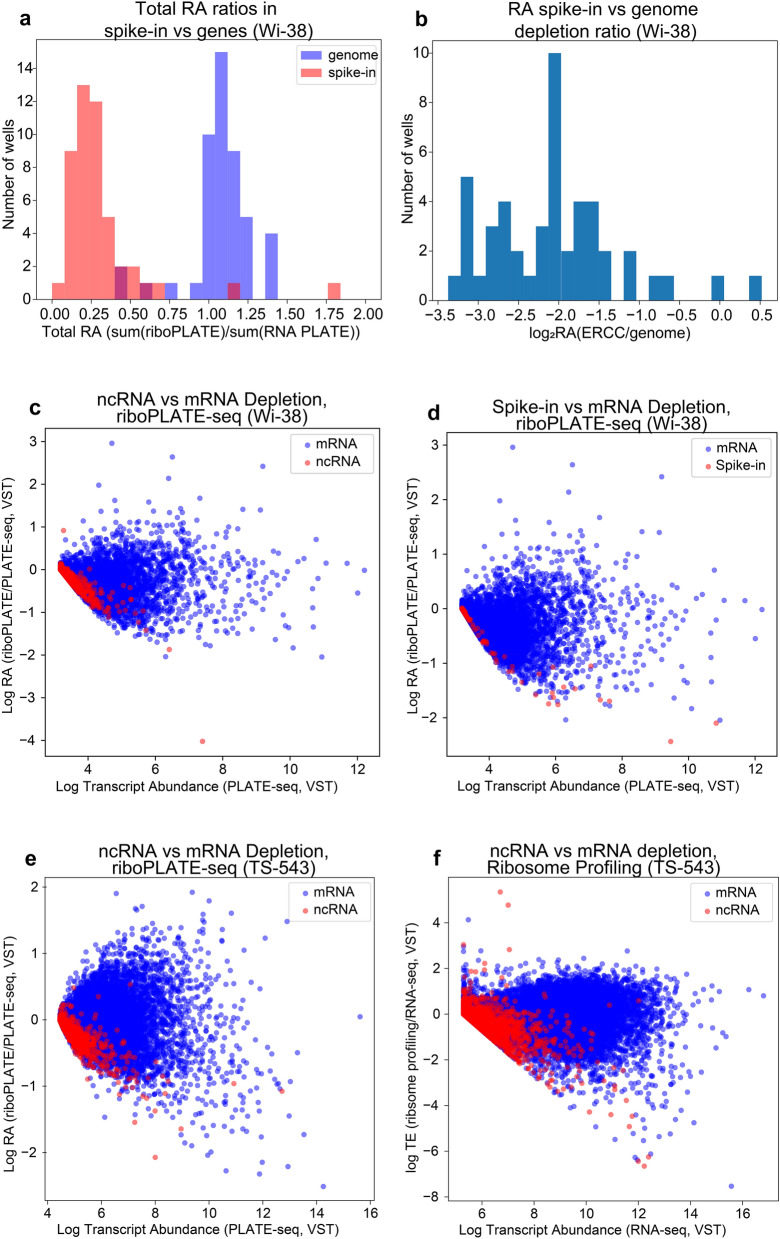
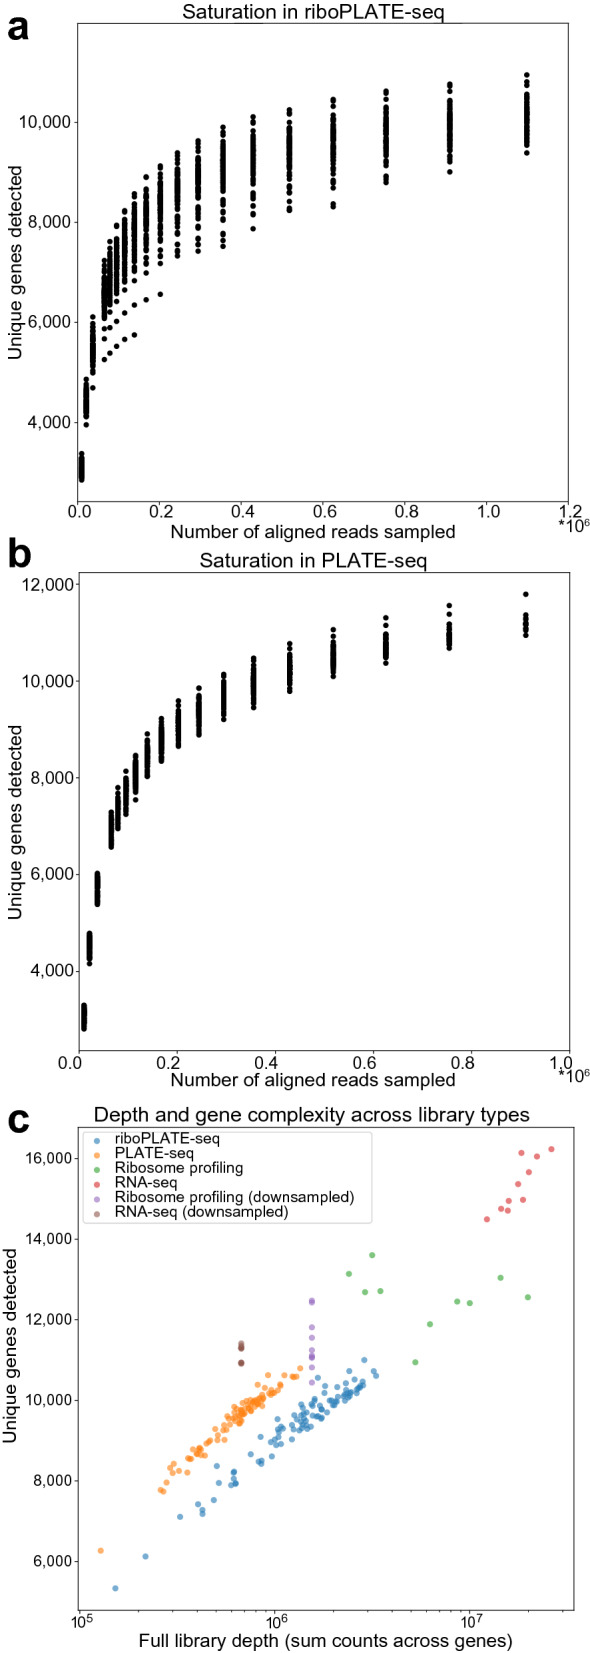
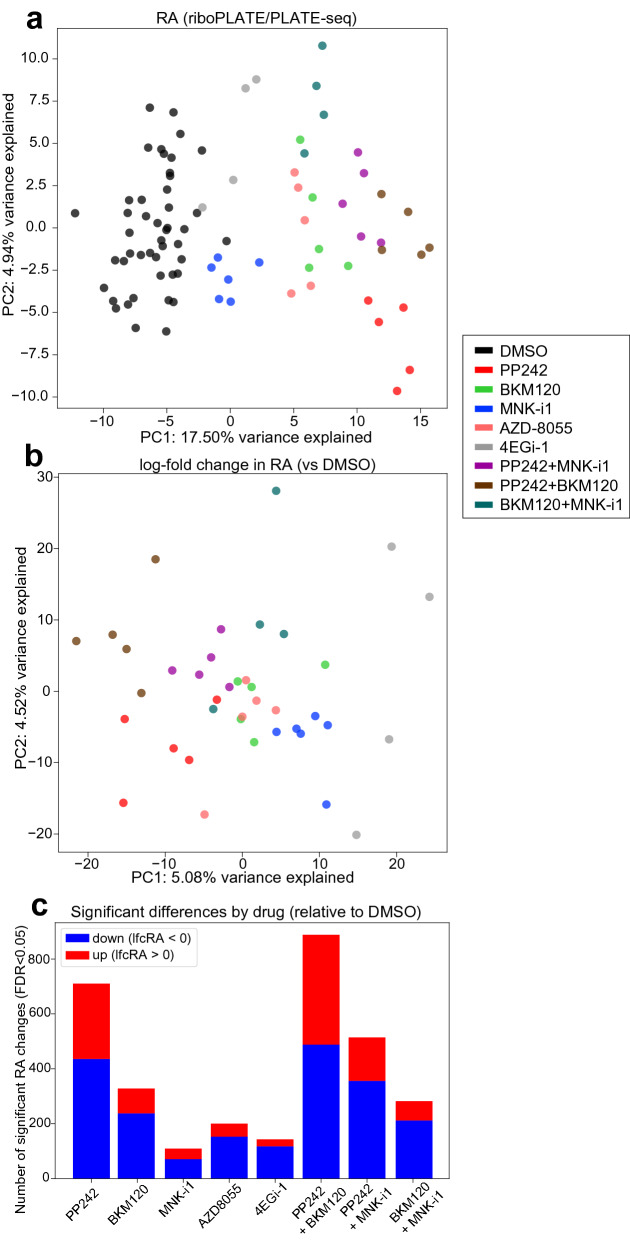
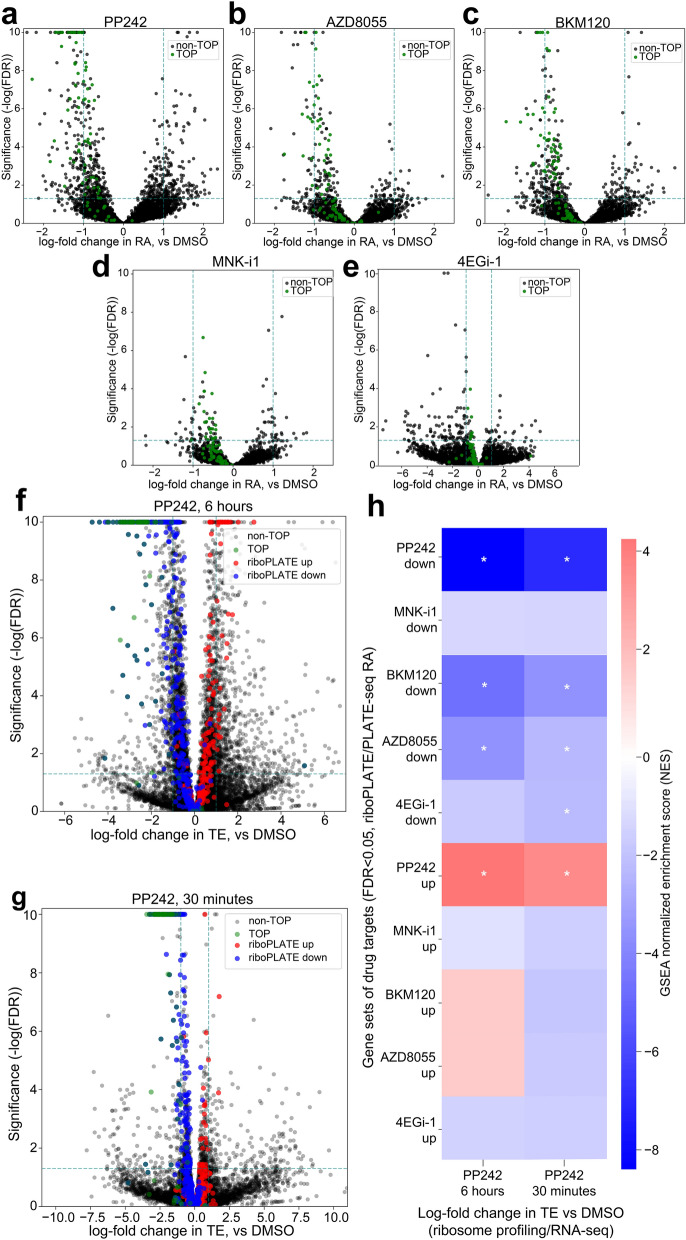
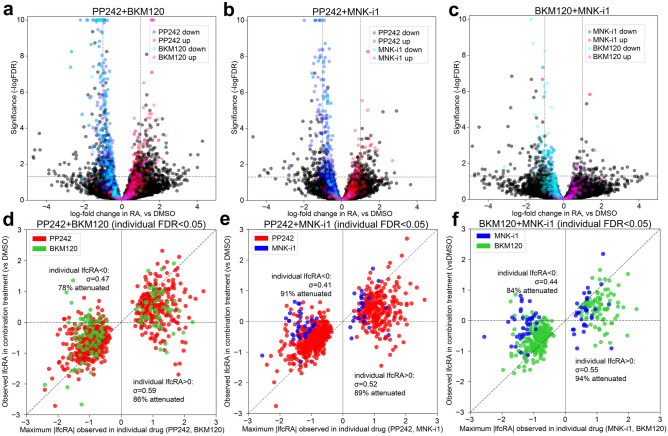
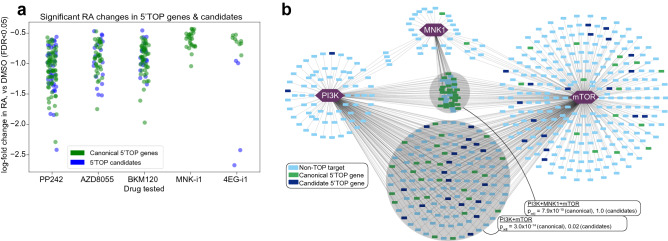
Protein synthesis is dysregulated in many diseases, but we lack a systems-level picture of how signaling molecules and RNA binding proteins interact with the translational machinery, largely due to technological limitations. Here we present riboPLATE-seq, a scalable method for generating paired libraries of ribosome-associated and total mRNA. As an extension of the PLATE-seq protocol, riboPLATE-seq utilizes barcoded primers for pooled library preparation, but additionally leverages anti-rRNA ribosome immunoprecipitation on whole polysomes to measure ribosome association (RA). We compare RA to its analogue in ribosome profiling and RNA sequencing, translation efficiency, and demonstrate both the performance of riboPLATE-seq and its utility in detecting translational alterations induced by specific inhibitors of protein kinases.


Conflict of interest statement

The authors declare no competing interests.

Figures

Figure 1
Figure 1
Overviews of the protocol and experimental design of the study performed. (a) Schematic diagram of the riboPLATE-seq protocol, from lysis in a multi-well plate to pooled library preparation. The right-hand side mirrors the original PLATE-seq protocol. In this workflow, an oligo(dT)-grafted plate captures polyadenylated RNA that can be reverse-transcribed with barcoded adapters, generating a plate of cDNA that may be pooled for library construction. The left side incorporates a pan-ribosome IP before PLATE-seq pooling and library preparation, generating instead a pooled library of ribosome-associated RNA. (b) Simplified structure of the signaling pathways under study and the specific protein targets considered. The PI3K/AKT/mTOR signaling axis at left converges with the MAPK/ERK pathway at right on eIF4E, early in the process of ribosome assembly (green box). The figure also outlines the inhibitors used in this study and their specific targets within these pathways. NVP-BKM120 is a PI3K inhibitor (orange), both AZD8055 and PP242 are mTOR inhibitors (blue and purple, respectively), MNK-i1 is a MNK1 inhibitor (green), and 4EGi-1 is a direct eIF4E inhibitor (black).
Figure 2
Figure 2
Assessment of riboPLATE-seq IP specificity. (a) Depletion calculated per-sample as the log2-ratio of the sum of all spike-in or gene-aligned counts in the riboPLATE-seq library over the same sum in the sample’s paired PLATE-seq library, using DESeq2-normalized counts (median of ratios normalization, R v4.0.5), in Wi-38 cells. Spike-ins show more significant depletion than genes in almost all wells (mean spike-in RA 0.25; mean genomic RA 1.04; Wilcoxon signed-rank test p = 1 × 10–9) (b) The same information in (a), presented as the per-well difference in depletion ratios for ERCC and the background genome, demonstrating significant depletion of spike-in RNA with IP in most libraries (mean log2 depletion ratio − 2.1). (c) Relationship between transcript abundance (in PLATE-seq) and RA (riboPLATE/PLATE-seq) for coding genes and non-coding RNA (ncRNA) in Wi-38 cells. ncRNA are heavily depleted (RA < 0) at all expression levels, to a greater extent than almost all genes. (d) Relationship between transcript abundance and RA for ERCC spike-ins vs coding genes in Wi-38, demonstrating a pronounced pattern of depletion in RA for spike-ins relative to mRNA across all expression levels. (e) Relationship between PLATE-seq transcript abundance and RA for coding genes vs ncRNA in TS-543 cells. (f) The corresponding plot to e derived from ribosome profiling and RNA sequencing data of TE and RNA-seq transcript abundance in TS-543 cells. Though the shape of the distribution is different, ncRNA still demonstrate lower TE than mRNA at higher expression levels.
Figure 3
Figure 3
Analysis of riboPLATE-seq library saturation, size, and complexity in TS-543 cells. (a), (b) Library saturation strip plots for ribosome-associated (riboPLATE-seq) and total RNA (PLATE-seq) libraries in this study. In each, the Y axis shows the number of unique genes detected in each sample at each subsampled read depth on the X axis, excluding libraries smaller than the subsampling depth. With ~ 10–11,000 unique genes detected, riboPLATE-seq and PLATE-seq are comparably saturated. (c) Scatter plots emphasizing the relationship between library size and complexity across library types. The Y axis represents the number of unique genes detected within a library; the X axis represents its size in summed gene counts. PLATE-seq and riboPLATE-seq are very similarly distributed, with PLATE-seq generating slightly more complex, smaller libraries than riboPLATE-seq. Ribosome profiling and RNA-seq generate larger, more complex libraries than either riboPLATE- or PLATE-seq, which retain their complexity with ~ 11,000 genes detected when downsampled to the average read depths of riboPLATE- and PLATE-seq, respectively.
Figure 4
Figure 4
Principal Component Analyses (PCA) of riboPLATE-seq data in TS-543 cells. (a) riboPLATE-seq ribosome association (RA, riboPLATE-seq-PLATE-seq), (b) difference in RA between each sample and the average across DMSO-treated samples (lfcRA), normalized by variance-stabilizing transform (VST) in DESeq2 (R v4.0.5). For both plots, the domain of the PCA was restricted to genes with significant changes in RA reported by DESeq2 for any drug treatment relative to DMSO, (FDR < 0.05, 1813 genes total; detailed in Fig. 4c). Drug treatments elicit changes consistent enough to yield clustering behavior among samples treated with the same drug in both analyses, as well as co-clustering of related drug treatments (e.g. BKM120, PP242, and AZD8055). Separation is also apparent between combination treatments and their constituent, individual drugs in each plot. (c) Significant effects of each drug determined in riboPLATE-seq by DESeq2 (Benjamini–Hochberg adjusted false discovery rate (FDR) < 0.05). Genes determined significantly up- or downregulated in ribosome association (RA) are tallied for each drug and combination treatment.
Figure 5
Figure 5
Characterization of Alterations in Ribosome Association (RA) and Comparison with Translation Efficiency (TE) from Ribosome Profiling and RNA Sequencing in TS-543 cells. (a)–(e) Volcano plots of log-fold change in RA per-gene associated with each drug treatment. In each plot, the X axis marks the size and direction of the observed change for each gene, while the Y axis scales inversely with p-value (− log10(p)) to provide a positive metric of significance; TOP motif-containing genes, the canonical targets of mTOR signaling, are colored red. Additionally, dashed lines at y =  − log10(0.05) and x =  + / − 1.0 provide an estimate of the number and magnitude of significantly up- and down-regulated genes for each condition. Significant TOP gene inhibition is seen in treatment with PP242, AZD8055, and BKM120, but less so with MNK-i1 and not at all with 4EGi-1. (f), (g) Volcano plots of log-fold change in TE per-gene associated with PP242 treatment for 30 min or 6 h, generated from ribosome profiling and RNA sequencing data. Guide lines at y =  − log10(0.05) and x =  + / − 1 provide gauges of the significance and magnitude of the effects on gene-wise TE at either time point. TOP motif-containing genes, in red, are highly and significantly downregulated in both (Mann–Whitney U test p = 2.9 × 10–46 and p = 1.2 × 10–38 for 6-h and 30-min treatment, respectively). In all volcano plots, genes with p-values less than p = 1 × 10–10 (y = 10) are given a maximum y-value of 10 to prevent skewing of the axes. (h) Enrichment heatmap using GSEA to compare signatures of differential TE (X axis) with sets of genes significantly up- or downregulated (DESeq2 FDR < 0.05) at the level of RA by different 6-h drug treatments determined with riboPLATE-seq. Gene sets found significantly enriched or depleted in lfcTE (GSEA Bonferroni-adjusted FWER < 0.05) are marked with asterisks (*). Genes affected by PP242, BKM120, and AZD8055 are concordantly altered in TE after 6 h of PP242 treatment, while only the genes impacted by PP242 at the level of RA are similarly affected in TE after 30 min of PP242 treatment, with all other gene sets demonstrating varying degrees of downregulation (GSEA Normalized Enrichment Score < 0).
Figure 6
Figure 6
Attenuation of Single-Drug Effects Under Combination Treatments in TS-543 cells. (a)(c) Volcano plots of changes in RA observed under drug combinations, color-coded with the upregulated (red, magenta) and downregulated (blue, cyan) significant targets (DESeq2 FDR < 0.05, R v4.0.5) of each combination’s constituent drugs. In each plot, the X axis marks each gene’s observed difference in RA under drug combination treatment relative to DMSO controls, and the Y axis scales inversely with p value (-log10(FDR)) to correlate positively with the effect’s significance. Significant targets of both constituent drugs are attenuated in their effects in all combinations, indicated by significance values below the guideline y =  − log10(0.05) and effect sizes reduced towards x = 0, relative to their distributions in the volcano plots in Fig. 5 (by definition y >  − log10 (0.05)). (d)(f) Scatterplots comparing the maximum observed effect in either individual drug on the X axis with its observed effect under combination treatment on the Y axis, for the set of genes significantly impacted by each drug combination’s two constituent drug treatments. Guidelines at Y = 0 and X = Y aid visualization of the attenuation in gene-specific effects of the individual drugs in combination. Most genes fall between Y = 0 and X = Y, indicating a lesser change in RA in the same direction under combination treatment compared with its maximum effect observed in singular treatments.
Figure 7
Figure 7
Distribution of TOP Motif-Containing Genes and Candidates in a Modeled Translational Control Network in TS-543 cells. (a) TOP genes and candidates significantly perturbed in RA by drug treatments. Strip plots along the X axis, labeled for each drug treatment in our riboPLATE-seq study, contain log-fold changes in RA (Y axis) for the genes exhibiting significant RA perturbations (FDR < 0.05) under each treatment relative to DMSO controls, excluding non-TOP-containing genes. TOP candidates behave similarly to canonical TOP genes, exhibiting decreased RA under treatment with mTOR axis inhibitors (PP242, AZD8055, BKM120) while MNK-i1 and 4EGi-1 elicit fewer significant alterations in these sets. (b) Network representation of targets of mTOR, PI3K, and MNK1, interpreted as the genes exhibiting significant decreases in RA under treatment with PP242, BKM120, and MNK-i1, respectively (FDR < 0.05). Targets are color-coded for identification as canonical 5’TOP motif-containing genes (green), TOP gene candidates with known mouse homologues (navy blue) and other genes (light blue). Shaded circles denote subsets of the network with significant enrichment of canonical and/or candidate TOP genes, with the Fisher’s exact test p-value for either set displayed. P-values are corrected for multiple testing over all gene sets and network intersections tested via Benjamini-Hochberg (false discovery rate/FDR) adjustment. The intersection of all three kinases is enriched for canonical TOP genes, but not candidates (Fisher’s exact test padj = 7.9 × 10–15 and padj = 1.0, respectively), while the intersection of PI3K and mTOR is significantly enriched for canonical TOP genes and less-significantly enriched for candidates (padj = 3.0 × 10–14 and padj = 0.02).

References

    1. Zoncu R, Efeyan A, Sabatini DM. mTOR: from growth signal integration to cancer, diabetes and ageing. Nat. Rev. Mol. Cell Biol. 2011;12:21–35. - PMC - PubMed
    1. Thoreen CC, et al. A unifying model for mTORC1-mediated regulation of mRNA translation. Nature. 2012;485:109–113. - PMC - PubMed
    1. Lahr, R. M. et al. La-related protein 1 (LARP1) binds the mRNA cap, blocking eIF4F assembly on TOP mRNAs. eLife6, e24146 (2017). - PMC - PubMed
    1. Ingolia NT, Ghaemmaghami S, Newman JRS, Weissman JS. Genome-wide analysis in vivo of translation with nucleotide resolution using ribosome profiling. Science. 2009;324:218–223. - PMC - PubMed
    1. Rodnina MV. The ribosome in action: Tuning of translational efficiency and protein folding. Protein Sci. 2016;25:1390–1406. - PMC - PubMed

Publication types

MeSH terms