. 2022 Apr;12(4):e742.
doi: 10.1002/ctm2.742.

Inhibition of CXXC5 function reverses obesity-related metabolic diseases

Affiliations

Inhibition of CXXC5 function reverses obesity-related metabolic diseases

Seol Hwa Seo et al. Clin Transl Med. 2022 Apr.

Abstract

Background: Metabolic diseases, including type 2 diabetes, have long been considered incurable, chronic conditions resulting from a variety of pathological conditions in obese patients. Growing evidence suggests the Wnt/β-catenin pathway is a major pathway in adipose tissue remodelling, pancreatic β-cell regeneration and energy expenditure through regulation of key metabolic target genes in various tissues. CXXC5-type zinc finger protein 5 (CXXC5) is identified negative feedback regulator of the Wnt/β-catenin pathway that functions via Dishevelled (Dvl) binding.

Methods: Expression level of CXXC5 was characterised in clinical samples and diabetes-induced mice model. Diabetes-induced mice model was established by using high-fat diet (HFD). HFD-fed mice treated with KY19334, a small molecule inhibiting CXXC5-Dvl protein-protein interaction (PPI), was used to assess the role of CXXC5 in metabolic diseases.

Results: Here, we show that CXXC5 is overexpressed with suppression of Wnt/β-catenin signalling in visceral adipose tissues of patients with obesity-related diabetes. Meanwhile, Cxxc5-/- mice fed an HFD exhibited resistance to metabolic dysregulation. KY19334 restores the lowered Wnt/β-catenin signalling and reverses metabolic abnormalities as observed in HFD-fed Cxxc5-/- mice. Administration of KY19334 on HFD-fed mice had a long-lasting glucose-controlling effect through remodelling of adipocytes and regeneration of pancreatic β-cells.

Conclusion: Overall, the inhibition of CXXC5 function by small molecule-mediated interference of Dvl binding is a potential therapeutic strategy for the treatment of obesity-related diabetes.

Keywords: CXXC5; Wnt/β-catenin pathway; adipose tissue remodelling; metabolic diseases; pancreatic β-cell regeneration.


Conflict of interest statement

The authors declare no competing interests exist.

Figures

FIGURE 1
FIGURE 1
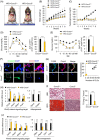
Expression of CXXC5, an inhibitor of the Wnt/β‐catenin pathway, in human adipose tissues of patients with obesity‐induced diabetes. (A) Hierarchical clustering and heat‐map of RNA‐seq data in visceral adipose tissues from women with obesity‐induced diabetes (n = 5 for all groups). The colour scale shows Z‐score fragments per kilobase of transcript per million mapped reads representing the mRNA levels of each gene in the blue (low expression) to red (high expression) coloured scheme. (B) Gene set enrichment analysis of microarray transcriptome data from BMI‐matched patients with diabetes for Wnt/β‐catenin signalling‐activated gene signature. Black columns indicate 83 enriched genes in visceral adipose tissues of subjects with normal glucose tolerance or diabetes, involving the Wnt/β‐catenin signalling pathway (n = 17 for all groups). NES, normalized enrichment score; ES, enrichment score; FDR, false discovery rate. (C–F) Expression levels of CXXC5 in visceral adipose tissues from lean and obese subjects (GEO: GSE16415, GSE15773, GSE27951, GSE2508) (C), in visceral adipose tissues from BMI‐matched obese patients suffering from insulin sensitivity and resistance (n = 5 per group) (D), in subcutaneous adipose tissues from subjects with normal glucose tolerance (NGT), impaired glucose tolerance (IGT) and T2DM (n = 4 per group) (E), in subcutaneous adipose tissues from lean and obese subjects (n = 10 per group) (F). Expression levels of mRNA were normalized by non‐diabetes (C), insulin sensitive (D), NGT (E), lean group (F). (G–I) Visceral adipose tissues from human subjects that were lean, obese, diabetic and obese‐diabetic (n = 4 per group). Representative IHC images of CXXC5 and β‐catenin in visceral adipose tissue and quantitative analyses of IHC staining for CXXC5 and β‐catenin (G: upper panel). The quantitative mean intensity value of IHC staining of CXXC5 and β‐catenin was performed (G: lower panel), correlation of CXXC5 expression (H) and β‐catenin expression (I) with BMI. (J, K) Cxxc5+/+ mice were fed HFD or NCD for 8 weeks (n = 6 per group). Relative Cxxc5 mRNA expression in epiWAT, scWAT, liver, pancreas, kidney, muscle and heart tissues was normalized by NCD‐fed mice group (J) and β‐catenin and Cxxc5 expression in epiWAT, scWAT and liver tissues (n = 3 per group) (K). Scale bars = 100 μm. All data are presented as the mean ± SD. *p < 0.05, ***p < 0.001 determined by Student's t‐test. # p < 0.05, ## p < 0.01, ### p < 0.001 determined by Tukey's post hoc test
FIGURE 2
FIGURE 2
Ablation of Cxxc5 resists obesity‐related insulin resistance and hepatosteatosis in HFD‐fed mice. (A–E) Cxxc5+/+ and Cxxc5−/− mice were fed HFD or NCD for 8 weeks (n = 9–13 per group). Representative photographs of HFD‐fed Cxxc5+/+ and Cxxc5−/− mice (A), body weight (B), fasting glucose levels (C), glucose tolerance test (D) and insulin tolerance test (E) and area under the curve (AUC). (F, G) epiWAT from Cxxc5+/+ and Cxxc5−/− mice fed HFD for 8 weeks (n = 9–13 per group). Representative images of IHC staining for β‐catenin, Cxxc5 (F), F4/80 and Cxxc5 (G: left panel) and the correlation of cytosolic Cxxc5 with the number of CLSs (G: right panel). (H) Relative expression levels of Wnt/β‐catenin pathway target (left panel) and adipogenesis (right) genes. Expression levels of mRNA were normalized by HFD‐fed Cxxc5+/+ mice group. (I, J) Liver tissue from Cxxc5+/+ and Cxxc5−/− mice fed HFD for 8 weeks (n = 9–13 per group). Representative images of H&E staining and Oil Red O staining (I: left panel) and TG concentration in the liver tissue (I: right panel) and relative mRNA expression levels of Wnt/β‐catenin signalling target and gluconeogenic genes (J). Expression levels of mRNA were normalized by HFD‐fed Cxxc5+/+ mice group. Scale bars = 100 μm. All data are presented as the mean ± SD. *p < 0.05, **p < 0.01, ***p < 0.001 determined by Student's t‐test
FIGURE 3
FIGURE 3
Treatment with KY19334, CXXC5‐Dvl PPI inhibitor, improves obesity‐related insulin resistance with long‐lasting effect. C57BL/6 mice fed NCD or HFD for 18 weeks were p.o. administered KY19334 (25 mg/kg/d) or sitagliptin (50 mg/kg/d) for 5 days on weeks 8 and 12 (n = 10 per group). (A) Fasting glucose. (B) Glucose and insulin tolerance tests and area under the curve (AUC). (C) Plasma insulin concentration in the overnight fasted state (left panel) and HOMA‐IR (right panel). (D) Percentage of fat and lean mass. (E) The mouse adipokine and adipokine‐related protein array in plasma (left panel). The quantification mean intensity values of proteins of angiopoietin‐like protein‐3 (ANGPTL‐3), DPP4, IGFBP‐5, Leptin, Resistin and PAI‐1 (right panel). (F) Flow cytometry analysis of the expression of F4/80 and Cd11b and percentage of F4/80+Cd11b+ cells are shown. (G) Representative IHC images for β‐catenin, Cxxc5. (H) Representative IHC images for F4/80 and Cxxc5. (I) The correlation of cytosolic Cxxc5 and nucleus β‐catenin expression with the number of CLSs. Scale bars = 100 μm. All data are presented as the mean ± SD. *p < 0.05, **p < 0.01, ***p < 0.001 determined by Student's t‐test
FIGURE 4
FIGURE 4
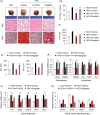
KY19334 treatment improves hepatic glucose homeostasis. C57BL/6 mice fed NCD or HFD for 18 weeks were p.o. administered KY19334 (25 mg/kg/d) or sitagliptin (50 mg/kg/d) for 5 days on weeks 8 and 12 (n = 10 per group). (A) Representative images (n = 10 independent experiments) of the liver, H&E staining and Oil Red O staining. (B) TG concentration in the liver tissues. (C) Plasma concentration of FFA. (D) Plasma concentration of ALT and AST. (E–G) Relative mRNA expression of lipogenesis (E), gluconeogenesis (F) and Wnt/β‐catenin signalling target genes (G) was normalized by vehicle‐treated HFD mice group. All data are presented as the mean ± SD. *p < 0.05, **p < 0.01, ***p < 0.001 determined by Student's t‐test
FIGURE 5
FIGURE 5
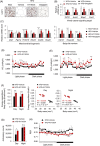
KY19334 treatment increases energy expenditure. C57BL/6 mice fed NCD or HFD for 18 weeks were p.o. administered KY19334 (25 mg/kg/d) or sitagliptin (50 mg/kg/d) for 5 days on weeks 8 and 12 (n = 10 per group). (A) Representative images (three total images per group) of UCP1 immunohistochemistry in scWAT. (B, C) Relative mRNA expression levels of Wnt/β‐catenin signalling target genes (B), mitochondrial biogenesis and beige fat markers (C) were normalized by vehicle‐treated HFD mice group. (D) Oxygen consumption. (E) Carbon dioxide production. (F) Energy expenditure normalized for body mass (left panel). Correlation of energy expenditure by body mass using covariance (middle and right panel). (G) Cumulative ambulatory counts. (H) Respiratory exchange ratios. Scale bars = 100 μm. All data are presented as the mean ± SD. *p < 0.05, **p < 0.01, ***p < 0.001 determined by Student's t‐test
FIGURE 6
FIGURE 6
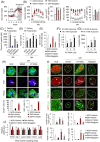
KY19334 treatment restores β‐cell mass and functions in HFD‐fed and STZ‐induced diabetes mellitus (DM) mice. C57BL/6 mice fed NCD or HFD for 4 weeks followed by injection with STZ (50 mg/kg/d) for 1 week. Afterward, mice were p.o. administered KY19334 (25 mg/kg/d) or sitagliptin (50 mg/kg/d) for 4 weeks (n = 6 per group). (A) Non‐fasting blood glucose levels. (B) Glucose tolerance and insulin tolerance test and AUC. (C–E) The concentration of plasma C‐peptide (C), insulin (D) and serum active GLP‐1 (E). (F–H) Isolated islets from the pancreas of NCD or DM mice treated with DMSO or KY19334 for 72 h. The concentration of secreted insulin (F) and C‐peptide (G) from islets in response to different concentrations measured after incubation for 1 h with either low (2.8 mM) or high (16.7 mM) glucose in KRBH buffer. (H) Representative images of immunofluorescent staining for insulin and Ki67 (upper panel). Quantitative analyses of insulin‐ and Ki67‐positive cells, respectively, in the islets (lower panel). (I) Representative images of IHC staining of the pancreas for insulin, β‐catenin, PCNA, Pdx‐1 and Ki67. Arrows indicate proliferating β‐cells (upper panel). Quantitative analyses of insulin‐positive β‐cell mass, PCNA, Pdx‐1 and Ki67 positive cells in pancreatic tissues (lower panel). (J) Relative mRNA expression of Wnt/β‐catenin signalling target genes. Expression levels of mRNA were normalized by vehicle‐treated HFD mice group. Scale bars = 100 μm. All data are presented as the mean ± SD. *p < 0.05, **p < 0.01, ***p < 0.001 determined by Student's t‐test. DM: Diabetes mellitus; β‐cat: β‐catenin

Similar articles

Cited by

References

    1. Chaudhury A, Duvoor C, Dendi VSR, et al. Clinical review of antidiabetic drugs: implications for type 2 diabetes mellitus management. Front Endocrinol (Lausanne). 2017;8:6. - PMC - PubMed
    1. DeFronzo RA, Triplitt CL, Abdul‐Ghani M, Cersosimo E. Novel agents for the treatment of type 2 diabetes. Diabetes Spectr. 2014;27:100‐112. - PMC - PubMed
    1. Marin‐Penalver JJ, Martin‐Timon I, Sevillano‐Collantes C, Del Canizo‐Gomez FJ. Update on the treatment of type 2 diabetes mellitus. World J Diabetes. 2016;7:354‐395. - PMC - PubMed
    1. Bastakoty D, Young PP. Wnt/beta‐catenin pathway in tissue injury: roles in pathology and therapeutic opportunities for regeneration. FASEB J. 2016;30:3271‐3284. - PMC - PubMed
    1. Janda CY, Dang LT, You C, et al. Surrogate Wnt agonists that phenocopy canonical Wnt and beta‐catenin signalling. Nature. 2017;545:234‐237. - PMC - PubMed

MeSH terms

LinkOut - more resources