

doi: 10.1002/ctm2.788.
Partial restoration of gut-mucosal dysbiosis in late-treated HIV-infected subjects with CD4 T-cell recovery
Affiliations
- PMID: 35384348
- PMCID: PMC8982320
- DOI: 10.1002/ctm2.788
Item in Clipboard
Partial restoration of gut-mucosal dysbiosis in late-treated HIV-infected subjects with CD4 T-cell recovery
Clin Transl Med.
2022 Apr.
No abstract available
Conflict of interest statement
The authors declare no conflict of interests.
Figures
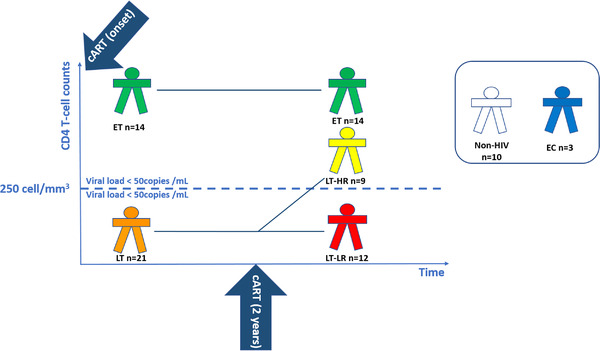
Schematic diagram showing the selection criteria and number of subjects enrolled in each study group. The following human immunodeficiency virus (HIV)‐treated groups (ET, LT‐HR and LT‐LR) were recruited according to immunological criteria: early‐treated (ET, n = 14), who started cART with >250 CD4 T cells/mm3 and remained >250 CD4 T cells/mm3 2 years later; late‐treated high recovery (LT‐HR, n = 9), starting last cART with <250 CD4 T cells/mm3 but reaching >250 CD4 T cells/mm3 2 years later; late‐treated low‐recovery (LT‐LR, n = 12), starting cART with <250 CD4 T cells/mm3 and remaining <250 CD4 T cells/mm3 2 years later. All these cART‐treated HIV‐infected subjects were virologically suppressed (<50 HIV RNA copies/ml). Additionally, a reduced group of elite controllers (EC, n = 3) was also included. EC are HIV‐subjects with spontaneous virological suppression in the absence of cART. Control healthy subjects (n = 10) were individuals with similar age and sex characteristics to those of treated HIV‐subjects. Blood and biopsy samples of ileum and caecum mucosa were taken during colonoscopy procedures made a variable time after compliance of 2 years of cART as the classification period. All subjects maintained their classification criteria at the moment of collection of samples. Exclusion criteria for this study were having HIV rebounds during the classification period and until the recruitment; intestinal infections, cancer, active hepatitis C virus (HCV) infection or concurrent inflammatory processes at the moment of recruitment. All the subjects enrolled in this study were properly informed and signed the corresponding informed consents either for the colonoscopy and the experimental study. ET, early‐treated; LT, late‐treated; LT‐HR, late‐treated high recovery; LT‐LR, late‐treated low recovery; EC, elite controllers; cART, combined antiretroviral therapy
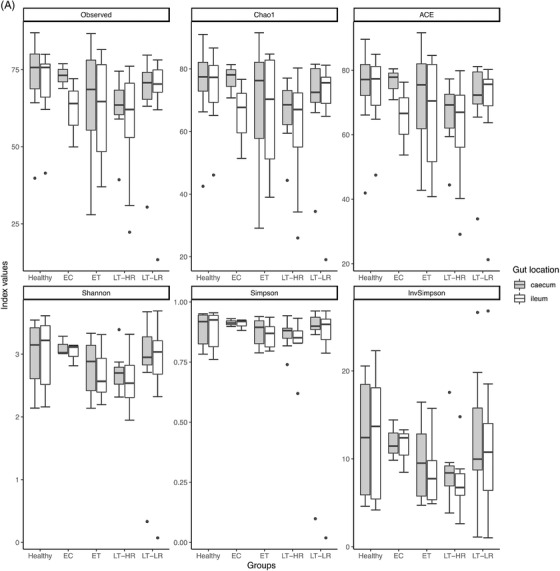
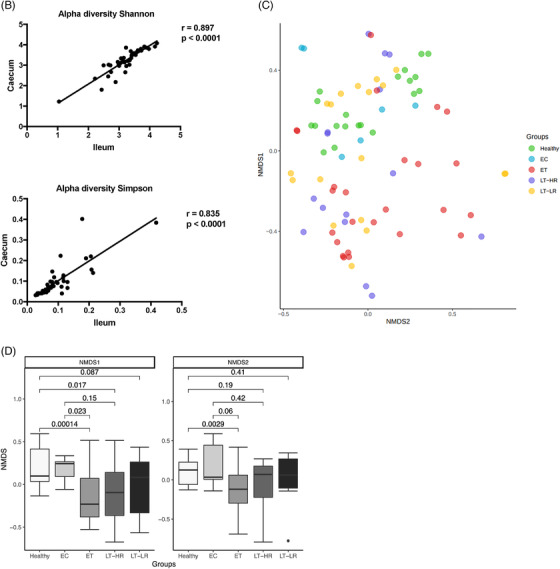
Richness and diversity measures of the microbiota obtained from gut mucosal samples of subjects included in the study groups. Sequencing data of microbial 16S rRNA were processed with Mothur (version 1.43.0), using SILVA (non‐redundant version 138) and Greengenes (version 13_8_99) databases for aligning and taxonomic purposes, respectively. Operational taxonomic units (OTUs) picking was performed at 97% sequence similarity to detect subgenera. Subsequent data analysis was accomplished using the Phyloseq package (R version 3.6.3). Only bacterial taxa present at least in 50% of the analysed samples were considered. (A) Different richness (Chao1 and ACE) and alpha diversity (Shannon and Simpson) indexes were calculated using Phyloseq and Vegan packages from R, and compared among study groups according to the location of sampling area for biopsies, caecum or ileum mucosa (dots represent outliers). (B) Spearman's Rho Coefficient was used to correlate Shannon and Simpson alpha diversity values between caecum and ileum samples of all the groups studied. (C) Non‐metric multidimensional scaling (NMDS) analysis for beta microbiome diversity of ileum and caecum samples from study groups’ subjects, choosing Morisita‐Horn index as it yielded the lowest stress value. Coloured dots represent samples from the different groups according to the legend on the right. (D) NMDS analysis separated by axes, NMDS1, and 2, showing distances among samples of the five study groups (dots represent outliers). Kruskal–Wallis rank sum tests, followed by post hoc Tukey's procedure, were used to test for differences in alpha diversity measures and NMDS axes among study groups. Differences in beta diversity were tested using PERMANOVA and HOMOVA procedures. p < .05 indicates a statistically significant association. EC, elite controllers; ET, early‐treated; LT‐HR, late‐treated high recovery; LT‐LR, late‐treated low recovery; r, Spearman's rho
Richness and diversity measures of the microbiota obtained from gut mucosal samples of subjects included in the study groups. Sequencing data of microbial 16S rRNA were processed with Mothur (version 1.43.0), using SILVA (non‐redundant version 138) and Greengenes (version 13_8_99) databases for aligning and taxonomic purposes, respectively. Operational taxonomic units (OTUs) picking was performed at 97% sequence similarity to detect subgenera. Subsequent data analysis was accomplished using the Phyloseq package (R version 3.6.3). Only bacterial taxa present at least in 50% of the analysed samples were considered. (A) Different richness (Chao1 and ACE) and alpha diversity (Shannon and Simpson) indexes were calculated using Phyloseq and Vegan packages from R, and compared among study groups according to the location of sampling area for biopsies, caecum or ileum mucosa (dots represent outliers). (B) Spearman's Rho Coefficient was used to correlate Shannon and Simpson alpha diversity values between caecum and ileum samples of all the groups studied. (C) Non‐metric multidimensional scaling (NMDS) analysis for beta microbiome diversity of ileum and caecum samples from study groups’ subjects, choosing Morisita‐Horn index as it yielded the lowest stress value. Coloured dots represent samples from the different groups according to the legend on the right. (D) NMDS analysis separated by axes, NMDS1, and 2, showing distances among samples of the five study groups (dots represent outliers). Kruskal–Wallis rank sum tests, followed by post hoc Tukey's procedure, were used to test for differences in alpha diversity measures and NMDS axes among study groups. Differences in beta diversity were tested using PERMANOVA and HOMOVA procedures. p < .05 indicates a statistically significant association. EC, elite controllers; ET, early‐treated; LT‐HR, late‐treated high recovery; LT‐LR, late‐treated low recovery; r, Spearman's rho
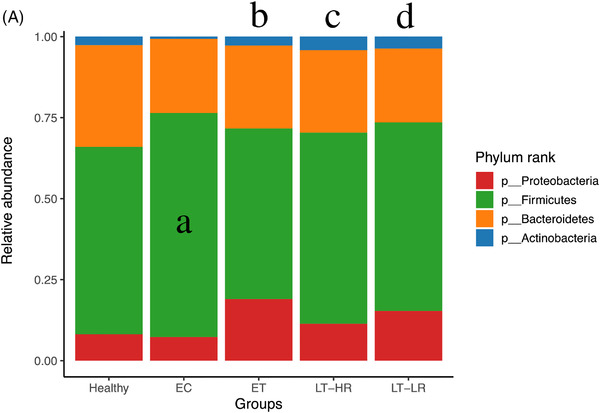
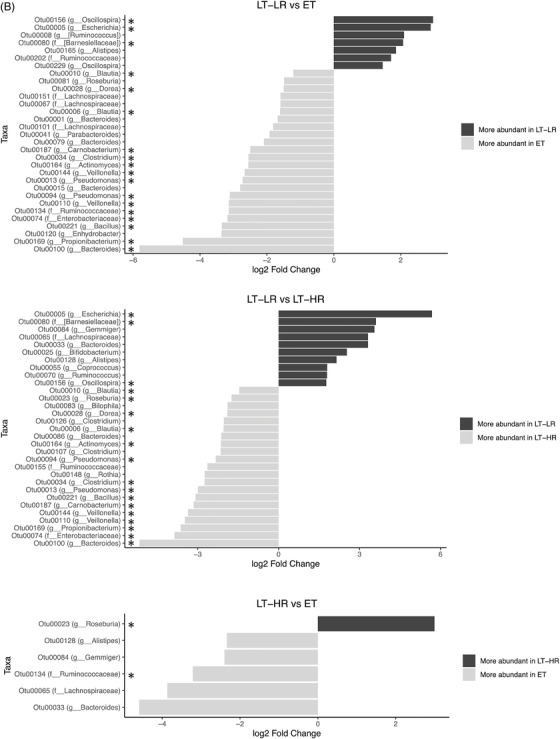
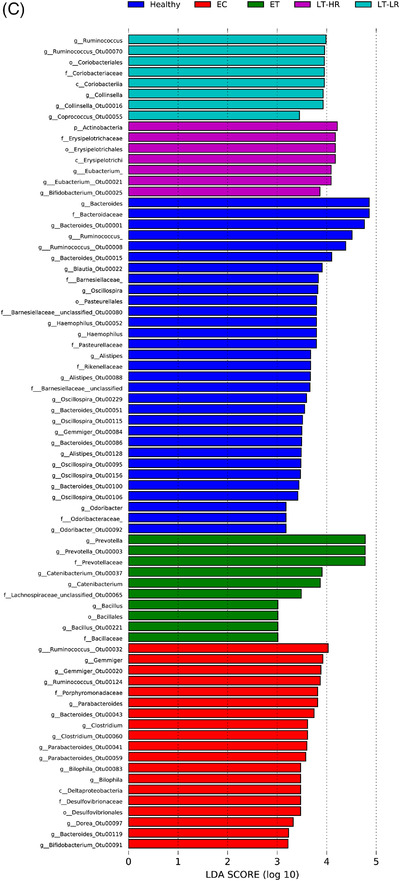
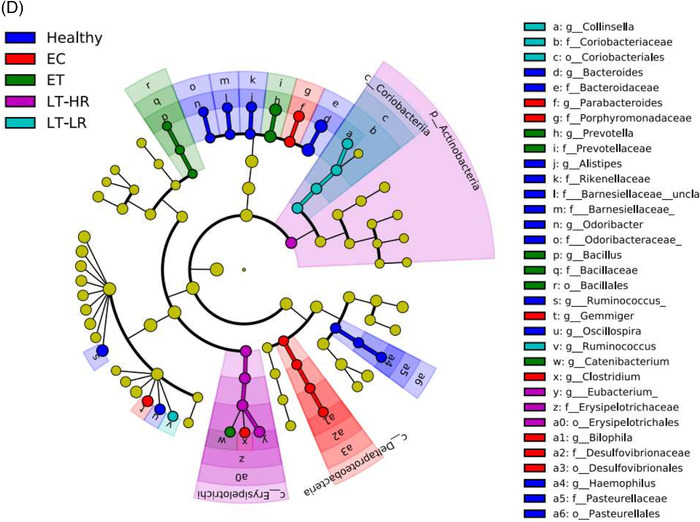
Comparison of relative abundances of different microbiome taxa derived from operational taxonomic units (OTUs) obtained in gut mucosal samples of study subjects. DESeq2 and LefSe methods were used in order to detect differentially abundant OTUs. For DESeq2, one pseudocount was added to the raw counts before performing the analysis and a false discovery rate (FDR) threshold of .05 was considered. LefSe analysis was done with default parameters, using rarefied counts. (A) Diagram of accumulated bars showing OTUs from gut mucosal biopsies grouped in different phyla. The length of each coloured bar within the study groups represents the relative abundance (out of 1) of a bacterial phylum (according to the legend on the right). a: phylum with a significantly different relative abundance (p < .05) respect to the rest of the groups; b, c and d: phylum with a significantly different relative abundance (p < .05) respect to EC group. (B) Comparison of OTUs with significantly higher relative abundances obtained from gut‐mucosal microbiota of the three treated human immunodeficiency virus (HIV)‐groups when these groups were faced by pairs. These comparisons were selected among the total 10 comparisons established among the five study groups that can be seen at Figure S4A. Asterisks point to those OTUs that depict similarity between ET and LT‐HR groups (coinciding in these two groups when compared with LT‐LR), and dissimilarity among these two and LT‐LR. (C) LEfSe analysis result showing linear discriminant analysis (LDA) scores for the most representative differentially abundant OTUs (with a relative abundance more than three times higher in a group) found when gut samples of the five study groups were compared among them. (D) Cladogram depicting the phylogenetic relationships established between the different taxonomic levels corresponding to OTUs obtained by LEfSe analysis of the gut samples from study groups (coloured boxes on the right represent microbial families and genera, but not OTUs, to improve visualization). Kruskal–Wallis rank sum tests, followed by post hoc Tukey's procedure, were used to test for inter‐group differences in relative abundance. EC, elite controllers; ET, early‐treated; LT‐HR, late‐treated high recovery; LT‐LR, late‐treated low recovery; f, family; g, genus
Comparison of relative abundances of different microbiome taxa derived from operational taxonomic units (OTUs) obtained in gut mucosal samples of study subjects. DESeq2 and LefSe methods were used in order to detect differentially abundant OTUs. For DESeq2, one pseudocount was added to the raw counts before performing the analysis and a false discovery rate (FDR) threshold of .05 was considered. LefSe analysis was done with default parameters, using rarefied counts. (A) Diagram of accumulated bars showing OTUs from gut mucosal biopsies grouped in different phyla. The length of each coloured bar within the study groups represents the relative abundance (out of 1) of a bacterial phylum (according to the legend on the right). a: phylum with a significantly different relative abundance (p < .05) respect to the rest of the groups; b, c and d: phylum with a significantly different relative abundance (p < .05) respect to EC group. (B) Comparison of OTUs with significantly higher relative abundances obtained from gut‐mucosal microbiota of the three treated human immunodeficiency virus (HIV)‐groups when these groups were faced by pairs. These comparisons were selected among the total 10 comparisons established among the five study groups that can be seen at Figure S4A. Asterisks point to those OTUs that depict similarity between ET and LT‐HR groups (coinciding in these two groups when compared with LT‐LR), and dissimilarity among these two and LT‐LR. (C) LEfSe analysis result showing linear discriminant analysis (LDA) scores for the most representative differentially abundant OTUs (with a relative abundance more than three times higher in a group) found when gut samples of the five study groups were compared among them. (D) Cladogram depicting the phylogenetic relationships established between the different taxonomic levels corresponding to OTUs obtained by LEfSe analysis of the gut samples from study groups (coloured boxes on the right represent microbial families and genera, but not OTUs, to improve visualization). Kruskal–Wallis rank sum tests, followed by post hoc Tukey's procedure, were used to test for inter‐group differences in relative abundance. EC, elite controllers; ET, early‐treated; LT‐HR, late‐treated high recovery; LT‐LR, late‐treated low recovery; f, family; g, genus
Comparison of relative abundances of different microbiome taxa derived from operational taxonomic units (OTUs) obtained in gut mucosal samples of study subjects. DESeq2 and LefSe methods were used in order to detect differentially abundant OTUs. For DESeq2, one pseudocount was added to the raw counts before performing the analysis and a false discovery rate (FDR) threshold of .05 was considered. LefSe analysis was done with default parameters, using rarefied counts. (A) Diagram of accumulated bars showing OTUs from gut mucosal biopsies grouped in different phyla. The length of each coloured bar within the study groups represents the relative abundance (out of 1) of a bacterial phylum (according to the legend on the right). a: phylum with a significantly different relative abundance (p < .05) respect to the rest of the groups; b, c and d: phylum with a significantly different relative abundance (p < .05) respect to EC group. (B) Comparison of OTUs with significantly higher relative abundances obtained from gut‐mucosal microbiota of the three treated human immunodeficiency virus (HIV)‐groups when these groups were faced by pairs. These comparisons were selected among the total 10 comparisons established among the five study groups that can be seen at Figure S4A. Asterisks point to those OTUs that depict similarity between ET and LT‐HR groups (coinciding in these two groups when compared with LT‐LR), and dissimilarity among these two and LT‐LR. (C) LEfSe analysis result showing linear discriminant analysis (LDA) scores for the most representative differentially abundant OTUs (with a relative abundance more than three times higher in a group) found when gut samples of the five study groups were compared among them. (D) Cladogram depicting the phylogenetic relationships established between the different taxonomic levels corresponding to OTUs obtained by LEfSe analysis of the gut samples from study groups (coloured boxes on the right represent microbial families and genera, but not OTUs, to improve visualization). Kruskal–Wallis rank sum tests, followed by post hoc Tukey's procedure, were used to test for inter‐group differences in relative abundance. EC, elite controllers; ET, early‐treated; LT‐HR, late‐treated high recovery; LT‐LR, late‐treated low recovery; f, family; g, genus
Comparison of relative abundances of different microbiome taxa derived from operational taxonomic units (OTUs) obtained in gut mucosal samples of study subjects. DESeq2 and LefSe methods were used in order to detect differentially abundant OTUs. For DESeq2, one pseudocount was added to the raw counts before performing the analysis and a false discovery rate (FDR) threshold of .05 was considered. LefSe analysis was done with default parameters, using rarefied counts. (A) Diagram of accumulated bars showing OTUs from gut mucosal biopsies grouped in different phyla. The length of each coloured bar within the study groups represents the relative abundance (out of 1) of a bacterial phylum (according to the legend on the right). a: phylum with a significantly different relative abundance (p < .05) respect to the rest of the groups; b, c and d: phylum with a significantly different relative abundance (p < .05) respect to EC group. (B) Comparison of OTUs with significantly higher relative abundances obtained from gut‐mucosal microbiota of the three treated human immunodeficiency virus (HIV)‐groups when these groups were faced by pairs. These comparisons were selected among the total 10 comparisons established among the five study groups that can be seen at Figure S4A. Asterisks point to those OTUs that depict similarity between ET and LT‐HR groups (coinciding in these two groups when compared with LT‐LR), and dissimilarity among these two and LT‐LR. (C) LEfSe analysis result showing linear discriminant analysis (LDA) scores for the most representative differentially abundant OTUs (with a relative abundance more than three times higher in a group) found when gut samples of the five study groups were compared among them. (D) Cladogram depicting the phylogenetic relationships established between the different taxonomic levels corresponding to OTUs obtained by LEfSe analysis of the gut samples from study groups (coloured boxes on the right represent microbial families and genera, but not OTUs, to improve visualization). Kruskal–Wallis rank sum tests, followed by post hoc Tukey's procedure, were used to test for inter‐group differences in relative abundance. EC, elite controllers; ET, early‐treated; LT‐HR, late‐treated high recovery; LT‐LR, late‐treated low recovery; f, family; g, genus
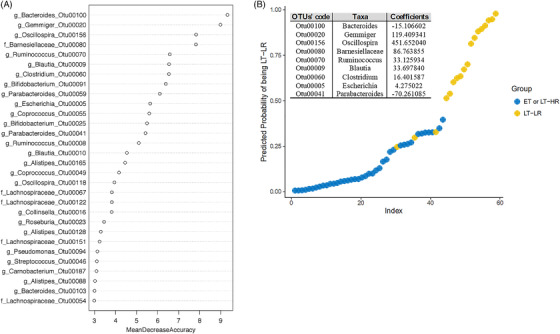
Calculations for an abundance‐based operational taxonomic units (OTUs) signature to predict immune progression of human immunodeficiency virus (HIV)‐infected subjects from their gut mucosal microbiota. Relative abundances from rarefied counts were used as input to 1000 random forests, and out‐of‐bag error was computed using the randomForest package in R. Initial analysis was performed with samples of the three treated HIV‐groups separated, but a classification error of 73% with LT‐HR samples, as many of them were assimilated as ET, and an out‐of‐bag error of 35% uncovered the great overlap existing between ET and LT‐HR groups. Once grouped together for further analyses, the out‐of‐bag error decreased to 12%. Given the multi‐collinearity of some OTUs, Lasso (L1‐norm) regularization was performed using R glmnet package, selecting the lambda through k‐3 cross‐validation, which minimizes the error in order to remove less relevant and multi‐collinear features (OTUs) before performing the logistic regression analysis. ROC curves were computed using InformationValue package in R. (A) Random forest (RF) analysis showing the best 30 OTUs to classify samples in either ET/LT‐HR or LT‐LR groups, showing their respective mean decrease accuracies (MDA). (B) Multivariable logistic regression model built from the 14 best predictors in RF (MDA > 5) yielding a signature of nine OTUs, whose log‐odds coefficients are shown in the table, that discriminate samples belonging to ET/LT‐HR or LT‐LR groups with a minimum misclassification error of 5% and area under curve (AUC) of .97 in an ROC analysis. ET, early‐treated; LT‐HR, late‐treated high recovery; LT‐LR, late‐treated low recovery; f, family; g, genus
Comment in
-
HIV-associated dysbiosis and immune recovery during antiretroviral therapy.Clin Transl Discov. 2022 Jun;2(2):e58. doi: 10.1002/ctd2.58. Epub 2022 Apr 28. Clin Transl Discov. 2022. PMID: 36189116 Free PMC article.
References
-
- Vázquez‐Castellanos JF, Serrano‐Villar S, Latorre A, et al. Altered metabolism of gut microbiota contributes to chronic immune activation in HIV‐infected individuals. Mucosal Immunol. 2015;8:760‐772. - PubMed
Publication types
MeSH terms
LinkOut - more resources
Full Text Sources
Medical
Research Materials