

Combining remaining life expectancy and time to death as a measure of old-age dependency related to health care needs
- PMID: 35384565
- PMCID: PMC8985398
- DOI: 10.1007/s10754-022-09328-7
Combining remaining life expectancy and time to death as a measure of old-age dependency related to health care needs
Abstract
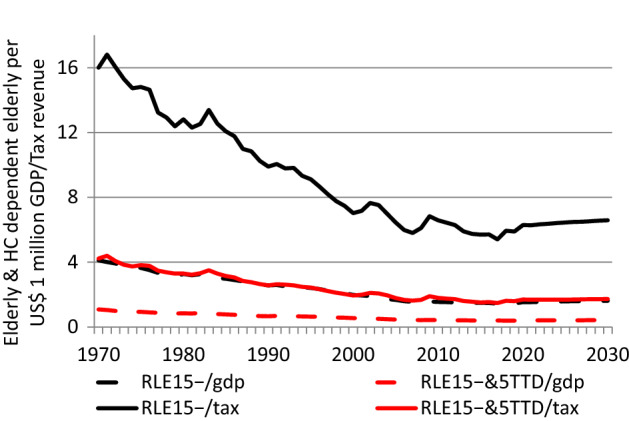
Public concern about the rising number of older dependent citizens is still based mainly on standard population aging indicators. This includes the old-age dependency ratio (OADR), which divides the state pension age population by the working age population. However, the OADR counts neither the dependent elderly nor those who provide for them. This paper builds on previous research to propose several alternative indicators, including the health care (HC) need-adjusted real elderly dependency ratio and the HC need-adjusted dependent population-to-tax rate. These indicators consider improvements in old-age survival and time to death in order to better define the health care needs of the dependent old-age population and to better approximate their financial burden. We define the old-age population dependent on health care as those above the age at which remaining life expectancy is 15 years or less and are expected to die within 5 years. We use data from the US to illustrate differences between the proposed new and standard measures. Results show that, as a share of the total population, the old-age population dependent on health care has virtually not changed since 1950. Moreover, increases in GDP and state tax revenue have outstripped population aging almost continuously since 1970, irrespective of the indicator used, and they are expected to continue to do so during the coming decade. The demand for health care services is therefore not being fueled by population aging but instead by other factors such as progress in medical knowledge and technology, costs of hospitalization, and the increasing use of long-term care facilities.
Keywords: Ageing; Economic measures of aging; Health care; Life expectancy; Measures of population aging; Time to death; United States.
© 2022. The Author(s), under exclusive licence to Springer Science+Business Media, LLC, part of Springer Nature.
Figures


References
-
- Bongaarts J. Population aging and the rising cost of public pensions. Population and Development Review. 2004;30(1):1–23. doi: 10.1111/j.1728-4457.2004.00001.x. - DOI
-
- Cocco JF, Gomes FJ. Longevity risk, retirement savings, and financial innovation. Journal of Financial Economics. 2012;103(3):507–529. doi: 10.1016/j.jfineco.2011.10.002. - DOI
MeSH terms
Grants and funding
LinkOut - more resources
Full Text Sources
Medical