. 2022 Apr 19;145(16):1238-1253.
doi: 10.1161/CIRCULATIONAHA.121.056265. Epub 2022 Apr 6.

Muscle LIM Protein Force-Sensing Mediates Sarcomeric Biomechanical Signaling in Human Familial Hypertrophic Cardiomyopathy

Affiliations

Muscle LIM Protein Force-Sensing Mediates Sarcomeric Biomechanical Signaling in Human Familial Hypertrophic Cardiomyopathy

Muhammad Riaz et al. Circulation. .

Abstract

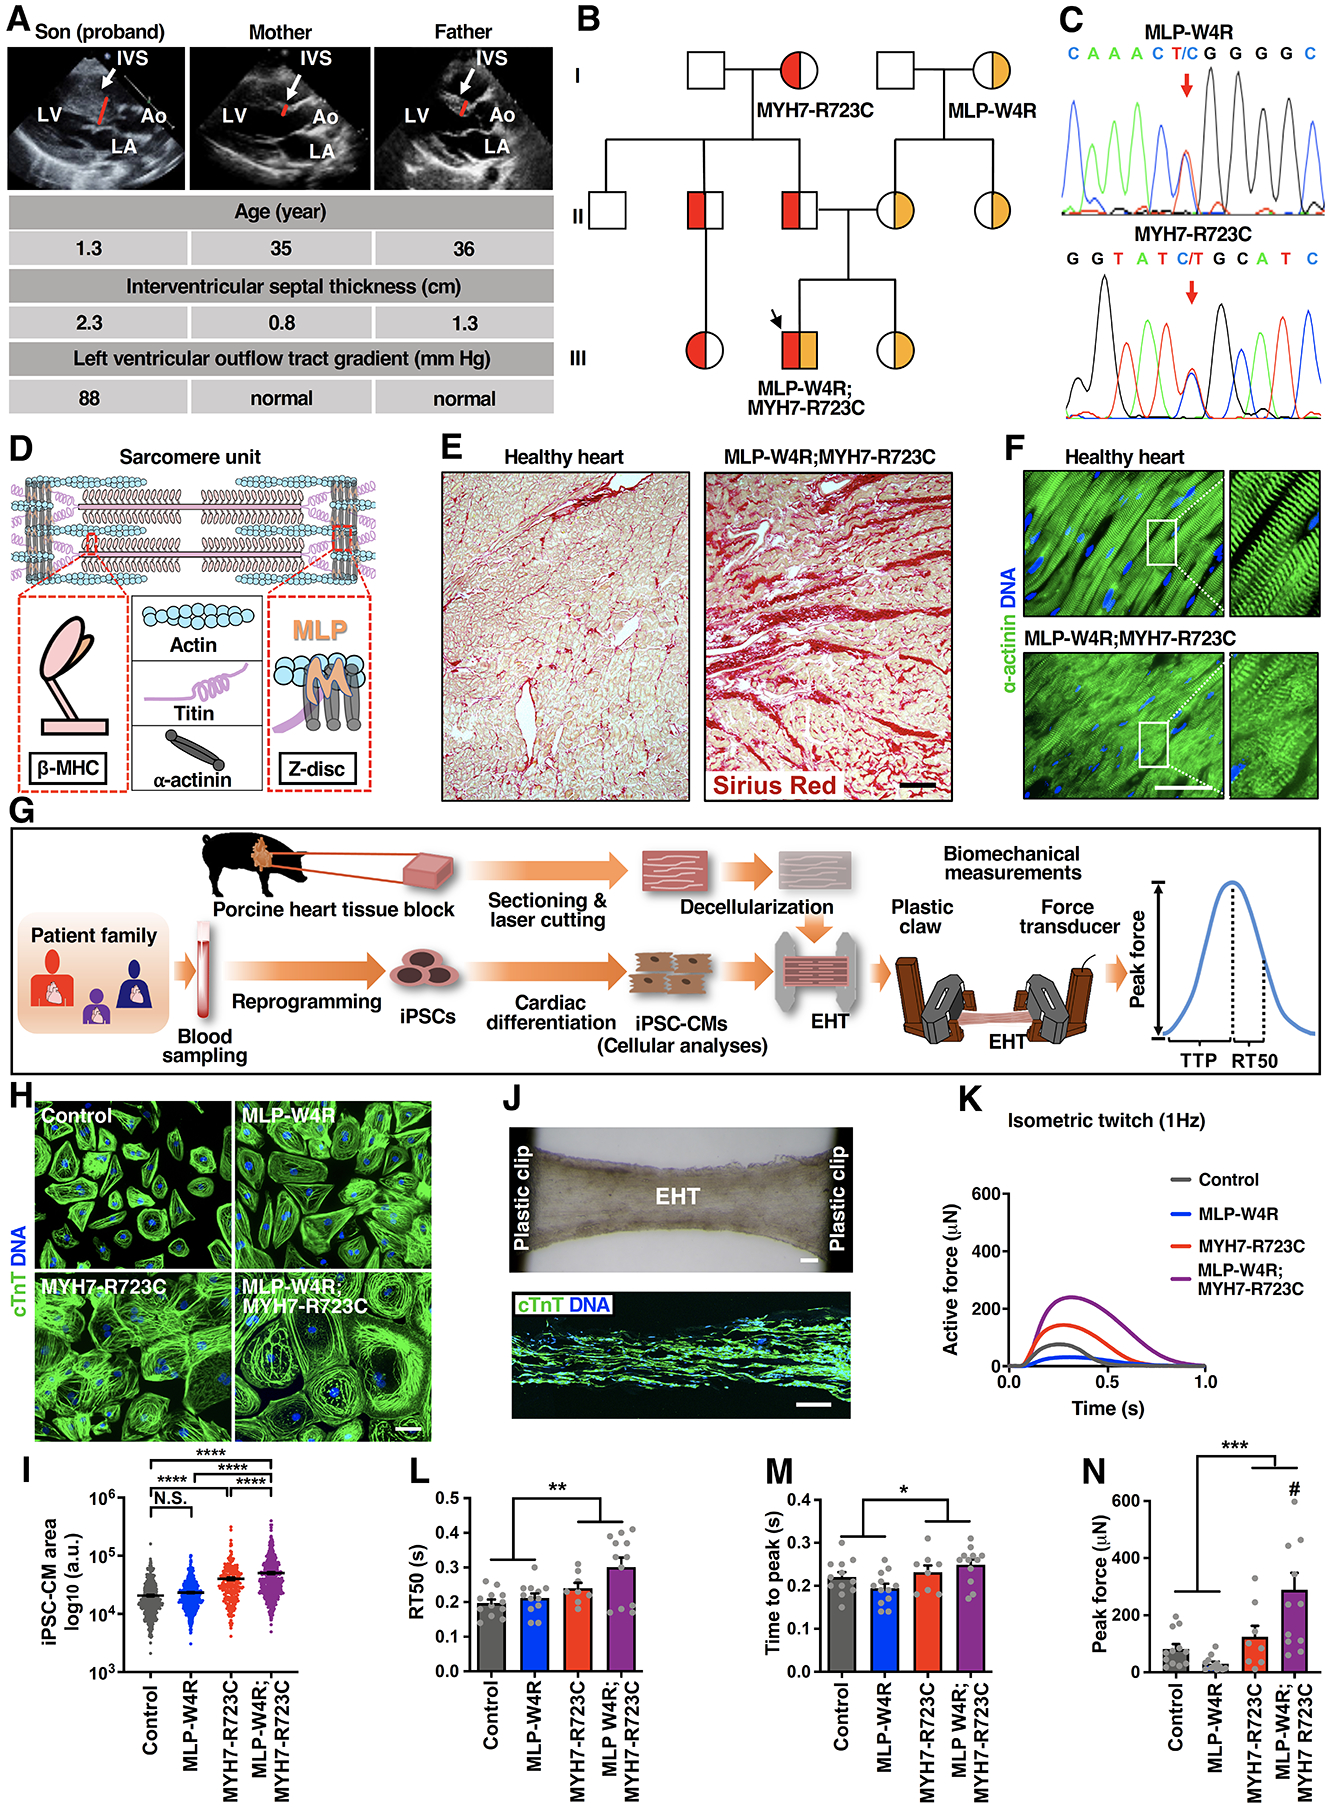
Background: Familial hypertrophic cardiomyopathy (HCM) is the most common inherited cardiac disease and is typically caused by mutations in genes encoding sarcomeric proteins that regulate cardiac contractility. HCM manifestations include left ventricular hypertrophy and heart failure, arrythmias, and sudden cardiac death. How dysregulated sarcomeric force production is sensed and leads to pathological remodeling remains poorly understood in HCM, thereby inhibiting the efficient development of new therapeutics.

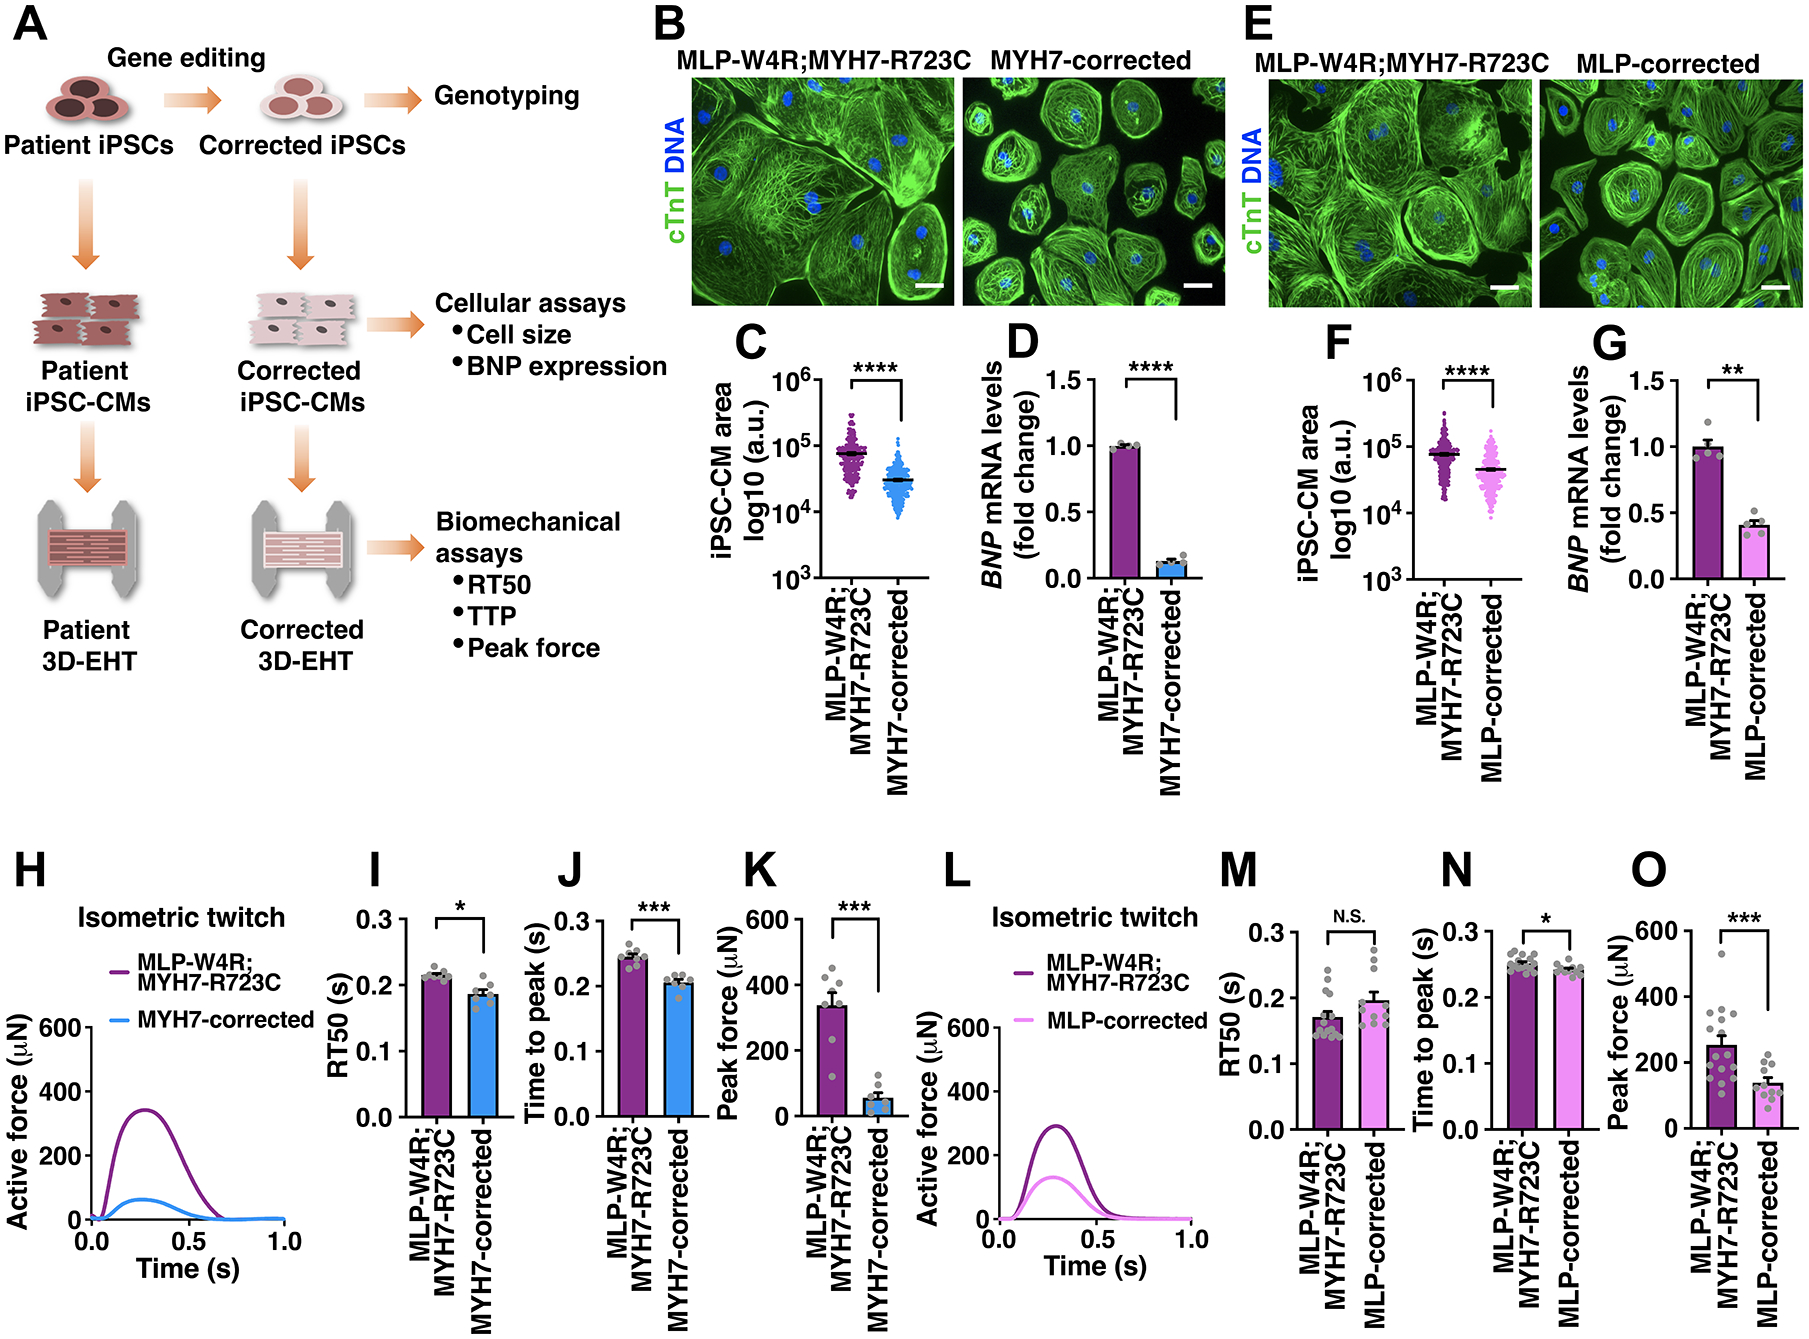
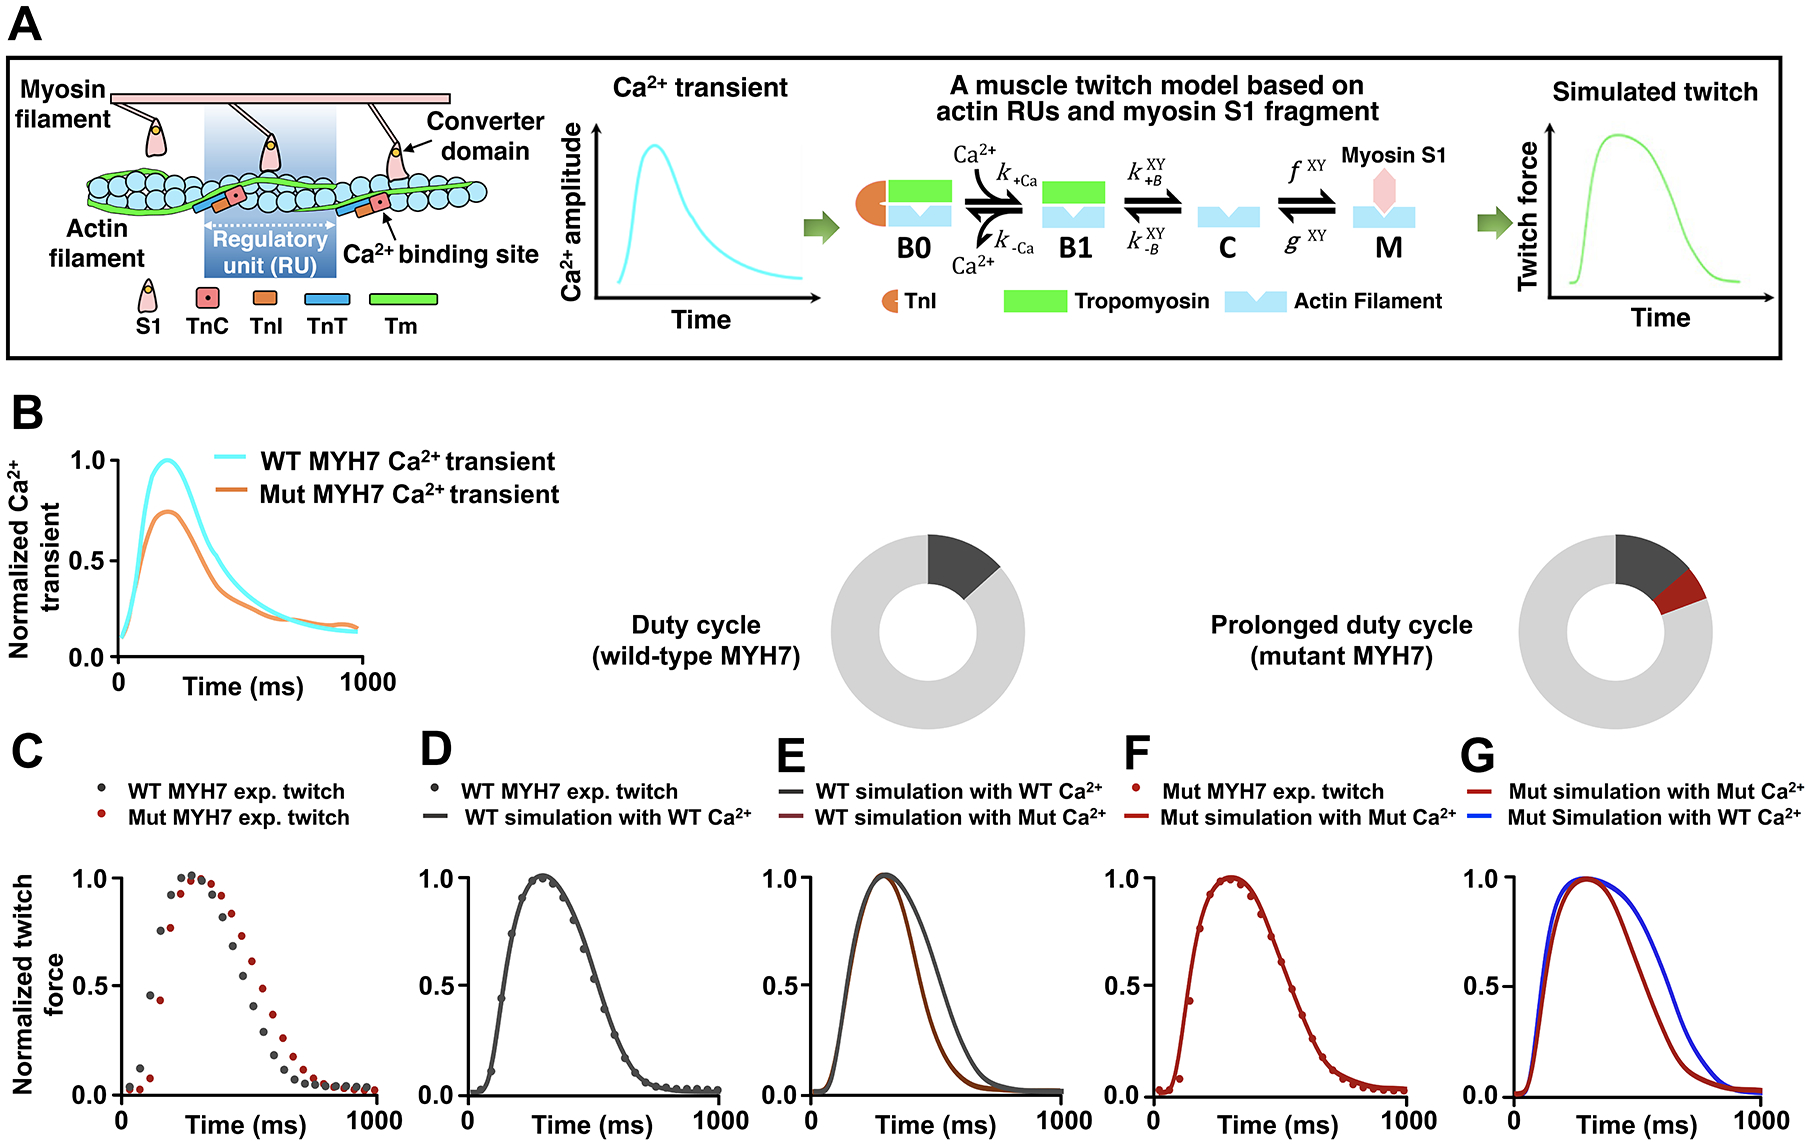
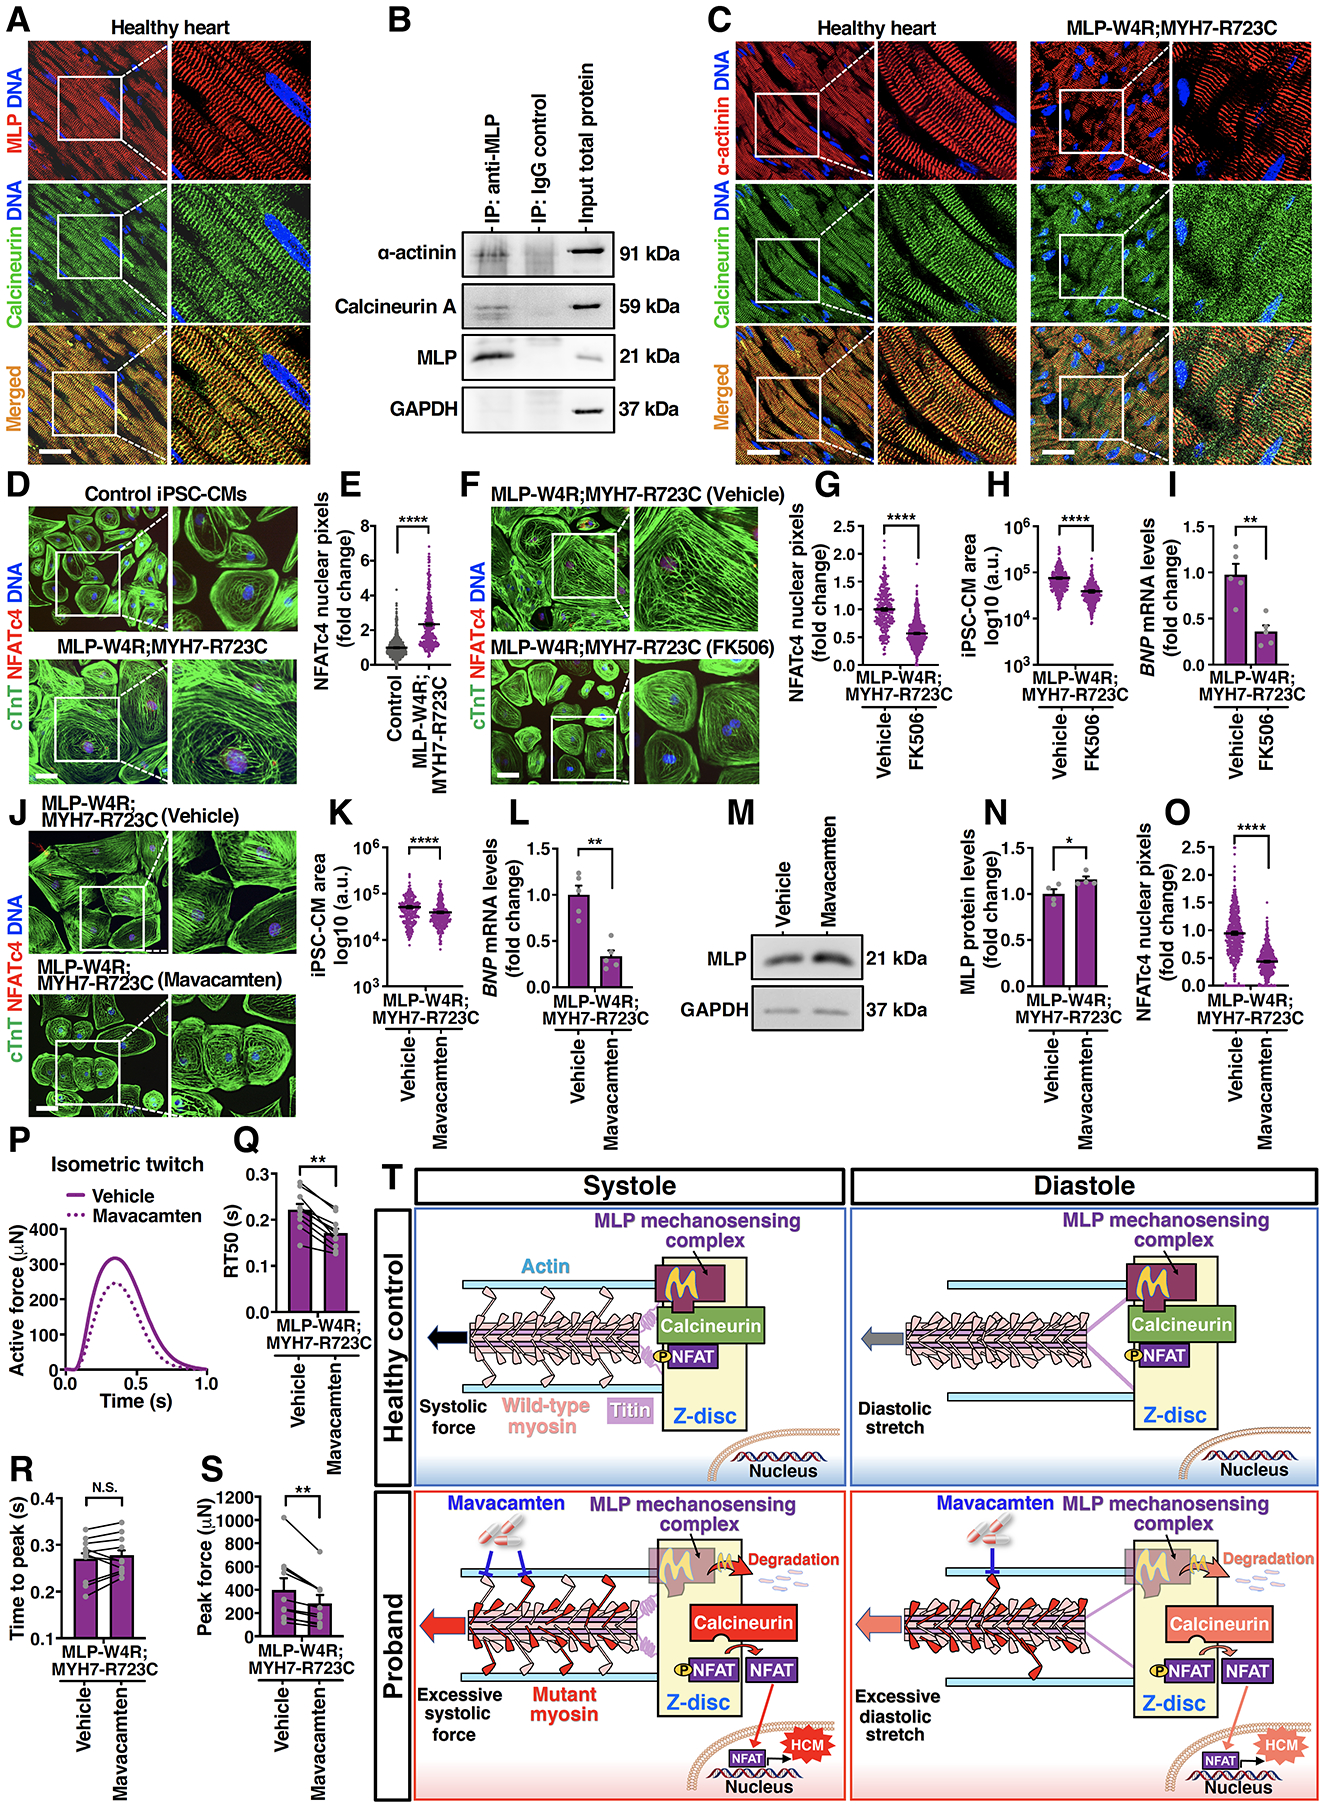
Methods: Our discovery was based on insights from a severe phenotype of an individual with HCM and a second genetic alteration in a sarcomeric mechanosensing protein. We derived cardiomyocytes from patient-specific induced pluripotent stem cells and developed robust engineered heart tissues by seeding induced pluripotent stem cell-derived cardiomyocytes into a laser-cut scaffold possessing native cardiac fiber alignment to study human cardiac mechanobiology at both the cellular and tissue levels. Coupled with computational modeling for muscle contraction and rescue of disease phenotype by gene editing and pharmacological interventions, we have identified a new mechanotransduction pathway in HCM, shown to be essential in modulating the phenotypic expression of HCM in 5 families bearing distinct sarcomeric mutations.

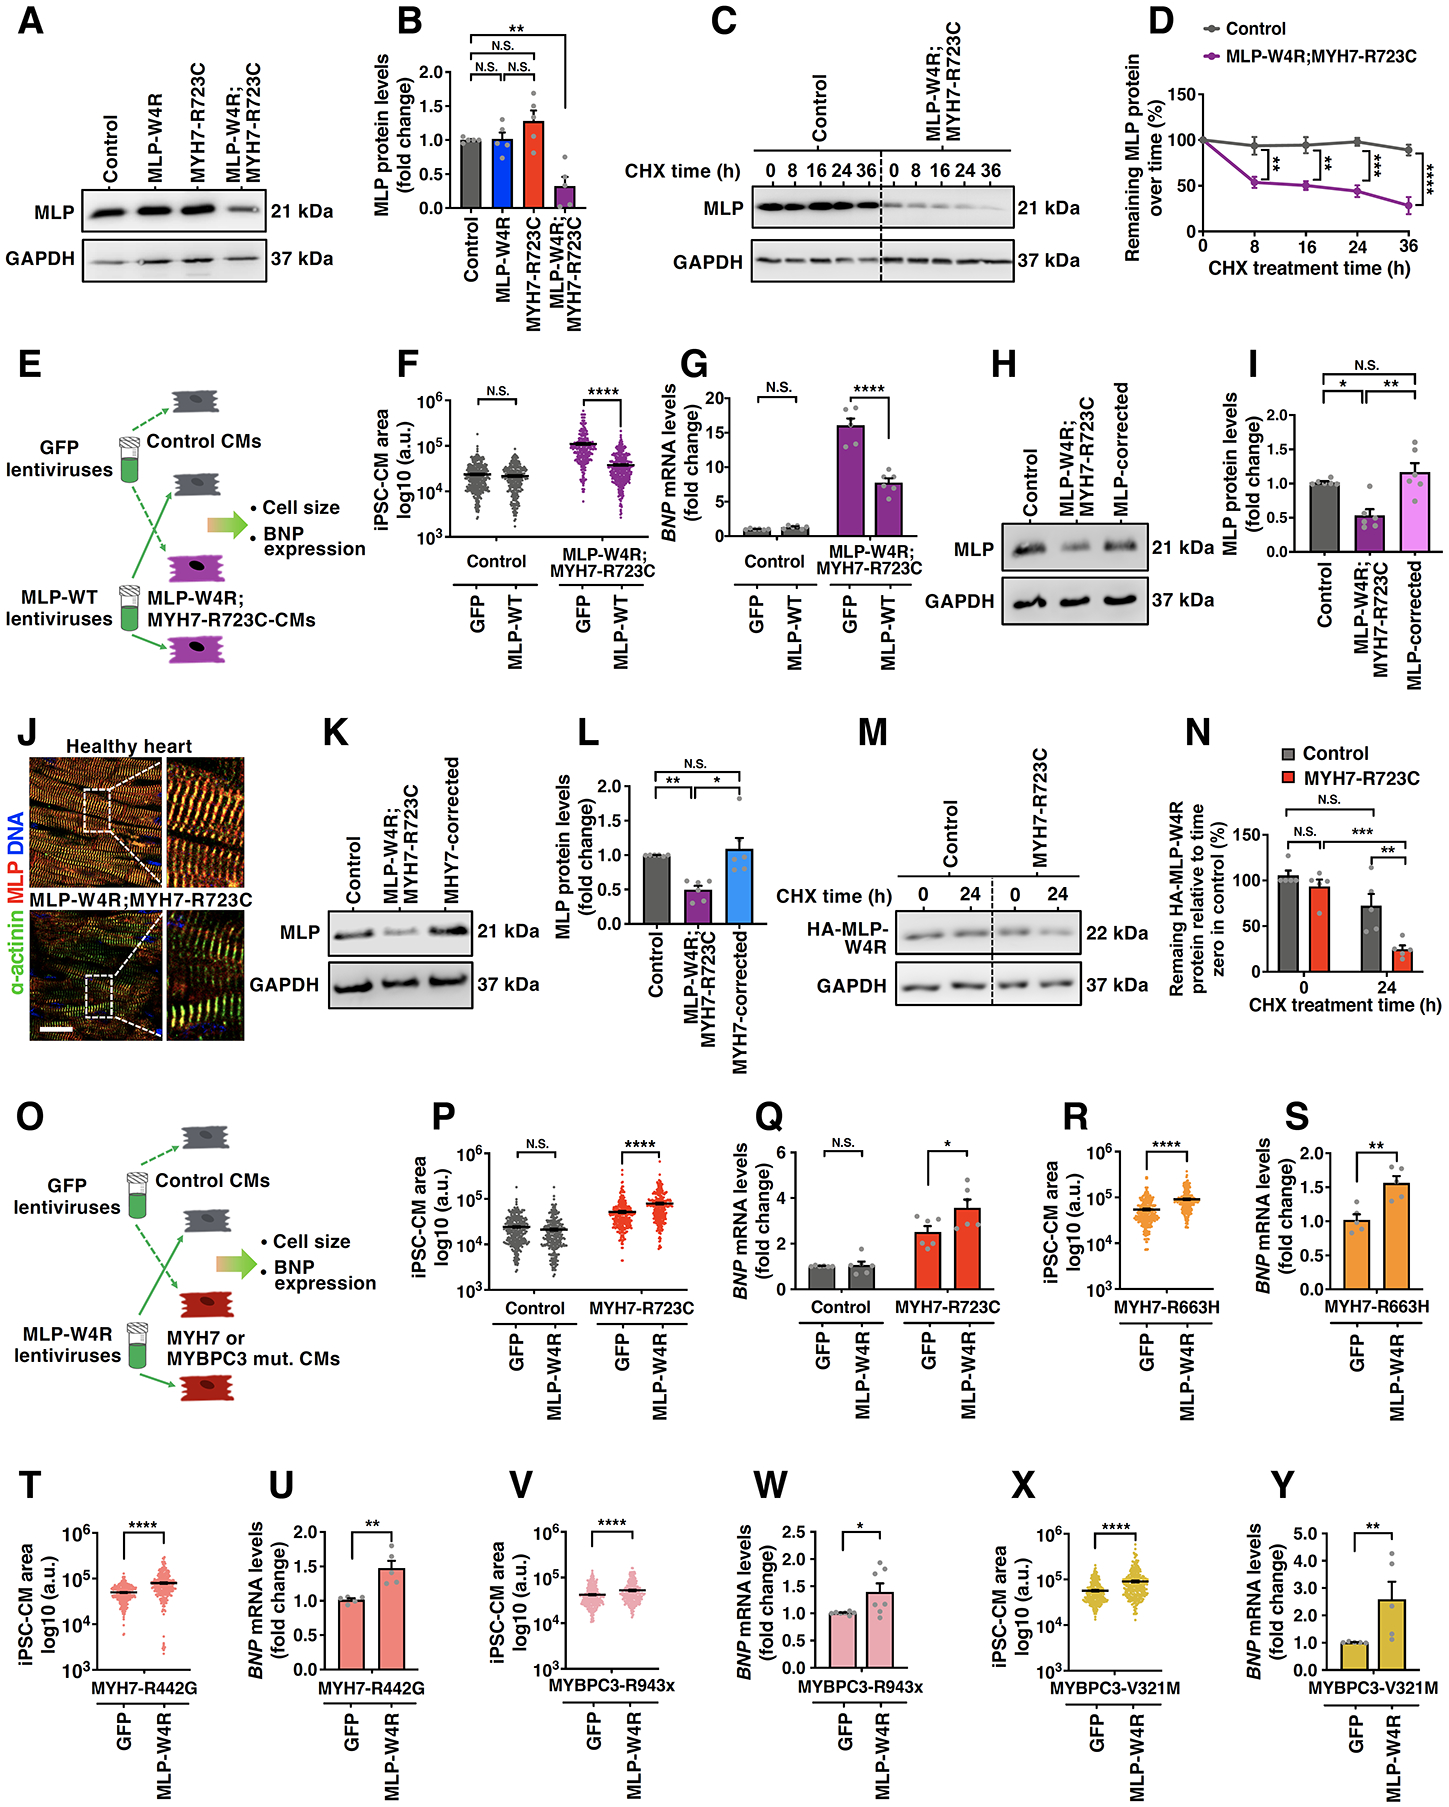
Results: Enhanced actomyosin crossbridge formation caused by sarcomeric mutations in cardiac myosin heavy chain (MYH7) led to increased force generation, which, when coupled with slower twitch relaxation, destabilized the MLP (muscle LIM protein) stretch-sensing complex at the Z-disc. Subsequent reduction in the sarcomeric muscle LIM protein level caused disinhibition of calcineurin-nuclear factor of activated T-cells signaling, which promoted cardiac hypertrophy. We demonstrate that the common muscle LIM protein-W4R variant is an important modifier, exacerbating the phenotypic expression of HCM, but alone may not be a disease-causing mutation. By mitigating enhanced actomyosin crossbridge formation through either genetic or pharmacological means, we alleviated stress at the Z-disc, preventing the development of hypertrophy associated with sarcomeric mutations.

Conclusions: Our studies have uncovered a novel biomechanical mechanism through which dysregulated sarcomeric force production is sensed and leads to pathological signaling, remodeling, and hypertrophic responses. Together, these establish the foundation for developing innovative mechanism-based treatments for HCM that stabilize the Z-disc MLP-mechanosensory complex.

Keywords: cardiomyocytes; cellular mechanotransduction; computer simulation; heart failure; hypertrophic cardiomyopathy; induced pluripotent stem cells; modifier genes.


Conflict of interest statement

Conflict of Interest Disclosures

S.G.C. has equity ownership in Propria LLC, which has licensed technology employed in the studies reported in this manuscript. Propria LLC did not fund these studies, and Propria LLC did not influence the conduct, description, or interpretation of the findings in this report. None of the other authors declares any competing financial interest.

Figures

Figure 1.
Figure 1.. Patient Clinical Phenotypes and HCM Modeling with Patient-Specific iPSC-Derived Cardiomyocytes and Engineered Heart Tissues.
A, Echocardiographic images (parasternal long axis) showing severe interventricular septum (IVS) hypertrophy in the neonatal proband with no overt structural changes in the proband’s parents. LV: left ventricle; LA: left atrium; Ao: aorta. B, Schematic pedigree of the proband exhibiting co-inheritance of the MLP-W4R and MYH7-R723C heterozygous missense mutations (III-2, black arrow). Squares represent male family members and circles represent females. Red indicates the MYH7-R723C heterozygous mutation, and yellow indicates the MLP-W4R heterozygous mutation. See Table S1 for additional clinical characteristics of the proband and family members. C, Confirmation of the heterozygous MLP-W4R and MYH7-R723 mutations in the respective MLP (exon 2) and MYH7 (exon 20) genes via PCR and Sanger sequencing in the proband. Red arrows indicate MLP and MYH7 mutations. See Figure S1D for additional sequencing information. D, Schematic of a sarcomere unit that includes thick filament components β myosin heavy chain (β-MHC; encoded by the MYH7 gene) and titin, thin filament component actin, and Z-disc components α-actinin and MLP. E, Sirius red staining of patient myectomy tissues versus healthy human controls. Scale bar, 200 μm. F, α-actinin immunostaining of patient myectomy tissue versus healthy human control. DNA was counterstained by DAPI. Scale bar, 50 μm. G, Schematic illustrating patient iPSC generation, iPSC-CM derivation, cellular analyses, EHT production, and EHT biomechanical measurements including peak force, time to peak force (TTP), and time from peak force to 50% relaxation (RT50). H, cTnT immunostaining of day 35 control, MLP-W4R, MYH7-R723C, and MLP-W4R;MYH7-R723C iPSC-CMs. Scale bar, 100 μm. I, Quantification of iPSC-CM areas in panel H with ImageJ from more than four independent cardiomyocyte differentiation batches (≥50 cells per batch for each cell type). Two-way ANOVA with Tukey’s multiple comparisons test revealed that the MYH7-R723C and MLP-W4R mutations synergistically regulated cell size (F(1,1985)=7.213, p=0.0073; each mutation considered as an independent factor). Note that the F value indicates the ratio of explained variance between groups to unexplained variance due to experimental variations within groups and the degrees of freedom (df) represent the df for factor (genotype) interaction and the sum of the individual df for each genotype group, respectively. J, Top panel: A representative image of an EHT constructed by seeding day 14 iPSC-CMs into decellularized thin sections of native porcine myocardium followed by an additional 14-day culture. Scale bar, 200 μm. Bottom panel: cTnT immunostaining of a representative EHT section. Scale bar, 200 μm. K, Representative isometric twitches of control, MLP-W4R, MYH7-R723C, and MLP-W4R;MYH7-R723C EHTs under 1 Hz pacing. L-N, Quantification of EHT biomechanical properties (n≥8 per group from three or more independent cardiomyocyte differentiation batches). Two-way ANOVA with Tukey’s multiple comparisons test revealed that there were no statistically significant interactions between the MYH7-R723C and MLP-W4R mutations in regulating RT50 (F(1,40)=1.46, p=0.234) and TTP (F(1, 40)=2.991, p=0.092). The presence of the MYH7-R723C mutation significantly prolonged RT50 (L, F(1,40)=12.200, p=0.001) and TTP (M, F(1,40)=6.857, p=0.012). In addition, these two mutations synergistically increased peak force (N) in the proband EHTs (F(1,40)=8.080, p=0.007). # denotes that proband MLP-W4R;MYH7-R723C EHTs generated significantly higher peak force than MLP-W4R (p<0.0001), MYH7-R723C (p=0.029), or control (p=0.001) EHTs. Note that the degrees of freedom (df) represent the df for each factor (genotype) or factor interaction and the sum of the individual df for each genotype group, respectively (L-N). Each mutation is considered as an independent factor. Each data point represents a single iPSC-CM (I) or EHT (L-N) derived from at least three independent cardiomyocyte differentiation batches. All data are presented as mean ± S.E.M; *p<0.05; **p<0.01; ***p<0.001; ****p<0.0001; N.S.: not significant.
Figure 2.
Figure 2.. Mutant Cardiac Myosin Initiates HCM Phenotype.
A, Schematic of correcting HCM-associated mutations in iPSCs via gene editing and phenotypic analyses of corrected iPSC-CMs and EHTs. See Figures S2 and S3 for CRISPR-Cas9- and TALEN-mediated correction of the myosin and MLP mutations. B-D, cTnT immunostaining in MLP-W4R;MYH7-R723C and MYH7-corrected (containing MLP-W4R) isogenic iPSC-CMs (B), followed by quantification of cell area based on cTnT staining (C) and analysis of hypertrophic molecular marker BNP via qRT-PCR (D). E-G, cTnT immunostaining in MLP-W4R;MYH7-R723C and MLP-corrected (containing MYH-R723C) isogenic iPSC-CMs (E), followed by quantification of cell area based on cTnT staining (F) and analysis of hypertrophic molecular marker BNP via qRT-PCR (G). Cell areas in panels B and E were quantified with ImageJ from three independent cardiomyocyte differentiation batches (≥100 cells per batch). mRNA expression was normalized to GAPDH and fold change relative to MLP-W4R;MYH7-R723C iPSC-CMs was presented (D: n=4 independent cardiomyocyte differentiation batches per group; G: n=5 independent cardiomyocyte differentiation batches per group). Scale bar (B, E), 100 μm. A two-tailed unpaired Student’s t test was used for cell area comparison (C, F) and a two-tailed unpaired Mann-Whitney U test for gene expression comparison (D, G). H, Representative twitches of EHTs constructed from MLP-W4R;MYH7-R723C and MYH7-corrected isogenic iPSC-CMs under 1 Hz pacing. I-K, Quantification of EHT biomechanical properties including RT50 (I), TTP (J), and peak force (K) (n≥7 per group from three independent cardiomyocyte differentiation batches). L, Representative twitches of EHTs constructed from MLP-W4R;MYH7-R723C and MLP-corrected isogenic iPSC-CMs under 1 Hz pacing. M-O, Quantification of EHT biomechanical properties including RT50 (M), TTP (N), and peak force (O) (n≥11 per group from at least three independent cardiomyocyte differentiation batches). A two-tailed unpaired Mann-Whitney U test was used for analysis between two groups (I-K, M-O). Each data point represents a single iPSC-CM (C and F), EHT (I-K and M-O), or sample generated from a batch of iPSC-CMs (D and G) from at least three independent cardiomyocyte differentiation batches. All data are presented as mean ± S.E.M; *p<0.05; **p<0.01; ***p<0.001; ****p<0.0001; N.S: not significant.
Figure 3.
Figure 3.. An Increase in Actomyosin Duty Cycle by Mutant Cardiac Myosin Leads to Prolonged Muscle Contraction in HCM.
A, Schematic illustration of a computational model for muscle contraction based on cooperative myofilament activation, , . Left panel: The model depicts the function of individual thin filament regulatory units (RUs), consisting of 7 actin monomers, TnC, TnI, and tropomyosin (Tm), in conjunction with the S1 fragment of myosin head. Right panel: The model takes a calcium transient as input and outputs activation of the myofilament dependent on the model parameters which describe myofilament protein interactions. Each RU exists in one of four states illustrating Ca2+ binding (from Ca2+-free B0 to Ca2+-bound B1 blocked states), Tm shifting (from B1 blocked to the closed [C] states), and myosin attachment (from the closed [C] to open [M] states). Note that the transition between closed and open (M) states is determined by the simplified crossbridge attachment (f) and detachment (g) rates, , . The B↔C and C↔M transition rates are functions of Tm states of the two nearest neighboring RUs (X and Y). Also see additional information in the Expanded Methods in the SUPPLEMENTAL MATERIAL. B, Experimental Ca2+ transients collected from both the wild-type (WT) and MYH7 mutant (Mut) iPSC-CMs. Ca2+ transients (Figure S4A–4C) were normalized and scaled to reflect relative average properties from the summary data, with the WT Ca2+ transient normalized at a diastolic value of 0.1 μM and a maximum value of 1.0 μM. C, Experimental twitches collected from both the WT and the MYH7 Mut EHTs and normalized to their individual maximum force for model analysis. D, The WT twitch was simulated by inputting the realistic WT Ca2+ transient into the model and optimizing the parameter set through minimization of the root mean square error using the particle swarm stochastic optimization algorithm. See details in the Expanded Methods. E, The MYH7 Mut Ca2+ transient was input into the model while keeping the parameters that fit the WT twitch. F, MYH7 Mut twitch was simulated using the MYH7 Mut Ca2+ transient and increasing the myosin duty cycle (δ) by 30% from the WT fit parameters (δWT 0.20; δMut 0.26). No other parameters were changed from the WT fit except for the myosin attachment rate f. See Table S2 for myofilament model parameter sets. G, The WT Ca2+ transient was input into the model with the mutant parameter set, representing only an increase in the myosin attachment rate.
Figure 4.
Figure 4.. MLP-W4R Exacerbates the Phenotypic Expression of HCM.
A, A representative western blot image showing MLP protein levels in day 35 control, MLP-W4R, MYH7-R723C, and MLP-W4R;MYH7-R723C iPSC-CMs. GAPDH was used as a loading control. B, Quantification of MLP protein in panel A (n=5 independent cardiomyocyte differentiation batches per group). Two-way ANOVA with Tukey’s multiple comparisons test revealed that there was a statistically significant interaction between the MLP-W4R and MYH7-R723C mutations in regulating MLP protein levels (F(1, 16)=17.940, p=0.0006; each mutation considered as an independent factor). C, Evaluation of MLP protein stability in control and MLP-W4R;MYH7-R723C iPSC-CMs via western blotting following cycloheximide (CHX, 50 μg/mL) treatments for 0, 8, 16, 24 and 36 hours. D, Quantification of the percentage of remaining MLP protein at different time points of CHX treatment normalized to time zero protein levels in panel C (n=3 independent cardiomyocyte differentiation batches per group). Two-way ANOVA with Tukey’s multiple comparisons test was used to evaluate the MLP levels between control and MLP-W4R;MYH7-R723C iPSC-CMs at each time point and revealed a significantly higher decay rate of MLP in the double mutant CMs than that in the control CMs 8, 16, 24, and 36 hours after CHX treatment (F(4,20)=6.811, p=0.001; genotype and treatment time considered as two independent factors). E, Schematic showing ectopic expression of GFP and HA-tagged wild-type MLP (MLP-WT) in control and MLP-W4R;MYH7-R723C day 35 iPSC-CMs and phenotypic analysis. F, Quantification of iPSC-CM cell area in control and MLP-W4R;MYH7-R723C iPSC-CMs from three independent cardiomyocyte differentiation batches (≥100 cells per batch). See Figure S5A–5C for cell staining images. G, qRT-PCR analysis of BNP mRNA expression levels in control and MLP-W4R;MYH7-R723C iPSC-CMs (n=6 independent cardiomyocyte differentiation batches per group). Two-way ANOVA with Tukey’s multiple comparisons test revealed a preferential normalization of cell area (F(1,1404)=180.200, p<0.0001) and BNP expression (F(1,20)=53.410, p<0.0001) by MLP-WT in MLP-W4R;MYH7-R723C iPSC-CMs (F, G). Note that genotype and type of ectopically expressed protein were considered as two independent factors. H, A representative western blot image showing MLP protein levels in day 35 control, MLP-W4R;MYH7-R723C, and MLP-W4R-corrected (containing MYH7-R723C) iPSC-CMs. I, Quantification of MLP protein in panel H (n=6 independent cardiomyocyte differentiation batches per group) by Kruskal–Wallis with Dunn’s multiple comparisons test (H(2)=11.000, p=0.0007). J, Immunostaining of MLP (red) and α-actinin (green) in young adult healthy heart tissue and MLP-W4R;MYH7-R723C proband heart tissue. Scale bar, 50 μm. K, A representative western blot image showing MLP levels in day 35 control, MLP-W4R;MYH7-R723C, and MYH7-corrected (containing MLP-W4R) iPSC-CMs. L, Quantification of MLP protein in panel K (n=6 independent cardiomyocyte differentiation batches per group) by Kruskal–Wallis with Dunn’s multiple comparisons test (H(2)=11.910, p=0.0002). M, A representative western blot image showing the expression of HA-tagged MLP-W4R protein in control or MYH7-R723C iPSC-CMs after CHX treatment. HA-MLP-W4R was ectopically expressed in day 21–22 iPSC-CMs via lentiviral infection. Infected iPSC-CMs were cultured for an additional 12–13 days followed by a 24-hour treatment of CHX (50 μg/mL) to examine the stability of HA-MLP-W4R via detection of HA signals. N, Quantification of the remaining HA-MLP-W4R protein in control and MYH7-R723C iPSC-CMs after CHX treatment in panel N (n=5 independent cardiomyocyte differentiation batches per group). Two-way ANOVA with Tukey’s multiple comparisons test revealed a significantly higher decay rate of HA-MLP-W4R protein in MYH7-R723C iPSC-CMs compared with that in control iPSC-CMs (F(1,16)=4.560, p=0.0485; genotype and type of ectopically expressed protein considered as two independent factors). O, Schematic showing ectopic expression of the GFP or HA-tagged MLP-W4R protein in control and MYH7-R723C iPSC-CMs via lentiviral infection and phenotypic analysis. P-Q, Quantification of cell area (P) and BNP mRNA levels (Q) in control and MHY7-R723C day 35 iPSC-CMs. See Figure S5D–5F for cell staining images. Two-way ANOVA with Tukey’s multiple comparisons test revealed a specific effect of HA-MLP-W4R in worsening HCM defects, including cell area (F(1,1289)=42.39, p<0.0001) and BNP expression (F(1,20)=4.457, p=0.0475), in MYH7-R723C iPSC-CMs but not in control iPSC-CMs (genotype and type of ectopically expressed protein considered as two independent factors). Note that cell area measurements were from three independent cardiomyocyte differentiation batches (≥100 cells/batch) and BNP expression analysis from six independent cardiomyocyte differentiation batches. R-Y, Quantification of cell area (R, T, V, and X) and BNP mRNA levels (S, U, W, and Y) in the corresponding day 35 MYH7-R663H, MYH7-R442G, MYBPC3-R943x, and MYBPC3-V321M iPSC-CMs transduced with GFP or MLP-W4R lentiviruses on day 21–22. See Figure S5G–5R for cell staining images. A two-tailed unpaired Student’s t test was used for cell area comparison (R, T, V, and X) and a two-tailed unpaired Mann-Whitney U test for BNP expression analysis (S, U, W, and Y). Cell area measurements in R and T were from three independent cardiomyocyte differentiation batches (≥100 cells/batch), and those in V and X from four independent batches (≥50 cells/batch). BNP expression analyses were from five or more (S, U, W, and Y) independent cardiomyocyte differentiation batches. Note that F values indicate the ratio of explained variance between groups to unexplained variance due to experimental variations within groups and the degrees of freedom (df) represent the df for factor interaction and the sum of the individual df for each experimental group, respectively (B, D, F, G, N, P, and Q). Additionally, H values indicate Kruskal-Wallis H Test statistics and df represent df for experimental groups (I and L). Each data point represents a single sample generated from a batch of iPSC-CMs (B, D, G, I, L, N, Q, S, U, W, and Y) or iPSC-CM (F, P, R, T, V, and X) derived from at least three independent cardiomyocyte differentiation batches. All data are presented as mean ± S.E.M; *p<0.05; **p<0.01; ***p<0.001; ****p<0.0001; N.S: not significant.
Figure 5.
Figure 5.. Inhibiting Calcineurin/NFAT or Cardiac Myosin Mitigates Development of the HCM Phenotype in Proband iPSC-Derived Cardiomyocytes.
A, Immunostaining of calcineurin (green) and MLP (red) in the young adult healthy heart tissue. DNA was counterstained by DAPI. Scale bar, 50 μm. B, A representative immunoblot showing co-immunoprecipitation of MLP, calcineurin, and α-actinin in day 35 control iPSC-CMs. C, Immunostaining of calcineurin (green) and α-actinin (red) in the young adult healthy heart tissue and MLP-W4R;MYH7-R723C proband heart tissue. Scale bar, 50 μm. D, Immunostaining of NFATc4 (red) and cTnT (green) in day 35 control and MLP-W4R;MYH7-R723C iPSC-CMs. DNA was counterstained by DAPI. Scale bar, 100 μm. E, Quantification of NFATc4 nuclear signals in panel D (two-tailed unpaired Student’s t test). Nuclear NFATc4 pixels (gray value) were quantified by ImageJ from three independent cardiomyocyte differentiation batches (≥100 cells/batch). F, Immunostaining of NFATc4 (red) and cTnT (green) in MLP-W4R;MYH7-R723C iPSC-CMs treated with DMSO (vehicle) or 0.5 μg/mL calcineurin inhibitor FK506. Treatment was started on day 25 of cardiac differentiation for 4 days (G and H) and 24 hours (I). Scale bar, 100 μm. G-I, Quantification of NFATc4 nuclear signals (G), cell area (H), and BNP gene expression (I) in DMSO- or FK506-treated MLP-W4R;MYH7-R723C iPSC-CMs. A two-tailed unpaired Student’s t test was performed for nuclear NFATc4 and cell area analyses from three independent cardiomyocyte differentiation batches (≥100 cells/batch). A two-tailed unpaired Mann-Whitney U test was used for BNP gene analysis (n=5 independent cardiomyocyte differentiation batches per group; normalized to GAPDH). J, Immunostaining of NFATc4 (red) and cTnT (green) in MLP-W4R;MYH7-R723C iPSC-CMs treated with DMSO (vehicle) or 0.5 μM cardiac myosin ATPase inhibitor mavacamten. Treatment was started on day 25 of cardiac differentiation for four days (J, K, M, N, and O) and 24 hours (L). Scale bar, 100 μm. K-L, Quantification of cell area (K) and BNP gene expression (L) in DMSO- or mavacamten-treated MLP-W4R;MYH7-R723C iPSC-CMs. A two-tailed unpaired Student’s t test was performed for cell area analysis from three independent cardiomyocyte differentiation batches (≥100 cells/batch). A two-tailed unpaired Mann-Whitney U test was used for BNP gene analysis (n=5 independent cardiomyocyte differentiation batches per group; normalized to GAPDH). M, A representative western blot of MLP expression in vehicle- and mavacamten-treated MLP-W4R;MYH7-R723C iPSC-CMs. N, Quantification of MLP protein levels in panel M. A Mann-Whitney U test was used for MLP protein analysis (n=4 independent cardiomyocyte differentiation batches per group; normalized to GAPDH). O, Quantification of NFATc4 nuclear signals in vehicle and mavacamten-treated MLP-W4R;MYH7-R723C iPSC-CMs in panel J. A two-tailed unpaired Student’s t test was performed based on three independent cardiomyocyte differentiation batches (≥100 cells/batch). P, Representative paired measurement of proband MLP-W4R;MYH7-R723C iPSC-CM-derived EHTs treated with DMSO (vehicle) or 0.5 μM mavacamten to steady state (30 minutes). Q-S, Quantification of biomechanical properties including RT50 (Q), time to peak (R), and peak force (S) (ten EHTs generated from three independent proband cardiomyocyte differentiation batches). A two-tailed paired Mann-Whitney U test was used for analysis between two groups. T, Schematic of the proposed working model. Mechanical force is transmitted into the Z-disc primarily through pulling actin by myosin heads via actomyosin crossbridges during systolic contraction. Titin is the main mechanical element transferring load into the Z-disc during diastolic stretch, with very little mechanical input through actin due to the detachment of myosins from actin. MLP mechanosensing complex may keep calcineurin/NFAT signaling in check under normal systolic and diastolic conditions. In contrast, the MYH7-R723C mutation in the proband resulted in abnormally higher systolic force transmitted into the Z-disc due to more crossbridge formation. Additionally, residual mutant actomyosin crossbridges due to delayed relaxation in the proband could lead to elevated diastolic Z-disc stretching. Consequently, MLP stretch-sensing machinery would likely be sensitized, leading to MLP degradation and subsequent calcineurin-NFAT hypertrophic signaling. Importantly, treatment of proband CMs with mavacamten, a cardiac myosin ATPase inhibitor, could potentially normalize systolic force generation and diastolic stretching, resulting in a restored MLP level and rescue from HCM defects. See the main text for details. Each data point represents a single iPSC-CM (E, G, H, K, and O), sample generated from a batch of iPSC-CMs (I, L, and N), or EHT (Q-S) derived from at least three independent cardiomyocyte differentiation batches. All data are presented as mean ± S.E.M; *p<0.05; **p<0.01; ***p<0.001; ****p<0.0001; N.S: not significant.

References

    1. Sen-Chowdhry S, Jacoby D, Moon JC and McKenna WJ. Update on hypertrophic cardiomyopathy and a guide to the guidelines. Nat Rev Cardiol. 2016;13:651–675. - PubMed
    1. Ho CY, Day SM, Ashley EA, Michels M, Pereira AC, Jacoby D, Cirino AL, Fox JC, Lakdawala NK, Ware JS, Caleshu CA, Helms AS, Colan SD, Girolami F, Cecchi F, Seidman CE, Sajeev G, Signorovitch J, Green EM and Olivotto I. Genotype and Lifetime Burden of Disease in Hypertrophic Cardiomyopathy: Insights from the Sarcomeric Human Cardiomyopathy Registry (SHaRe). Circulation. 2018;138:1387–1398. - PMC - PubMed
    1. Maron BJ. Hypertrophic cardiomyopathy: a systematic review. JAMA. 2002;287:1308–20. - PubMed
    1. Ashrafian H and Watkins H. Reviews of translational medicine and genomics in cardiovascular disease: new disease taxonomy and therapeutic implications cardiomyopathies: therapeutics based on molecular phenotype. J Am Coll Cardiol. 2007;49:1251–64. - PubMed
    1. Tardiff JC. Sarcomeric proteins and familial hypertrophic cardiomyopathy: linking mutations in structural proteins to complex cardiovascular phenotypes. Heart Fail Rev. 2005;10:237–48. - PubMed

Publication types