. 2022 Apr 6;22(5):1.
doi: 10.1167/jov.22.5.1.

The Open Perimetry Initiative: A framework for cross-platform development for the new generation of portable perimeters

Affiliations

The Open Perimetry Initiative: A framework for cross-platform development for the new generation of portable perimeters

Iván Marín-Franch et al. J Vis. .

Abstract

The Open Perimetry Initiative was formed in 2010 with the aim of reducing barriers to clinical research with visual fields and perimetry. Our two principal tools are the Open Perimetry Interface (OPI) and the visualFields package with analytical tools. Both are fully open source. The OPI package contains a growing number of drivers for commercially available perimeters, head-mounted devices, and virtual reality headsets. The visualFields package contains tools for the analysis and visualization of visual field data, including methods to compute deviation values and probability maps. We introduce a new frontend, the opiApp, that provides tools for customization for visual field testing and can be used as a frontend to run the OPI. The app can be used on the Octopus 900 (Haag-Streit), the Compass (iCare), the AP 7000 (Kowa), and the IMO (CREWT) perimeters, with permission from the device manufacturers. The app can also be used on Android phones with virtual reality headsets via a new driver interface, the PhoneHMD, implemented on the OPI. The use of the tools provided by the OPI library is showcased with a custom static automated perimetry test for the full visual field (up to 50 degrees nasally and 80 degrees temporally) developed with the OPI driver for the Octopus 900 and using visualFields for statistical analysis. With more than 60 citations in clinical and translational science journals, this initiative has contributed significantly to expand research in perimetry. The continued support of researchers, clinicians, and industry are key in transforming perimetry research into an open science.


Figures
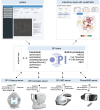
Figure 1.
Figure 1.
Illustration of the OPI architecture. Top left is a graphical interface generated in shiny for a program logic that can be run on any device at the bottom through the OPI client (center) as it dispatches commands via the OPI servers. Once a suitable dataset of healthy controls has been collected, statistical analyses as the one in the top right can be generated with the visualFields package.
Figure 2.
Figure 2.
Combined grayscale sensitivity and color-coded total-deviation map. The representation of the full visual field results are composites of two tests taken on the same day: one spanning the central 26 degrees of the visual field and another from 26 degrees to 50 degrees nasally, to 80 degrees temporally, to 46 degrees superiorly, and to 50 degrees inferiorly. The values shown at each location are total deviations, departures in sensitivity from the mean normal sensitivities for age-matched controls. The background grayscale of each tile represents the estimated sensitivity at the corresponding visual field location, where darker means lower sensitivity. Tiles whose border is shown in color are significantly depressed according to the statistical analysis of the total-deviation map. The tiles involving each visual field location were obtained using Voronoi tessellation (Aurenhammer & Klein, 1999; Kucur, Holló, & Sznitman, 2018) to achieve an efficient representation for both highly irregular grids. Voronoi tessellations are a partitioning of a surface into regions so that the center of each cell is its mean (center of mass). Every point in a given Voronoi polygon is closer to its generating point than to any other cell.
Figure 3.
Figure 3.
The PoPLR analysis. The left panel shows the slopes at each visual field location obtained with pointwise linear regression of total deviation values over time along with sparklines representing the values over the whole series. The colors at the border of the tiles categorize the p values of the one-tail t-test with the alternative that the slope is negative. To identify highly variable series of visual fields, the sparklines are shown in red if the median absolute deviation of the residuals from linear regression were greater than 2 dB. The top right graph is the combined grayscale sensitivity and total-deviation map of the baseline sensitivity values (intercept of pointwise regression on sensitivities). The bottom right function shows the histogram of random S / n, where n is the number (52 in this case) of regression analyses performed obtained by permuting the series as part the of PoPLR analysis. The p value for the PoPLR analysis testing whether there is deterioration is shown next to the value of the observed S / n statistic.
Figure 4.
Figure 4.
The opiApp on the PhoneHMD OPI. The ZEST algorithm for luminance (white-on-white) perimetry for a custom irregular grid of test locations is executed for a (fictitious) patient. The opiApp (top) sends commands to an Android Samsung Galaxy S9 phone (bottom) to generate white visual stimuli at different intensities and at different distances from the fixation point (green cross). At each presentation, the web app updates and shows the interim results of the test.
Figure 5.
Figure 5.
Geographical map of citations to the OPI and the visualFields R package as listed in Scopus. The red solid circles demarcate the cities of the first authors’ affiliations. The sizes of the circles represent the number of citations from each city, up to three. As of February 2022, OPI and visualFields related publications received 66 peer-reviewed citations from 12 countries in 4 continents.

References

    1. Anthes, C., García-Hernández, R. J., Wiedemann, M., & Kranzlmüller, D. (2016). State of the Art of Virtual Reality Technology. IEEE Conference on Aerospace, pp. 1–19.
    1. Artes, P. H., O'Leary, N., Nicolela, M. T., Chauhan, B. C., & Crabb, D. P. (2014). Visual Field Progression in Glaucoma: What Is the Specificity of the Guided Progression Analysis? American Academy of Ophthalmology, 121(10), 2023–2027. - PubMed
    1. Aulhorn, E., & Harms, H. (1967). Early visual field defects in glaucoma. In Leydhecker W. (Ed.), Glaucoma Tutzing Symposium. Beckenham, UK: S. Karger, Ltd.
    1. Aurenhammer, F., & Klein, R. (1999). Voronoi Diagrams. In Sack J. R. & Urrutia J. (Eds.), Handbook of computational geometry (pp. 201–290). North-Holland, UK: Elsevier.
    1. Bebie, H., Fankhauser, F., & Spahr, J. (1976). Static perimetry: strategies. Acta Ophthalmologica, 54(3), 325–338. - PubMed

Publication types