Sex classification using the human sacrum: Geometric morphometrics versus conventional approaches
- PMID: 35385483
- PMCID: PMC8986015
- DOI: 10.1371/journal.pone.0264770
Sex classification using the human sacrum: Geometric morphometrics versus conventional approaches
Abstract
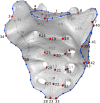
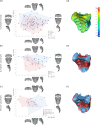
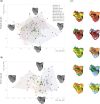
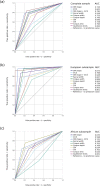
The human pelvis shows marked sexual dimorphism that stems from the conflicting selective pressures of bipedal locomotion and parturition. The sacrum is thought to reflect this dimorphism as it makes up a significant portion of the pelvic girdle. However, reported sexual classification accuracies vary considerably depending on the method and reference sample (54%-98%). We aim to explore this inconsistency by quantifying sexual dimorphism and sex classification accuracies in a geographically heterogeneous sample by comparing 3D geometric morphometrics with the more commonly employed linear metric and qualitative assessments. Our sample included 164 modern humans from Africa, Europe, Asia, and America. The geometric morphometric analysis was based on 44 landmarks and 56 semilandmarks. Linear dimensions included sacral width, corpus depth and width, and the corresponding indices. The qualitative inspection relied on traditional macroscopic features such as proportions between the corpus of the first sacral vertebrae and the alae, and sagittal and coronal curvature of the sacrum. Classification accuracy was determined using linear discriminant function analysis for the entire sample and for the largest subsamples (i.e., Europeans and Africans). Male and female sacral shapes extensively overlapped in the geometric morphometric investigation, leading to a classification accuracy of 72%. Anteroposterior corpus depth was the most powerful discriminating linear parameter (83%), followed by the corpus-area index (78%). Qualitative inspection yielded lower accuracies (64-76%). Classification accuracy was higher for the Central European subsample and diminished with increasing geographical heterogeneity of the subgroups. Although the sacrum forms an integral part of the birth canal, our results suggest that its sex-related variation is surprisingly low. Morphological variation thus seems to be driven also by other factors, including body size, and sacrum shape is therefore likely under stronger biomechanical rather than obstetric selection.
Conflict of interest statement
The authors have declared that no competing interests exist.
Figures


Similar articles
-
Sex determination accuracy using the human sacrum in a Central European sample.Anthropol Anz. 2022 Feb 14;79(2):211-220. doi: 10.1127/anthranz/2021/1415. Anthropol Anz. 2022. PMID: 34761799
-
An exploration of sacral morphology using geometric morphometrics and three-dimensionally derived interlandmark distances.Int J Legal Med. 2022 Jul;136(4):1051-1065. doi: 10.1007/s00414-021-02724-7. Epub 2022 Jan 13. Int J Legal Med. 2022. PMID: 35022842
-
Sexual dimorphism in relative sacral breadth among catarrhine primates.Am J Phys Anthropol. 2013 Dec;152(4):435-46. doi: 10.1002/ajpa.22372. Epub 2013 Oct 17. Am J Phys Anthropol. 2013. PMID: 24132790
-
A geometric morphometric assessment of shape variation in adult pelvic morphology.Am J Phys Anthropol. 2021 Dec;176(4):652-671. doi: 10.1002/ajpa.24399. Epub 2021 Sep 15. Am J Phys Anthropol. 2021. PMID: 34528241
-
Evolution of the human birth canal.Am J Obstet Gynecol. 2024 Mar;230(3S):S841-S855. doi: 10.1016/j.ajog.2022.09.010. Epub 2023 Jul 18. Am J Obstet Gynecol. 2024. PMID: 38462258 Review.
Cited by
-
Analysis of the Natural Conditions and Geographical Factors of the Formation of Hui-Style Prints.J Environ Public Health. 2022 Jul 14;2022:4627215. doi: 10.1155/2022/4627215. eCollection 2022. J Environ Public Health. 2022. Retraction in: J Environ Public Health. 2023 Sep 14;2023:9859284. doi: 10.1155/2023/9859284. PMID: 35874887 Free PMC article. Retracted.
-
Age-specific normative values of sacral development and fusion in children and adolescents: a cross-sectional study utilizing multiplanar reconstruction computed tomography imaging.BMC Musculoskelet Disord. 2025 Apr 10;26(1):351. doi: 10.1186/s12891-025-08597-w. BMC Musculoskelet Disord. 2025. PMID: 40211180 Free PMC article.
-
Gradual exacerbation of obstetric constraints during hominoid evolution implied by re-evaluation of cephalopelvic fit in chimpanzees.Nat Ecol Evol. 2024 Dec;8(12):2228-2238. doi: 10.1038/s41559-024-02558-7. Epub 2024 Oct 23. Nat Ecol Evol. 2024. PMID: 39443698
-
The morphological consequences of segmentation anomalies in the human sacrum.Am J Biol Anthropol. 2022 Apr;177(4):690-707. doi: 10.1002/ajpa.24466. Epub 2021 Dec 29. Am J Biol Anthropol. 2022. PMID: 36787761 Free PMC article.
-
Geometric morphometrics approach for classifying children's nutritional status on out of sample data.Sci Rep. 2025 Jan 31;15(1):3906. doi: 10.1038/s41598-025-85718-4. Sci Rep. 2025. PMID: 39890869 Free PMC article.
References
-
- Meyer HG. Lehrbuch der Anatomie des Menschen. 1st ed. Leipzig: Engelmann; 1856.
-
- Flander LB, Corruccini RS. Shape differences in the sacral alae. Am J Phys Anthropol. 1980;52:399–403.
Publication types
MeSH terms
LinkOut - more resources
Full Text Sources

