. 2022 Apr 6;17(4):e0265685.
doi: 10.1371/journal.pone.0265685. eCollection 2022.

Controlled assembly of retinal cells on fractal and Euclidean electrodes

Affiliations

Controlled assembly of retinal cells on fractal and Euclidean electrodes

Saba Moslehi et al. PLoS One. .

Abstract

Controlled assembly of retinal cells on artificial surfaces is important for fundamental cell research and medical applications. We investigate fractal electrodes with branches of vertically-aligned carbon nanotubes and silicon dioxide gaps between the branches that form repeating patterns spanning from micro- to milli-meters, along with single-scaled Euclidean electrodes. Fluorescence and electron microscopy show neurons adhere in large numbers to branches while glial cells cover the gaps. This ensures neurons will be close to the electrodes' stimulating electric fields in applications. Furthermore, glia won't hinder neuron-branch interactions but will be sufficiently close for neurons to benefit from the glia's life-supporting functions. This cell 'herding' is adjusted using the fractal electrode's dimension and number of repeating levels. We explain how this tuning facilitates substantial glial coverage in the gaps which fuels neural networks with small-world structural characteristics. The large branch-gap interface then allows these networks to connect to the neuron-rich branches.


Conflict of interest statement

The authors have declared that no competing interests exist.

Figures
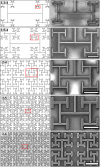
Fig 1
Fig 1. Schematic and scanning electron microscopy (SEM) images of fractal electrodes used in retinal cell culture experiments with different fractal dimensions D and repeating levels m.
Left column from top to bottom: (D = 1.1 and m = 4, labelled as 1.1–4), (D = 1.5 and m = 4, labelled as 1.5–4), (D = 2 and m = 4, labelled as 2–4), (D = 2 and m = 5, labelled as 2–5), (D = 2 and m = 6, labelled as 2–6). Right column: equivalent SEM image of the marked area in each electrode on the left column. The scale bars are 100, 200, 400, 200 and 200 μm from top to bottom.
Fig 2
Fig 2. Neuronal and glial behaviors for Euclidean electrodes imaged at 17 DIV.
(a) Sum of glial coverage areas shown in panel (b) (measured in pixels with a pixel width of 0.32 μm), revealing peaks within the SiO2 gaps. (b) Representative fluorescence image of GFAP labelled glial cells of a S75C75 electrode superimposed on the regions of glial coverage identified by the algorithm (green). (c) Representative fluorescence image of β-Tubulin III labeled neurons of the same region in (b) superimposed on the neuronal processes identified by the algorithm (red). (d) Sum of process lengths (in pixels) shown in panel (c), revealing peaks coinciding with the electrode edges. (e) Representative fluorescence image of a GFAP labelled glial cell on the VACNT top surface of a S75C75 electrode. (f) Zoom-in representative fluorescence image of GFAP labeled glial cells of the area marked in (b). (g) Zoom-in representative fluorescence image of β-Tubulin III labeled neurons of the area marked in (c). (h) SEM image of a S50C50 Euclidean electrode taken at 40° tilt showing neuron clusters and connecting processes (false-colored) adhering to the top surface and sidewalls of the electrode (7 DIV). The dotted black lines in (a) and (b) and the cyan lines in (e) and (f) locate the edges of the VACNT rows. Scale bars are 100 μm in (b) and (c), 50 μm in (e), (f), and (g), and 10 μm in (h).
Fig 3
Fig 3. Examples of fluorescence images of retinal cells interacting with the fractal electrodes at 17 DIV (green = GFAP labelled glia; red = β-tubulin III labelled neurons).
(a) The rare occurrence of glia following the 90° turn of a 2–6 electrode branch. (b) Glial coverage in the gap of a 2–6 electrode. (c) Glial coverage in the gap of a 1.1–4 electrode close to its branches. (d) Individual glia in a desert region away from the branches of a 1.1–4 electrode. (e) Neurons and their processes on a 2–6 electrode’s branches. (f) Neuron clusters and processes in a boundary region interacting with the neurons on the nearby branches of a 2–6 electrode. Neuronal processes were semi-automatically traced using the Fiji simple neurite tracer and were false-colored. (g) Neuron clusters and processes forming a cluster neural network in the gaps of a 1.1–4 electrode. (h) individual neurons in a desert region of a 1.1–4 electrode far from the branches. (i) and (j) Schematic of the glial and neural network regions. (i-1) and (j-1) show the electrode with few glial cells and multiple processes connecting individual neurons and small to medium-sized clusters. (i-2) and (j-2) show the ‘boundary’ region featuring small to medium glial coverage regions and clusters connecting to each other and to neurons on the electrodes using multiple processes. (i-3) and (j-3) show the ‘small-world’ region featuring larger glial coverage and clusters with bundles of processes connecting them. (i-4) and (j-4) show the ‘desert’ region furthest from electrodes featuring very few glial cells, mostly individual neurons and very few processes. (k) Merged fluorescence image of glia and neurons on a 2–4 electrode showing all the different regions. Scale bars on (a), (b), (c), (f), and (g) are 100 μm, on (d) and (h) are 200 μm, and on (e) and (k) are 50 μm. The electrode edges are highlighted in cyan in (a), (b), (c), (e), (f), (g) and (k). Schematic panels were created in BioRender.
Fig 4
Fig 4. Examples of fluorescence images of retinal cells interacting with the Euclidean electrodes at all culture times (green = GFAP labelled glia; red = β-tubulin III labelled neurons).
(a, b, c) GFAP labelled glial cells (green) on the VACNT and SiO2 gaps of S75C75 electrodes at 3 DIV (a), 7 DIV (b) and 17 DIV (c). (d, e, f) Merged fluorescence images of neural networks showing GFAP labelled glia (green) and β-tubulin III labelled neurons (red) on different regions of the same electrodes shown in (a), (b), and (c). Panel (g) is a zoom-in on the region marked in (f) with the green channel removed in order to clearly highlight neuronal processes bundling in the SiO2 gap. Scale bars are 50 μm in (a) through (g). The cyan lines mark the edge between the VACNT electrode (top half) and SiO2 gap (bottom half) in (a) through to (f). (h, i, j, k) Time evolution of GSi, GCNT, NSi, and NCNT for all Euclidean electrodes averaged at each culture time. The glial cells follow a gradual increase in surface coverage across the culture time while the neuronal processes show a peak at 7 DIV (Table 3 shows the number of analyzed electrodes at each culture time). The error bars correspond to the 95% confidence intervals. Stars in (h), (i), (j), and (k) indicate the degree of significance: * denotes p ≤ 0.05, *** denotes p ≤ 0.001, and **** denotes p ≤ 0.0001.
Fig 5
Fig 5. Glial and neuronal behavior for Euclidean and fractal electrodes at 17 DIV.
(a) GSi median change with WSi, (b) GCNT median change with WCNT, (c) NSi median change with WSi, (d) NCNT median change with WCNT. No significance was detected between any Euclidean pairs in panels (a), (b), and (d). In panel (c), significance was detected between WSi = 50 and WSi = 100 μm (p = 0.018). (e), (f), (g), and (h) show GSi, GCNT, NSi, and NCNT median trend with D and m. The 2–4 and 2–6 fractal datapoint are slightly shifted from D = 2 for clarity. The error bars correspond to the 95% confidence intervals. Stars in (c), (e), and (g) indicate the degree of significance: * denotes p ≤ 0.05, and *** denotes p ≤ 0.001.
Fig 6
Fig 6. Quantification of herding.
(a) Scatterplot of N (neuron herding) vs G (glial herding) at 17 DIV, for 38 Euclidean and 44 fractal electrodes where each data point represents one electrode (we display 0.5 < G ≤ 1 for clarity but note that the one Euclidean electrode with G < 0.5 not shown here was included in the analysis). The dashed line marks the threshold value in G that no Euclidean electrode surpassed. (b) Histogram of the number of electrodes n with a given G for 17 DIV Euclidean and fractal electrodes. (c) Histogram of the number of electrodes n with a given N for 17 DIV Euclidean and low regime fractal electrodes. (d) Histogram of the number of electrodes n with a given GN for 3 and 17 DIV Euclidean plus 17 DIV fractal electrodes. Euclidean data for 7 DIV is not shown for clarity but follows the observed trend.
Fig 7
Fig 7. Schematics of the fractal electrodes and plots of their parameters versus D and m.
The schematics shown in (a), (b), and (c) are for 1.1–4, 2–4, and 2–5 fractals, respectively. In each case, the top half represents the proximity heat map and the bottom half indicates the largest (bounded red boxes) and smallest (red rectangles indicated by the red arrows) gap areas, along with the largest connected gap area (light gray). (d) Normalized edge length En, (e) mean tortuosity T, (f) mean proximity P, (g) Area ratio Ar (y axis multiplied by 105), (h) connected area Ac (y axis multiplied by 106), each plotted vs D for 4, 5, and 6 repeating levels fractals, and (i) P plotted vs Ac for Euclidean electrodes with different WSi values and fractal electrodes with different D and m values (x axis multiplied by 106). In each case, the filled symbols represent electrodes studied experimentally.
Fig 8
Fig 8. Glial behavior on SiO2 surfaces.
Fluorescence images of glial cells (green) at 17 DIV are shown for zoom-in sections showing 1/4th of the full electrode images for the 1.1–4 (bottom right), 1.5–4 (top left), 2–4 (top right), and 2–6 (bottom left) fractals along with the S50C50 (middle left) Euclidean electrodes. White or gray masks are imposed on to the fluorescence images to indicate the locations of the electrodes. Scale bars are 500 μm. A plot of GSi median change against WSi-min is also shown. The dashed arrows connect the images to their corresponding datapoints in the plot. The blue diamond symbols represent fractals. The red pentagrams represent the 17 DIV Euclidean electrodes grouped based on their WSi. The error bars correspond to the 95% confidence intervals and are excluded for visual simplicity but range from ± 8 × 10⁻³ (for WSi-min = 100 μm) to ± 4 × 10⁻² (for 1.5–4). The significance results (see text) are also excluded for clarity.
Fig 9
Fig 9. Study of the relationship between GSi, NSi, and NCNT for fractal and Euclidean electrodes.
(a) Scatterplot of NSi versus GSi for 17 DIV Euclidean (red pentagram), low (diamond) and high (filled square) regime fractals. Inset of (a) Histogram of the number of electrodes n with a given NSi value for all fractals, grouped according to D and m. (b) Scatterplot of NCNT vs NSi for 17 DIV Euclidean, low, and high regime fractals. The solid black line represents the NCNT = NSi condition. The solid blue, dashed blue, and solid red lines are fits through zero for the low regime fractal, high regime fractal, and Euclidean electrodes, respectively. Top inset of (b) Histogram of the number of electrodes n with a given NCNT for all fractals, grouped according to D and m. Bottom inset of (b) Histogram of the number of electrodes n with a given NCNT for low and high regime fractals.
Fig 10
Fig 10. Schematics of various H-tree parameters.
(a-1 to a-3) Schematics of consecutive stages in the generation of a D = 1.5 H-Tree featuring m = 3 repeating levels of the H pattern. In panel a-3, the pattern’s WSi-min, WSi-max, and total width W are marked. By incorporating branch segments ranging from L0 to LN, we generated trees with m repeating levels of the H pattern (such that N = 2m-1). (b) Schematic representation of the tortuosity calculation for an H-Tree. The yellow line is the path length from the H-Tree center to the end of the final repeating level and is the same for all endpoints. The green line is the displacement from the H-Tree’s center to the endpoint of fine-scale branch at the end of the yellow path length (for clarity, not all path lengths and displacements are shown). (c) Schematic demonstration of the conversion of the binary mask to the proximity heat map. (c-1) Matrix representation of the binary mask. The grey and blue pixels represent the VACNT and SiO2 surfaces, respectively. (c-2) Each pixel value is substituted with the minimum distance to the branch pixel. (c-3) Gap pixel values in (c-2) are replaced by their inverse values. (c-4) Colors in the schematic heat map represent closeness to the nearest branch pixels.
Fig 11
Fig 11. SEM images of patterned VACNT forests taken before the culturing experiments.
(a) Top-down view of entangled VACNTs on the forest’s top surface, (b) View of the sidewall of a VACNT row taken at a 40° angle. Scale bars are 2 and 10 μm, respectively.

References

    1. Lewis PM, Rosenfeld JV. Electrical stimulation of the brain and the development of cortical visual prostheses: An historical perspective. Brain Res. 2016. Jan;1630:208–24. doi: 10.1016/j.brainres.2015.08.038 - DOI - PubMed
    1. Erickson-Davis C, Korzybska H. What do blind people “see” with retinal prostheses? Observations and qualitative reports of epiretinal implant users. PLOS ONE. 2021. Feb;16(2):e0229189. doi: 10.1371/journal.pone.0229189 - DOI - PMC - PubMed
    1. Palanker D, Le Mer Y, Mohand-Said S, Muqit M, Sahel JA. Photovoltaic Restoration of Central Vision in Atrophic Age-Related Macular Degeneration. Ophthalmology. 2020. Aug;127(8):1097–104. doi: 10.1016/j.ophtha.2020.02.024 - DOI - PMC - PubMed
    1. Ayton LN, Barnes N, Dagnelie G, Fujikado T, Goetz G, Hornig R, et al.. An update on retinal prostheses. Clinical Neurophysiology. 2020. Jun;131(6):1383–98. doi: 10.1016/j.clinph.2019.11.029 - DOI - PMC - PubMed
    1. Kapetanovic JC, Troelenberg N, Edwards TL, Xue K, Ramsden JD, Stett A, et al.. Highest reported visual acuity after electronic retinal implantation. Acta Ophthalmologica. 2020. Apr;98(7):736–40. doi: 10.1111/aos.14443 - DOI - PubMed

Publication types

Substances