. 2022 Apr 12;55(4):623-638.e5.
doi: 10.1016/j.immuni.2022.03.009. Epub 2022 Apr 5.

Epithelial STAT6 O-GlcNAcylation drives a concerted anti-helminth alarmin response dependent on tuft cell hyperplasia and Gasdermin C

Affiliations

Epithelial STAT6 O-GlcNAcylation drives a concerted anti-helminth alarmin response dependent on tuft cell hyperplasia and Gasdermin C

Ming Zhao et al. Immunity. .

Erratum in

Abstract

The epithelium is an integral component of mucosal barrier and host immunity. Following helminth infection, the intestinal epithelial cells secrete "alarmin" cytokines, such as interleukin-25 (IL-25) and IL-33, to initiate the type 2 immune responses for helminth expulsion and tolerance. However, it is unknown how helminth infection and the resulting cytokine milieu drive epithelial remodeling and orchestrate alarmin secretion. Here, we report that epithelial O-linked N-Acetylglucosamine (O-GlcNAc) protein modification was induced upon helminth infections. By modifying and activating the transcription factor STAT6, O-GlcNAc transferase promoted the transcription of lineage-defining Pou2f3 in tuft cell differentiation and IL-25 production. Meanwhile, STAT6 O-GlcNAcylation activated the expression of Gsdmc family genes. The membrane pore formed by GSDMC facilitated the unconventional secretion of IL-33. GSDMC-mediated IL-33 secretion was indispensable for effective anti-helminth immunity and contributed to induced intestinal inflammation. Protein O-GlcNAcylation can be harnessed for future treatment of type 2 inflammation-associated human diseases.

Keywords: Gasdermin; IL-10; IL-25; IL-33; O-GlcNAc; OGT; STAT6; Tuft cell; colitis; goblet cell.


Conflict of interest statement

Declaration of interests The authors disclose no conflicts.

Figures

Figure 1.
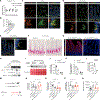
Figure 1.. Defective tuft cell hyperplasia and anti-helminth activity in IECΔOgt mice.
(A) Intestinal O-GlcNAcylation and pY-STAT6 post H. polygyrus infection (n = 3). (B, C) Immunostaining (B) and quantification (C) of tuft cells in the small intestine (SI) of naïve wildtype (n = 12) and IECΔOgt mice (n = 6). (D) Expression of tuft cell marker genes in the IECs from naïve mice (n = 5). (E, F) Immunostaining (E) and quantification (F) of SI tuft cells (n = 7–10) at 14 days post-infection (dpi). (G) SI Il25 gene expression (n = 5). (H) Enumeration of worm eggs in the feces (n = 10–11). (I-M) Control (n = 4–10) and IECΔOgt mice (n = 3–10) were infected with N. brasiliensis for 7 days. Tuft cells were stained (I) and then quantified (J). Il25 gene expression was determined (K). Live adult worms in the intestinal (L) and fecal eggs (M) were enumerated. Data are represented as mean ± SEM. * P < 0.05, ** P < 0.01, *** P < 0.001 by two-tailed unpaired Student’s t-test. Scale bar = 50 μm. Please also see Figure S1.
Figure 2.
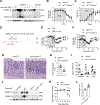
Figure 2.. Defective. Defective type 2 immune responses and goblet cell hyperplasia in IECΔOgt mice.
(A,B) Flow cytometry of GATA3+ Th2 cells among non-Treg CD4 T cells (A) and frequencies of Th2 cells among CD45+ cells (B, n = 3–4) in the SI lamina propria of H. polygyrus-infected mice. (C, D) Flow cytometry (C) and percentage (D, n = 3–4) of Ki67+ ILC2 cells in the SI lamina propria of H. polygyrus-infected mice. (E) Il13 and Il4 expression in the SI of H. polygyrus-infected mice (n = 5). (F, G) Immunostaining (F) and quantification (G) of Siglec-F+ eosinophils in the SI of H. polygyrus-infected mice (n = 4). (H-J) Alcian blue staining of the SI of H. polygyrus-infected mice (H). Goblet cell number (I) and size (J) were quantified (n = 4–6). (K-N) Mice were infected with N. brasiliensis. Il13 and Il4 gene expression was determined (K, n = 3–4). Goblet cells were stained with Alcian blue (L, n = 5) and their number (M) and size (N) were quantified. Data are represented as mean ± SEM. * P < 0.05, ** P < 0.01, *** P < 0.001 by two-way ANOVA (I, J) or two-tailed unpaired Student’s t-test. Scale bar = 50 μm. Please also see Figure S2.
Figure 3
Figure 3. OGT in mature tuft cells is dispensable for antihelminth responses.
(A,B) Generation (A) and validation (B) of OGT overexpression in mouse intestinal epithelium. (C, D) H. polygyrus-infected mice (n = 5–7) were sacrificed for SI tuft cell quantification (C) and fecal worm egg enumeration (D). (E, F) IECmOGA-Tg mice were generated (E) and expression of tuft cell markers was determined (F, n = 5–6). (G) Generation of TuftΔOgt mice. (H) Validation of O-GlcNAc depletion by immunostaining in DCLK1+ tuft cells of TuftΔOgt mice. (I-K) Tamoxifen-fed control and TuftΔOgt mice were infected with H. polygyrus. DCLK1 staining (I) and quantification (J, n = 3–5) of SI tuft cells. Enumeration of fecal worm eggs (L, n = 10–12). (L, M) Control (n = 4) and TuftΔOgt (n = 7) mice were infected with N. brasiliensis. SI tuft cells were stained (L) and quantified (M). (N-P) ISCΔOgt mice were generated (N) and SI organoids (n = 4) were treated with 4-OHT to induce Ogt deletion (O). Expression of the Dclk1 gene was determined (P) Data are represented as mean ± SEM. * P < 0.05, ** P < 0.01, *** P < 0.001 by two-way ANOVA (J, O, P) and two-tailed unpaired Student’s t-test. n.s., not significant. Scale bar = 50 μm. Please also see Figure S3.
Figure 4
Figure 4. STAT6 O-GlcNAcylation promotes Pou2f3 transcription.
(A,B) STAT6 immunostaining (A) and ratio of nuclear vs. cytoplasmic fluorescent intensity (B) in SI from H. polygyrus-infected mice (n = 7–8). (C, D) pY-STAT6 immunostaining (C) and immunoblotting (D) in SI epithelial cells from H. polygyrus-infected mice (n = 3–4). (E) HEK 293 cells were transfected and treated with human IL-4 for 20 min. Whole cell lysate and STAT6 immunoprecipitation were immunoblotted. (F) HEK 293 cells were pre-treated with OGT inhibitors overnight, stimulated with human IL-4 for 4 hours, and subjected to immunoblotting. (G) IEC protein from Stat6−/−, IECΔOgt and their controls was subjected to STAT6 immunoprecipitation, followed by immunoblotting with an anti-O-GlcNAc antibody. (H) SI organoids were pre-treated with an OGT inhibitor overnight, stimulated with murine IL-4, and subjected to pY-STAT6 and O-GlcNAc immunoblotting. (I) SI organoids from control and IECmOGA-Tg mice were treated with or without IL-4, and subjected to pY-STAT6 immunoblotting. (J, K) p2xSTAT6-Luc2P luciferase reporter assays in HEK 293 cells co-transfected with OGT and STAT6 (E, n = 3) or treated with OGT inhibitor and IL-4 (F, n = 4–5). (L) Structural domains of mouse STAT6. Red: O-GlcNAc sites; Green, pY site; Blue, sites critical for dimerization. (M) Flag-tagged STAT6 mutants were expressed in HEK 293 cells, immunoprecipitated, and immunoblotted for O-GlcNAcylation. (N) p2xSTAT6-Luc2P luciferase reporter assays in HEK 293 transfected with STAT6 plasmids, followed with IL-4 stimulation (top). Equal expression of STAT6 proteins was shown (bottom). (O) Flag-tagged STAT6 mutants were expressed in HEK 293 cells, treated with human IL-4, immunoprecipitated, and immunoblotted with a pan phospho-Serine antibody. (P) Flag-tagged STAT6 mutants and HA-tagged P300 were expressed in HEK 293 cells. Co-immunoprecipitated was done with an anti-Flag antibody and determined by HA immunoblotting. (Q) SI organoids were transduced with lentiviruses expressing wildtype (n = 6) or mtTAD (n = 3) STAT6, stimulated with IL-4 for 2 days, and subjected to RT-qPCR of tuft cell markers. (R) Pou2f3 gene expression in Stat6+/+ or Stat6−/− organoids treated with IL-4 for 2 days (n = 3). (S-U) Luciferase of the Pou2f3 promoter in the presence of OGT overexpression (S, n = 5), the OGT inhibitor OSMI-1 (T, n =5), or WT/mtTAD-STAT6 (U, n = 4). Data are represented as mean ± SEM. * P < 0.05, ** P < 0.01, *** P < 0.001 by one-way ANOVA (F, U), two-way ANOVA (J, K, R), or two-tailed unpaired Student’s t-test. Scale bar = 50 μm. Please also see Figure S4.
Figure 5.
Figure 5.. Intestinal epithelial Gsdmc transcription is dictated by OGT and STAT6 O-GlcNAcylation.
(A) Volcano plot showing differentially expressed gene in SI IECs in IECΔOgt vs. wildtype mice. Gsdmc2–4 genes were highlighted in red. (B)Amounts of GSDMC protein (n = 4) in the SI of wildtype and IECΔOgt mice. (C) Volcano plot showing differentially expressed gene in SI organoids with vs. without IL-4 treatment. Gsdmc2–4 genes were highlighted in red. (D, E) Relative expression of Gasdermin family genes in SI IECs (D, n = 4) and in the SI from naive vs. H. polygyrus-infected mice (F, n = 4). (F) In situ hybridization of Gsdmc2–3 (top) and Gsdmc4 (bottom) mRNA in the SI from mice after H. polygyrus infection (n = 3). * denotes granuloma. Scale bar = 200 μm. (G-I) Expression of full length (FL) and N-terminal GSDMC in the SI post H. polygyrus infection (G, n = 3), SI IECs from infected Il4ra+/+ and Il4ra−/− mice (H, n = 3), and in SI organoids treated with or without IL-4 for 6 h (I). The same Tubulin blot in Figure 1A was used in (G) for the loading control. (J, K) Gsdmc2–3 (J) and Gsdmc4 (K) expression in Stat6+/+ and Stat6−/− organoids treated with IL-4 for 2 days (n = 3). (L) SI Gsdmc2–3 and Gsdmc4 expression in wildtype (n = 5) and IECCA-STAT6-Tg (n = 4) mice. (M-O) Luciferase of the Gsdmc2 promoter in HEK 293 cells in the presence of OGT and OGA overexpression (M, n = 5), the OGT inhibitor OSMI-1 (N, n =5), or WT/mtTAD-STAT6 (O, n = 4). (P) SI organoids were transduced with lentiviral STAT6 (n = 3). Endogenous Gsdmc4 gene expression was determined. (Q) Generation of IECΔGsdmc mice. (R-S) Mice were infected with H. polygyrus. (R) Tuft cell marker gene expression (n = 4–5). (S) Quantification of tuft cell number (n = 4–6). (T) Alcian staining and quantification of goblet cells (n = 4–6). (U) Enumeration of fecal worm eggs (n = 4–5). Data are represented as mean ± SEM. * P < 0.05, ** P < 0.01, *** P < 0.001 by one-way ANOVA (D, M, O), two-way ANOVA (J, K) or two-tailed unpaired Student’s t-test. Please also see Figure S5.
Figure 6.
Figure 6.. GSDMCN in goblet cells mediates IL-33 secretion.
(A) Expression of tuft cell marker genes in organoids treated with IL-4 (n = 3). (B) Numbers of differentially expression genes among wildtype and IECΔGsdmc organoids that were treated with or without IL-4 for 2 days. (C-E) Co-staining of IL-33 with goblet cell markers AG2 (C, D) and FCGBP (E) in naïve (C) and H. polygyrus infected (D, E) SI. (F) In situ hybridization of Gsdmc2–3 and Gsdmc4 mRNA in the SI from H. polygyrus infected mice. Dotted lines outline the transient amplifying zone. (G) GSDMC immunofluorescent in the SI from infected mice. White arrow indicates GSDMC-sufficient cells due to the mosaic expression of Vil1-Cre. This rare area was deliberately selected to show the specificity of GSDMC antibody. (H) IL-33 and Tet-ON GSDMCN plasmids were co-transfected into 293 cells, treated with/without doxycycline (Dox) and glycine for 5 h. Whole cell lysate (WCL) and medium were subjected to Immunoblotting. (I-K) Freshly isolated villus (EDTA isolation) and crypt (D-sorbitol/sucrose isolation) IECs from infected mice were cultured for 5 hours, then medium was collected and concentrated for IL-33 Immunoblotting (I, n = 4–5), IL-33 ELISA (J, n = 3), and LDH quantification (K, not concentrated, n = 3). (L) IL-33 secretion from freshly isolated IECs from infected Il4ra+/+ and Il4ra−/− mice was quantified by ELISA (n = 3). (M-N) IECΔGsdmc mice were infected with H. polygyrus, followed with IL-33 treatment for 7 days (M). Tuft cell number (N), goblet cell number (O), goblet cell size (P) and fecal egg output (Q) were shown. Data are represented as mean ± SEM. * P < 0.05, ** P < 0.01, *** P < 0.001 by one-way ANOVA (M-Q), two-way ANOVA (J, K), or two-tailed unpaired Student’s t-test (L). Scale bar = 50 μm. Please also see Figure S6.
Figure 7.
Figure 7.. GSDMC drives intestinal type 2 inflammation.
(A) Expression of GSDMC protein in the colon during the course of acute DSS colitis. (B, C) Uninfected wildtype (n = 6) and IECΔGsdmc (n = 4) mice were induced for colitis. Percentage of body weight loss (B) and colitis scores (C) were determined. (D) Timeline for GSDMC induction by H. polygyrus infection during the repair phase of DSS colitis. (E) Percentage of body weight loss in C57BL/6 mice that were induced for colitis only (n = 6) or combined with H. polygyrus infection on day 5 (n = 7). (F-I) Wildtype and IECΔGsdmc mice (n = 4) were treated with DSS and then infected with H. polygyrus (D). (F) Percentage of body weight loss. (G) Intestinal architecture and immune cell infiltration. Scale bar = 50 μm. (H) Histomorphological score of colitis at the distal colon. 2 areas from each mouse were scored. (I) Expression of intestinal Gsdmc2–3, Il1b, and Tnfa genes. (J) Expression of GSDMC in 8-week old wildtype, Il10−/−, Gsdmc−/−, and Gsdmc−/−;Il10−/− mice. (K-L) 8-week-old Il10−/− (n = 5) and Gsdmc−/−;Il10−/− (n = 5) mice were subjected to acute DSS. Percentage of body weight loss (K) and colon length (L) were measured. Data are represented as mean ± SEM. * P < 0.05, ** P < 0.01, *** P < 0.001 by two-way ANOVA (E, F, and K) or two-tailed unpaired Student’s t-test. Please also see Figure S7.

Comment in

References

    1. Allen JE, and Sutherland TE (2014). Host protective roles of type 2 immunity: parasite killing and tissue repair, flip sides of the same coin. Semin Immunol 26, 329–340. - PMC - PubMed
    1. Anthony RM, Rutitzky LI, Urban JF Jr., Stadecker MJ, and Gause WC (2007). Protective immune mechanisms in helminth infection. Nat Rev Immunol 7, 975–987. - PMC - PubMed
    1. Bach JF (2018). The hygiene hypothesis in autoimmunity: the role of pathogens and commensals. Nat Rev Immunol 18, 105–120. - PubMed
    1. Bamias G, and Cominelli F (2015). Role of type 2 immunity in intestinal inflammation. Curr Opin Gastroenterol 31, 471–476. - PMC - PubMed
    1. Banerjee A, Herring CA, Chen B, Kim H, Simmons AJ, Southard-Smith AN, Allaman MM, White JR, Macedonia MC, McKinley ET, et al. (2020). Succinate Produced by Intestinal Microbes Promotes Specification of Tuft Cells to Suppress Ileal Inflammation. Gastroenterology - PMC - PubMed