. 2022 Apr 5;34(4):564-580.e8.
doi: 10.1016/j.cmet.2022.03.005.

Deadenylase-dependent mRNA decay of GDF15 and FGF21 orchestrates food intake and energy expenditure

Affiliations

Deadenylase-dependent mRNA decay of GDF15 and FGF21 orchestrates food intake and energy expenditure

Sakie Katsumura et al. Cell Metab. .

Abstract

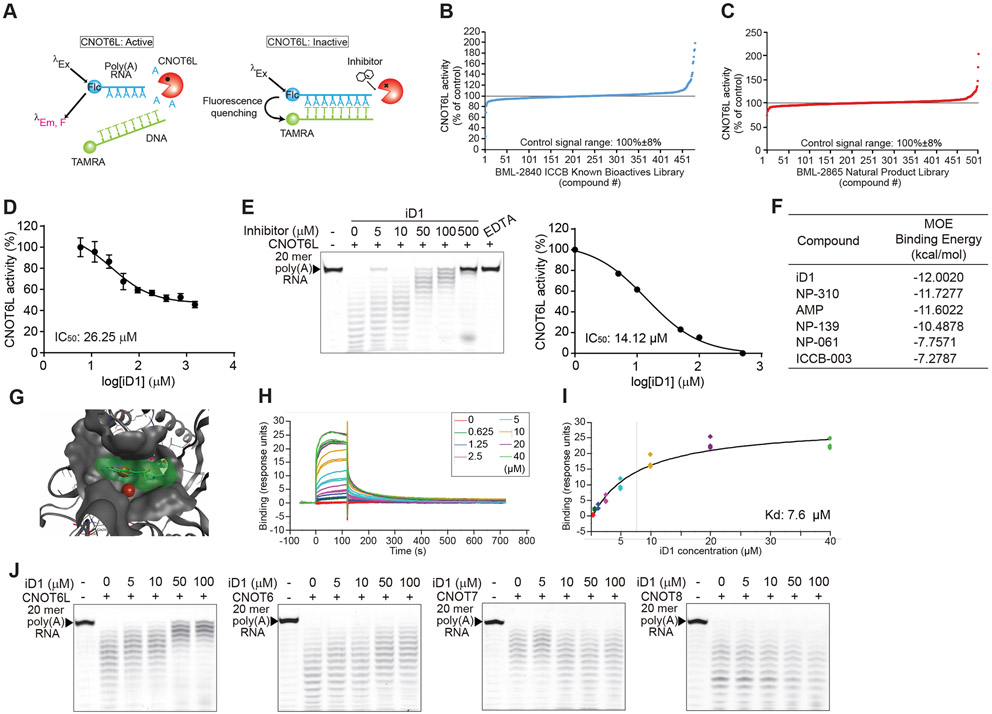
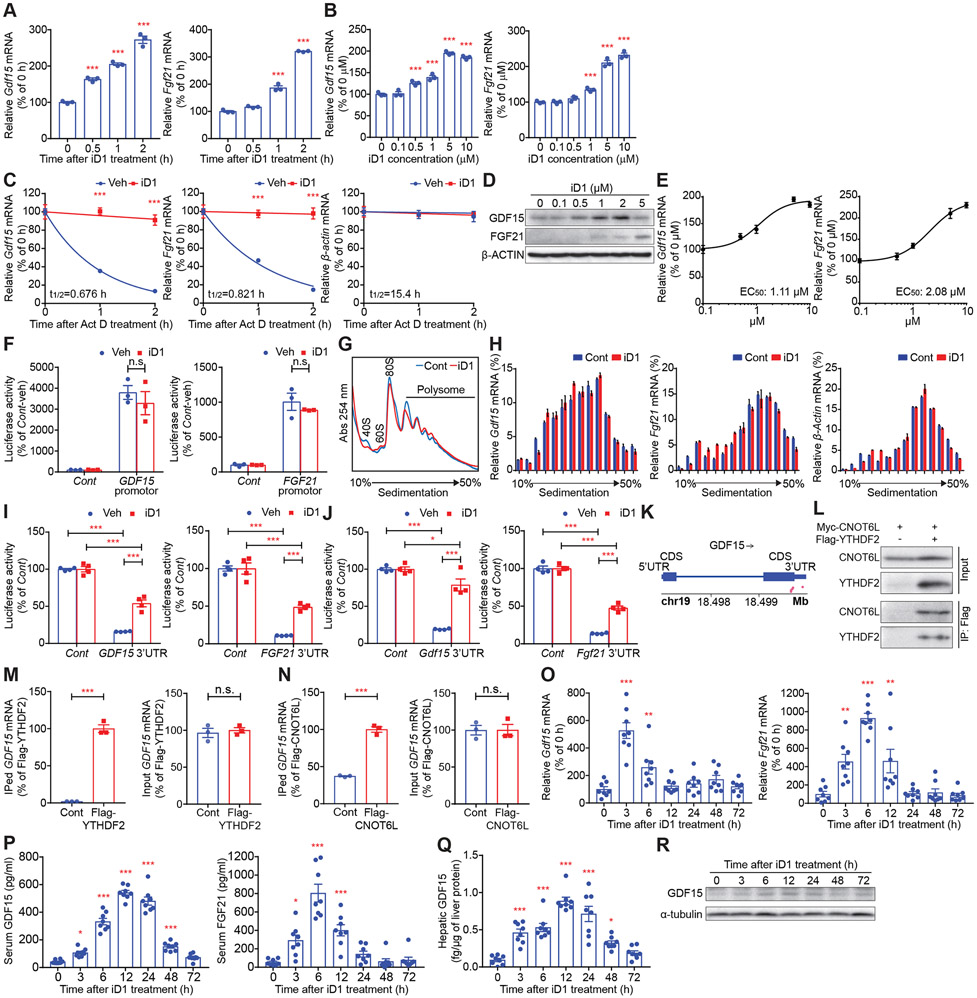
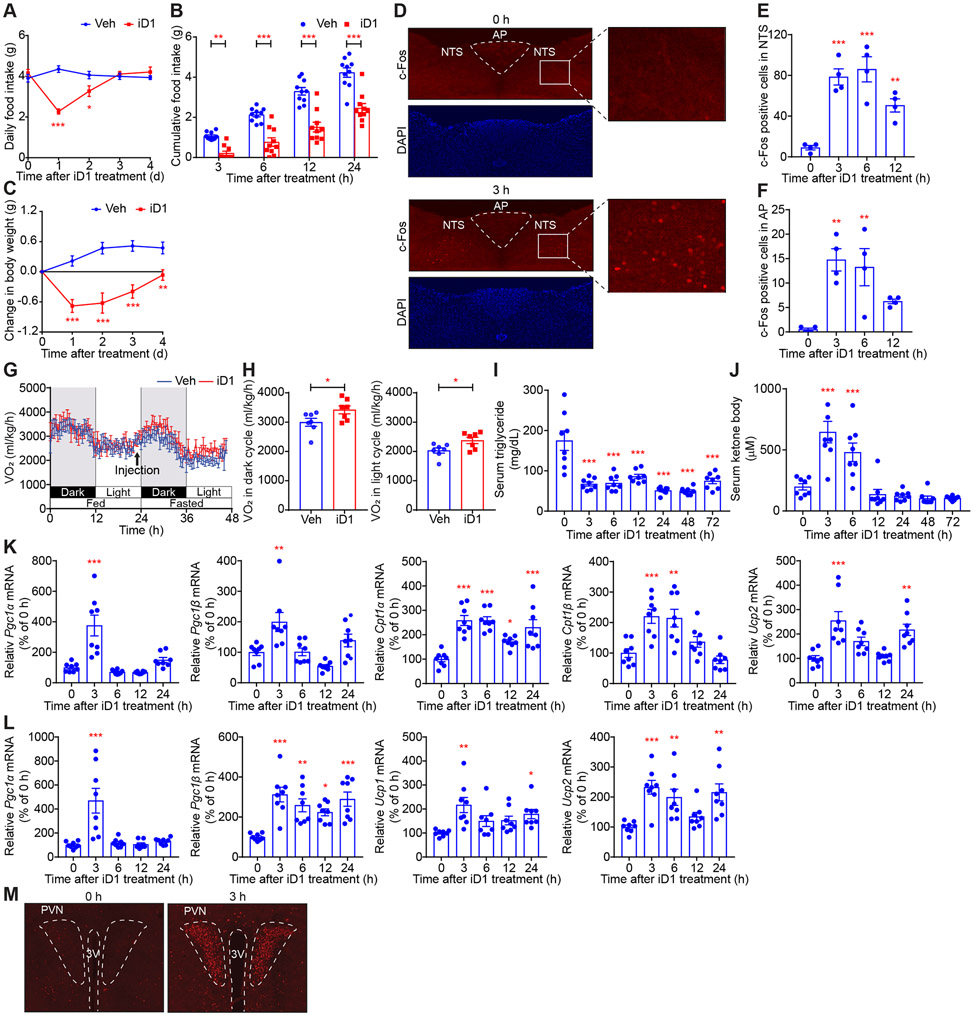
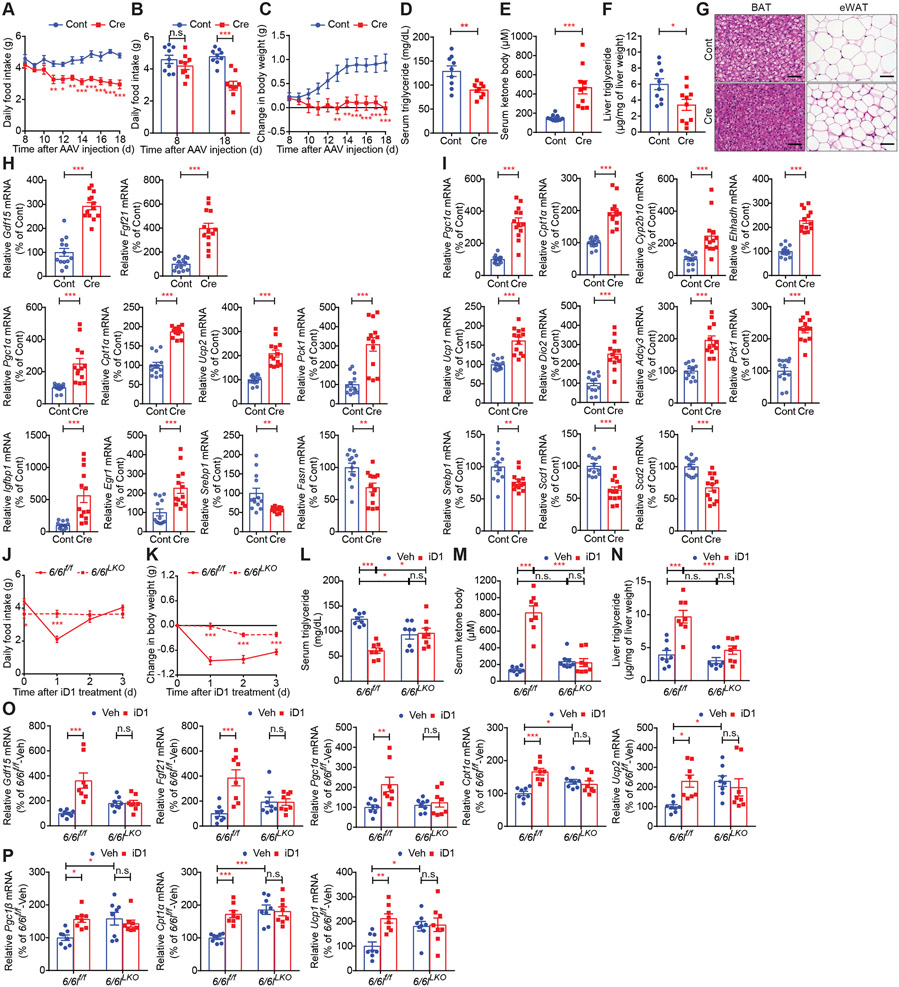
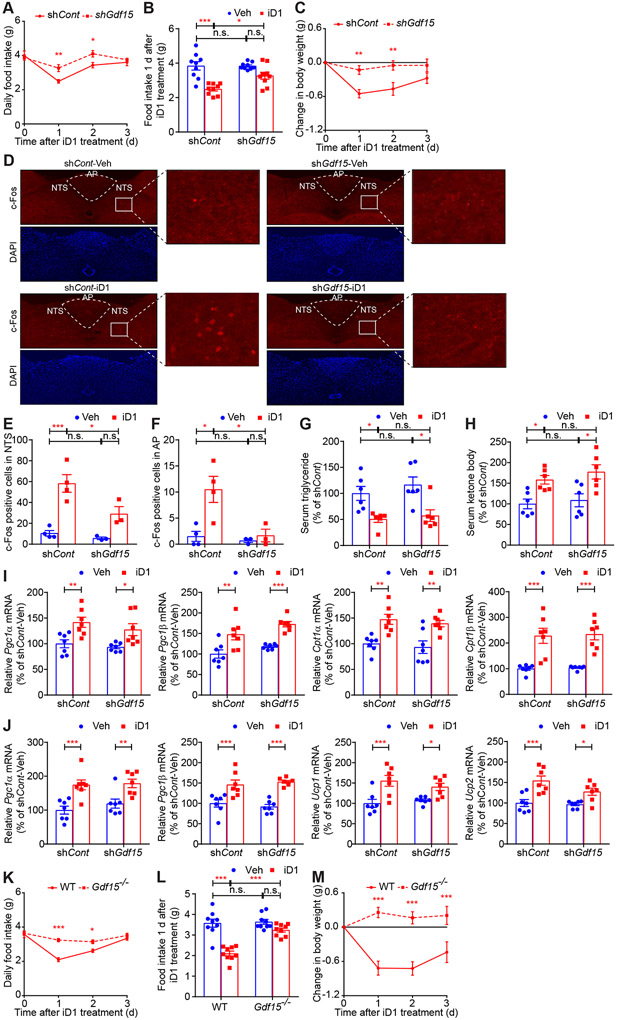
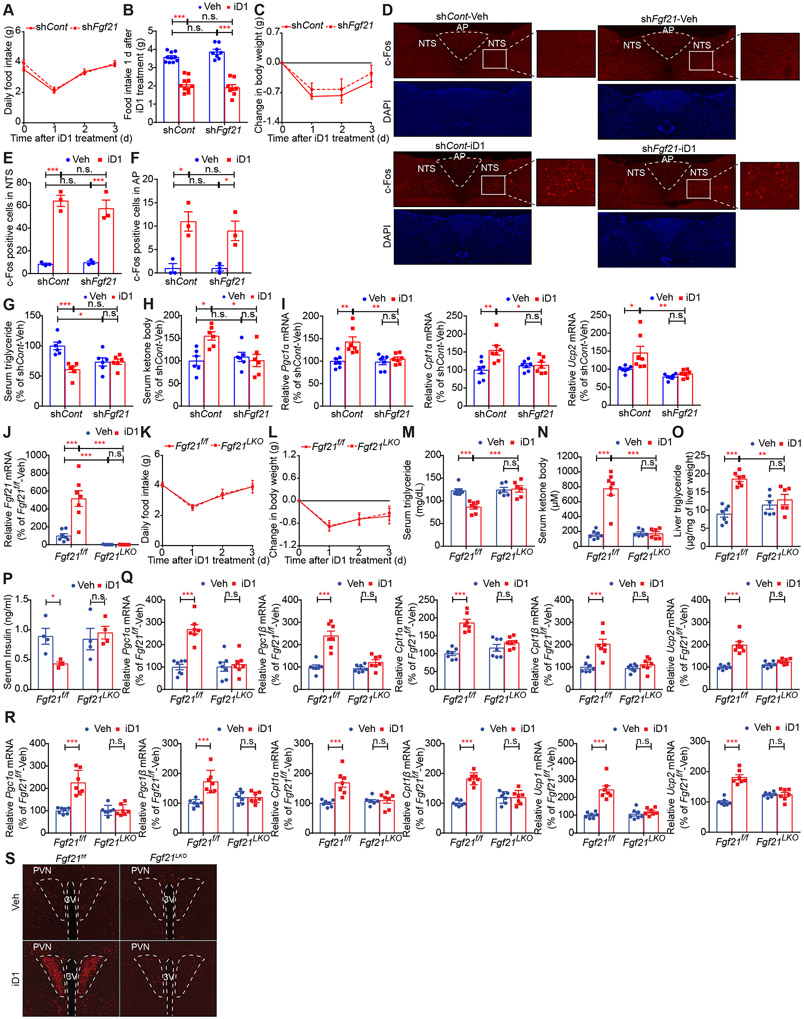
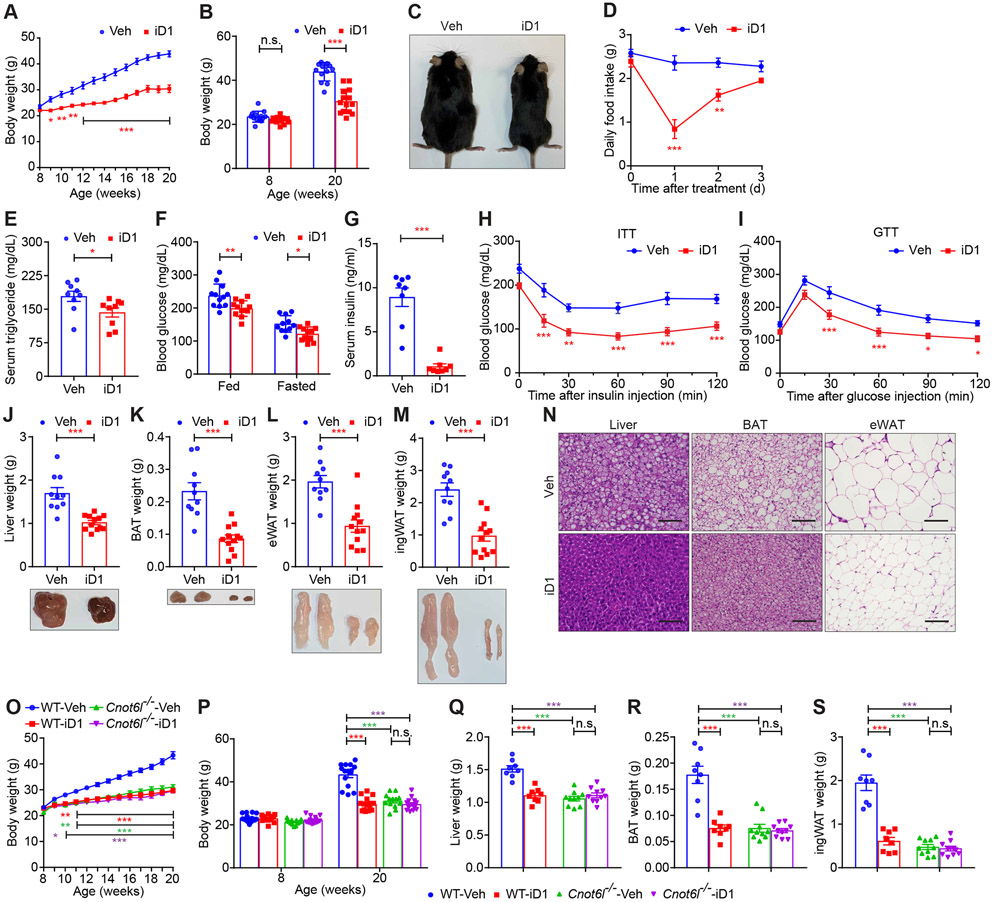
Hepatokines, secretory proteins from the liver, mediate inter-organ communication to maintain a metabolic balance between food intake and energy expenditure. However, molecular mechanisms by which hepatokine levels are rapidly adjusted following stimuli are largely unknown. Here, we unravel how CNOT6L deadenylase switches off hepatokine expression after responding to stimuli (e.g., exercise and food) to orchestrate energy intake and expenditure. Mechanistically, CNOT6L inhibition stabilizes hepatic Gdf15 and Fgf21 mRNAs, increasing corresponding serum protein levels. The resulting upregulation of GDF15 stimulates the hindbrain to suppress appetite, while increased FGF21 affects the liver and adipose tissues to induce energy expenditure and lipid consumption. Despite the potential of hepatokines to treat metabolic disorders, their administration therapies have been challenging. Using small-molecule screening, we identified a CNOT6L inhibitor enhancing GDF15 and FGF21 hepatokine levels, which dramatically improves diet-induced metabolic syndrome. Our discovery, therefore, lays the foundation for an unprecedented strategy to treat metabolic syndrome.

Keywords: CCR4-NOT deadenylase complex; FGF21; GDF15; energy expenditure; food intake; hepatokine; inter-organ communication; mRNA degradation; metabolic syndrome.


Conflict of interest statement

Declaration of interests The authors declare no competing interests.

Figures

Figure 1.
Figure 1.. Identification of the CNOT6L inhibitor
(A) Schematic diagram of FRET-based deadenylase assay. When CNOT6L activity was suppressed by a compound, 6-FAM fluorescence of the intact substrate was quenched upon probe hybridization because of the proximity of the TAMRA fluorophore. (B and C) FRET-based HTS for CNOT6L inhibitor candidates from two compound libraries, BML-2840 ICCB Known Bioactives Library (B) and BML-2865 Natural Product Library (C). (D) FRET-based deadenylase assay showing the dose-dependent inhibition curve of CNOT6L activity with iD1. CNOT6L protein and iD1 at the indicated concentration were incubated with 6-FAM-poly(A)12 RNA and TAMRA-oligo(dT) DNA. Fluorescence intensity was measured to calculate IC50 of iD1. n = 3 per group. (E) Gel-based deadenylase assay of CNOT6L with iD1. 2.5 μM of CNOT6L protein and iD1 at the indicated concentration were incubated with 5’-FITC-poly(A)20 RNA. Labeled RNAs were visualized on a denaturing sequencing gel (left). The dose-dependent inhibition curve of CNOT6L activity with iD1 was calculated from the left panel (right). EDTA was used as a positive control. (F) List of the binding energy of the indicated compounds with CNOT6L. Binding energy was calculated in the MOE software. (G) The docking model of iD1 to a cleft of the CNOT6L deadenylase domain. The docking model of the active-site pocket of CNOT6L (PDB: 3NGO) (grey) with iD1 (green) and Mg2+ (red) was built in the MOE software. (H and I) The normalized steady-state affinity curve showing the binding of iD1 to CNOT6L protein on the sensor chip surface. Serial dilutions of iD1 were used to calculate Kd = 7.6 μM. (J) Gel-based deadenylase assay of the indicated deadenylase with iD1. CNOT6L, CNOT6, CNOT7, or CNOT8 protein and iD1 at the indicated concentration were incubated with 5’-FITC-poly(A)20 RNA. See also Figures S1.
Figure 2.
Figure 2.. The CNOT6L/CNOT6 inhibitor iD1 increases levels of GDF15 and FGF21 mRNAs through their stabilization
(A and B) Levels of the indicated mRNAs in mouse primary hepatocytes treated with iD1 at 5 μM for the indicated time (A) or at the indicated concentration for 1 h (B). mRNA levels were normalized to Hprt mRNA. n = 3 per group. (C) Stability of the indicated mRNAs in primary hepatocytes incubated with 5 μg/mL of Act D and Veh or 5 μM of iD1 for the indicated time. mRNA levels were normalized to Hprt mRNA. n = 3 per group. (D) Levels of GDF15 and FGF21 proteins in Huh7 cells treated with iD1 at the indicated concentration. β-ACTIN protein was used as a loading control. (E) EC50 of iD1 for Gdf15 and Fgf21 mRNA levels in primary hepatocytes. Levels of the indicated mRNAs in primary hepatocytes treated with iD1 at the indicated concentration were normalized to Hprt mRNA. n = 3 per group. (F) Relative luciferase activity of the Firefly luciferase construct without (Cont) or with a promotor of the human GDF15 or FGF21 gene in Huh7 cells treated with Veh or iD1. Values represent percent changes in normalized Firefly/Renilla luciferase activities. n = 3 per group. (G and H) Polysome profiles of livers of mice treated without (Cont) or with iD1 (iD1) (G). 40S, 60S, 80S, and polysome denote the positions of corresponding ribosomal subunits, monosome, and polysome. Distribution of the indicated mRNAs in polysome profiles from (G) was determined by RT-qPCR (H). n = 3 per group. (I and J) Relative luciferase activities of the Firefly luciferase construct without (Cont) or with the 3’UTR of the indicated human (I) or mouse (J) mRNAs in Huh7 cells treated with Veh or iD1. Values represent percent changes in normalized Firefly/Renilla luciferase activities. n = 4 per group. (K) m6A site distribution on GDF15 mRNA was analyzed from the public data of methylation individual-nucleotide resolution using crosslinking and immunoprecipitation (miCLIP). Pink dots represent m6A sites. (L) Interaction of Myc-CNOT6L with Flag-YTHDF2 examined by co-immunoprecipitation with anti-Flag antibody, followed by immunoblotting with anti-Myc and anti-Flag antibody. (M and N) Association of YTHDF2 or CNOT6L with the indicated mRNA in cells transfected with Flag-YTHDF2 (M) or Flag-CNOT6L (N). Immunoprecipitated (IPed) and input mRNAs were isolated from anti-Flag immunoprecipitates and total cell lysates, respectively. Levels of IPed (left) and input (right) mRNAs were determined by qPCR. IPed mRNA levels were normalized to those of input. n = 3 per group. (O-R) Levels of Gdf15 and Fgf21 mRNAs in livers (O), serum GDF15 and FGF21 proteins (P), and hepatic GDF15 protein (Q and R) of WT mice injected with iD1 for the indicated time. mRNA levels were normalized to Hprt mRNA. α-tubulin was used as a loading control. n = 8 per group. Data represent mean ± SEM. *p < 0.05, **p < 0.01, ***p < 0.001; p values by one-way ANOVA with Dunnett's multiple comparison test for (A, B, and O-Q), two-way ANOVA with Bonferroni's multiple comparison test for (C, F, and H-J), or Student’s t-test for (M and N). See also Figures S1 and S2.
Figure 3.
Figure 3.. CNOT6L controls food intake, energy expenditure, and lipid metabolism through regulation of hepatokines
(A-C) Daily food intake (A), cumulative food intake for the indicated time (B), and change in body weight (C) after a single administration of Veh or iD1 in WT mice. n = 10 per group. (D-F) Immunofluorescence (IF) staining of c-Fos in NTS and AP of the hindbrain of WT mice treated with iD1 for the indicated time (D). Quantification of c-Fos positive cells in NTS (E) and AP (F) of mice treated with iD1 for the indicated time. n = 4 per group. (G and H) Oxygen consumption (VO2) for 48 h (G) and average VO2 of dark- or light-cycle during fasting after a single administration of Veh or iD1 into WT mice (H). VO2 was normalized to body weight. n = 7 per group. (I-L) Levels of serum triglycerides (I), serum ketone bodies (J), and the indicated mRNAs in livers (K) and BAT (L) in WT mice treated with iD1 for the indicated time. mRNA levels were normalized to Hprt mRNA. n = 8 per group. (M) IF staining of c-Fos in PVN of the hypothalamus of WT mice treated with iD1 for the indicated time. Representative images of three independent experiments are presented. 3rd ventricle (3V). Data represent mean ± SEM. *p < 0.05, **p < 0.01, ***p < 0.001; p values by one-way ANOVA with Dunnett's multiple comparison test for (E, F, and I-L), two-way ANOVA with Bonferroni's multiple comparison test for (A-C), or Student’s t-test for (H). See also Figure S3.
Figure 4.
Figure 4.. Hepatic Cnot6 and Cnot6l double knockout induces loss of food intake and body weight and stimulates lipid consumption and ketogenesis through an increase in hepatokines
(A-I) Daily food intake (A), daily food intake 0 and 18 days after AAV injection (B), change in body weight (C), levels of serum triglycerides (D), serum ketone bodies (E), and liver triglycerides (F), representative H&E staining images of the indicated tissues (G), and levels of the indicated mRNAs in livers (H) and BAT (I) of Cnot6/Cnot6l conditional KO mice injected with AAV8 harboring mock (Cont) or Cre recombinase (Cre) under the liver-specific TBG promoter. mRNA levels were normalized to Hprt mRNA. n = 9-13 per group. (J-P) Daily food intake (J), change in body weight (K), and levels of serum triglycerides (L), serum ketone bodies (M), liver triglycerides (N), and the indicated mRNAs in livers (O) and BAT (P) of control (6/6lf/f) and Cnot6/Cnot6l liver-specific double KO (6/6lLKO) mice after a single administration of Veh or iD1. mRNA levels were normalized to Hprt mRNA. n = 8 per group Data represent mean ± SEM. *p < 0.05, **p < 0.01, ***p < 0.001; p value by two-way ANOVA with Bonferroni's multiple comparison test for (A-C and J-P) or Student’s t-tests for (D-F, H, and I). See also Figures S4 and S5.
Figure 5.
Figure 5.. GDF15 mediates the effect of CNOT6L inhibition on loss of food intake and body weight
(A-J) Daily food intake (A), food intake 1 day after the treatment (B), change in body weight (C), IF staining of c-Fos in NTS and AP of the hindbrain (D), quantification of c-Fos positive cells in NTS (E) and AP (F), and levels of serum triglycerides (G), serum ketone bodies (H), and the indicated mRNAs in livers (I) and BAT (J) of WT mice injected with adenovirus expressing shRNA against Gfp (shCont) or Gdf15 mRNA (shGdf15) after a single administration of Veh or iD1. mRNA levels were normalized to Hprt mRNA. n = 3-9 per group. (K-M) Daily food intake (K), food intake 1 d after the treatment (L), and change in body weight (M) of WT and Gdf15 KO (Gdf15−/−) mice after a single administration of Veh or iD1. n = 9 per group. Data represent mean ± SEM. *p < 0.05, **p < 0.01, ***p < 0.001; p values by two-way ANOVA with Bonferroni's multiple comparison test. See also Figure S6.
Figure 6.
Figure 6.. FGF21 mediates the iD1 effect on lipid metabolism and energy expenditure but not on food intake
(A-I) Daily food intake (A), food intake 1 d after the treatment (B), change in body weight (C), IF staining of c-Fos in NTS and AP of the hindbrain (D), quantification of c-Fos positive cells in NTS (E) and AP (F), and levels of serum triglycerides (G), ketone bodies (H), and the indicated mRNAs in livers (I) of WT mice injected with adenovirus expressing shRNA against Gfp (shCont) or Fgf21 (shFgf21) mRNA after a single administration of Veh or iD1. n = 3-10 per group. (J-S) Levels of Fgf21 mRNA in livers (J), daily food intake (K), change in body weight (L), levels of serum triglycerides (M), serum ketone bodies (N), liver triglycerides (O), serum insulin (P), and the indicated mRNAs in livers (Q) and BAT (R), and IF staining of c-Fos in PVN of the hypothalamus (S) of control (Fgf21f/f) and Fgf21 liver-specific KO (Fgf21LKO) mice after a single administration of Veh or iD1. mRNA levels were normalized to Hprt mRNA. n = 6-9 per group. Data represent mean ± SEM. *p < 0.05, **p < 0.01, ***p < 0.001; p values by two-way ANOVA with Bonferroni's multiple comparison test. See also Figure S6.
Figure 7.
Figure 7.. CNOT6L inhibition has a therapeutic potential to ameliorate diet-induced metabolic disorders
(A-I) Body weight curves for 12 weeks (A), starting (8-week-old) and ending (20-week-old) body weight (B), a representative 20-week-old mouse image (C), daily food intake (D), levels of serum triglycerides (E), fed/fasted blood glucose (F), and serum insulin (G), insulin tolerance tests (ITTs) (H), glucose tolerance tests (GTTs) (I), tissue weights and representative images of livers (J), BAT (K), eWAT (L), and ingWAT (M), and representative H&E staining image of the indicated tissues (N) of WT male mice fed with HFD and treated with Veh or iD1 for 12 weeks. HFD feeding and iD1 treatment started at 8 weeks of age. n = 4-14 per group. Scale bars represent 50 μm. (O-S) Body weight curve (O), starting and ending body weight (P), and weights of livers (Q), BAT (R), and ingWAT (S) of WT and Cnot6l−/− male mice fed with HFD and treated with Veh or iD1 for 12 weeks. HFD feeding started at 8-week-old. n = 8-15 per group. Data represent mean ± SEM. *p < 0.05, **p < 0.01, ***p < 0.001; p value by Student’s t-tests for (E, G, and J-M) or two-way ANOVA with Bonferroni's multiple comparison test for (A, B, D, F, H, I, and O-S). See also Figure S7.

Comment in

References

    1. Basquin J, Roudko VV, Rode M, Basquin C, Seraphin B, and Conti E (2012). Architecture of the nuclease module of the yeast Ccr4-not complex: the Not1-Caf1-Ccr4 interaction. Mol Cell 48, 207–218. - PubMed
    1. Bhaskar V, Roudko V, Basquin J, Sharma K, Urlaub H, Seraphin B, and Conti E (2013). Structure and RNA-binding properties of the Not1-Not2-Not5 module of the yeast Ccr4-Not complex. Nat Struct Mol Biol 20, 1281–1288. - PubMed
    1. Boland A, Chen Y, Raisch T, Jonas S, Kuzuoglu-Ozturk D, Wohlbold L, Weichenrieder O, and Izaurralde E (2013). Structure and assembly of the NOT module of the human CCR4-NOT complex. Nat Struct Mol Biol 20, 1289–1297. - PubMed
    1. Chaaban I, Rizk OH, Ibrahim TM, Henen SS, El-Khawass EM, Bayad AE, El-Ashmawy IM, and Nematalla HA (2018). Synthesis, anti-inflammatory screening, molecular docking, and COX-1,2/−5-LOX inhibition profile of some novel quinoline derivatives. Bioorg Chem 78, 220–235. - PubMed
    1. Chang H, Lim J, Ha M, and Kim VN (2014). TAIL-seq: genome-wide determination of poly(A) tail length and 3' end modifications. Mol Cell 53, 1044–1052. - PubMed

Publication types