. 2022 Apr 5;39(1):110609.
doi: 10.1016/j.celrep.2022.110609.

Metabolism drives macrophage heterogeneity in the tumor microenvironment

Affiliations

Metabolism drives macrophage heterogeneity in the tumor microenvironment

Shasha Li et al. Cell Rep. .

Abstract

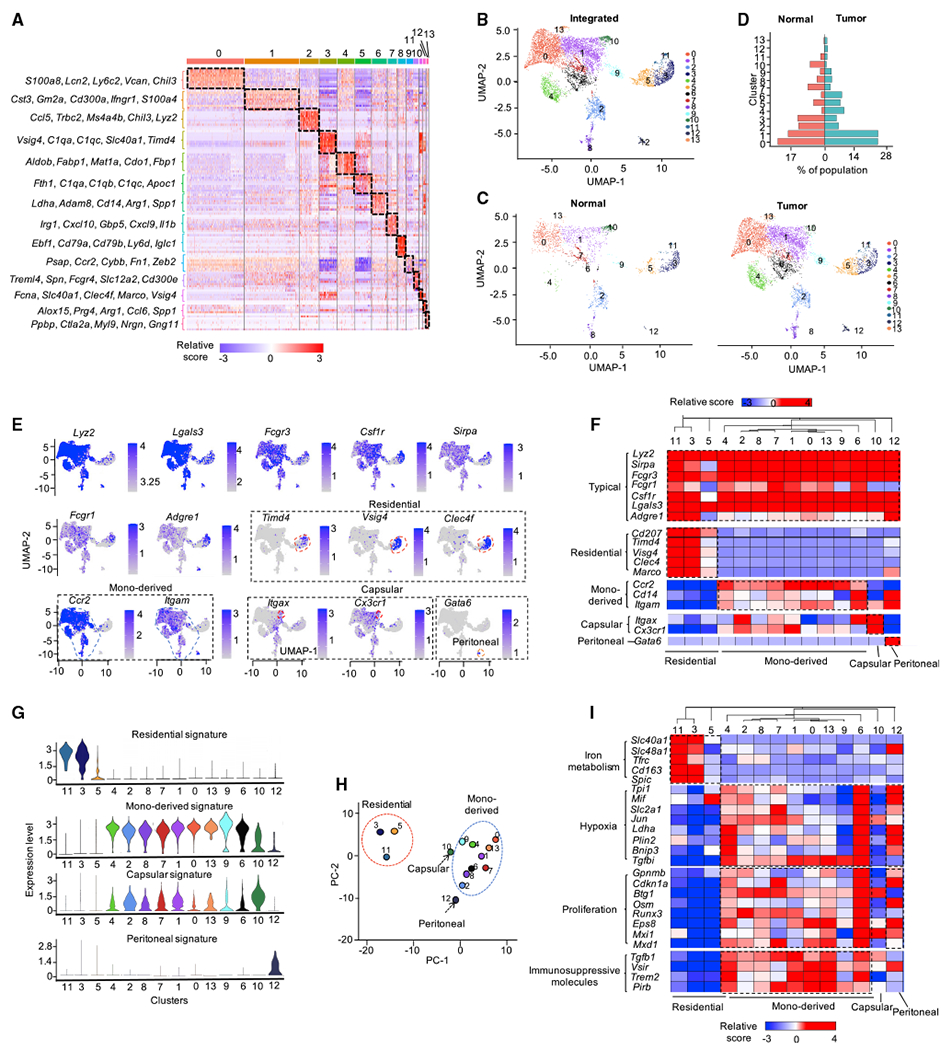
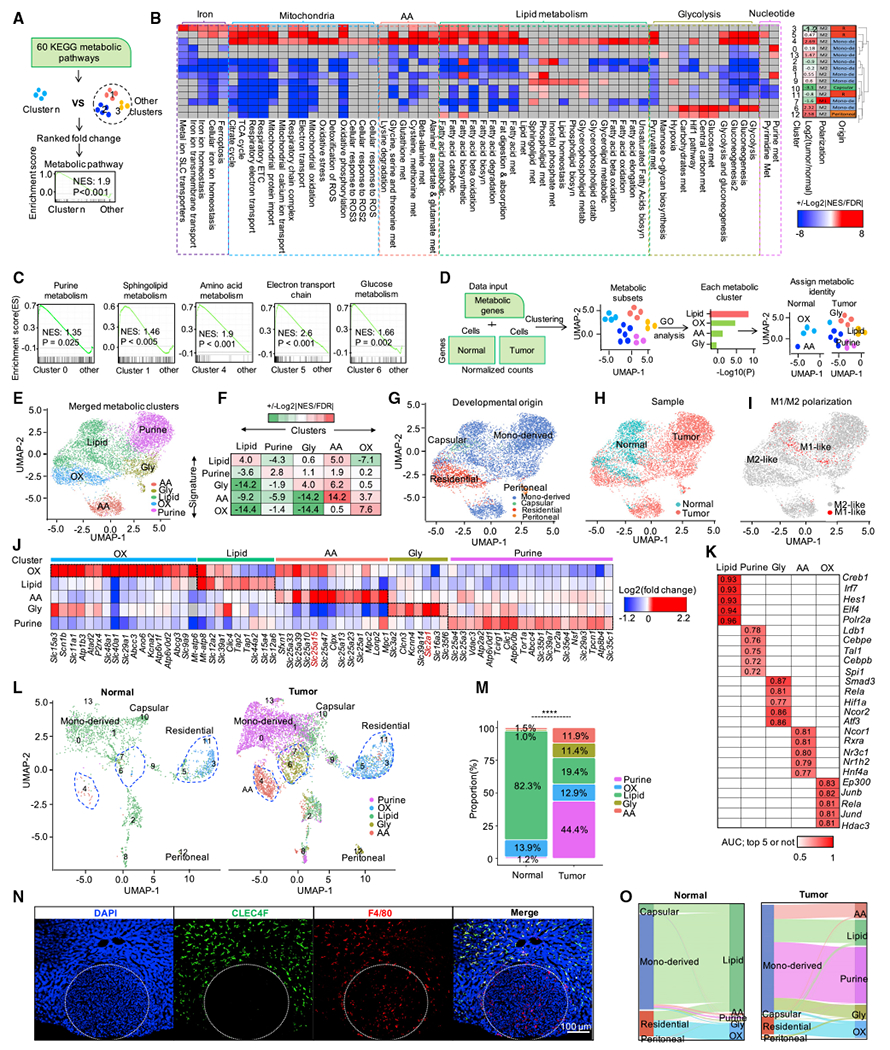
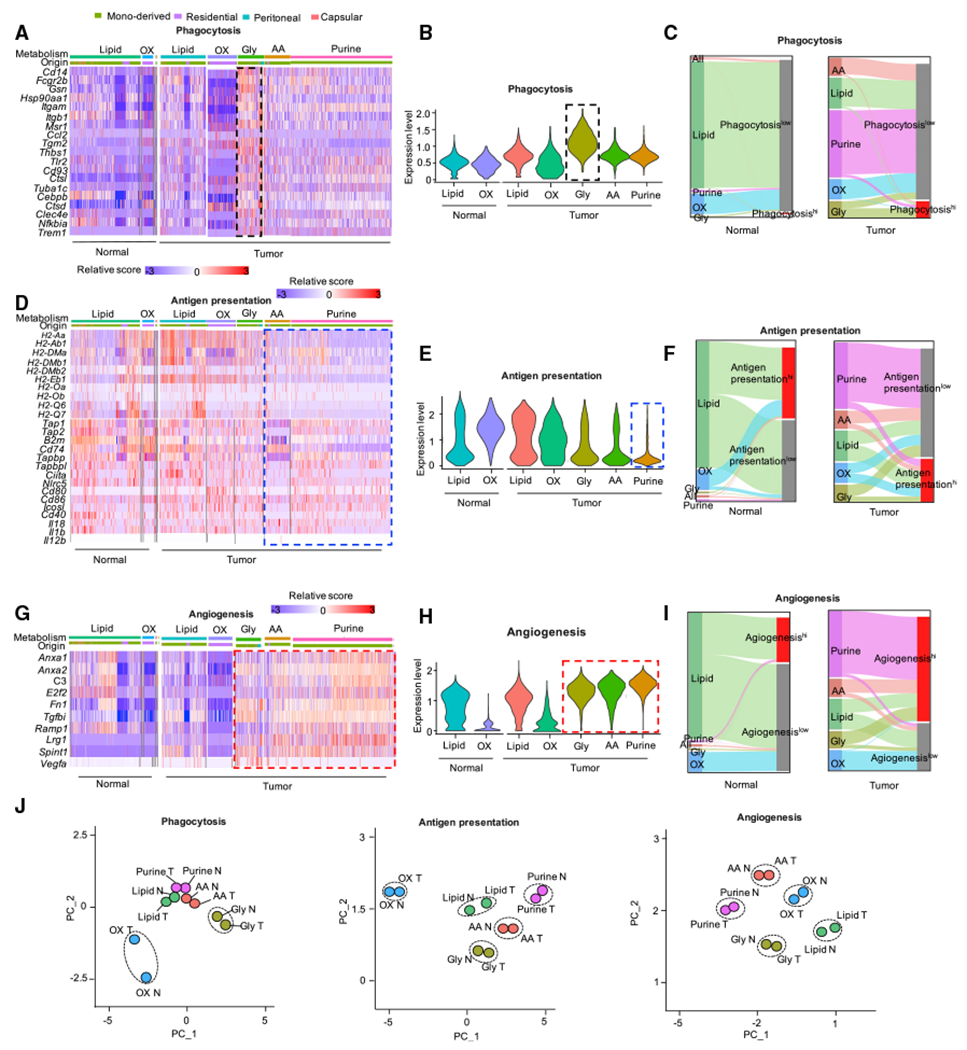
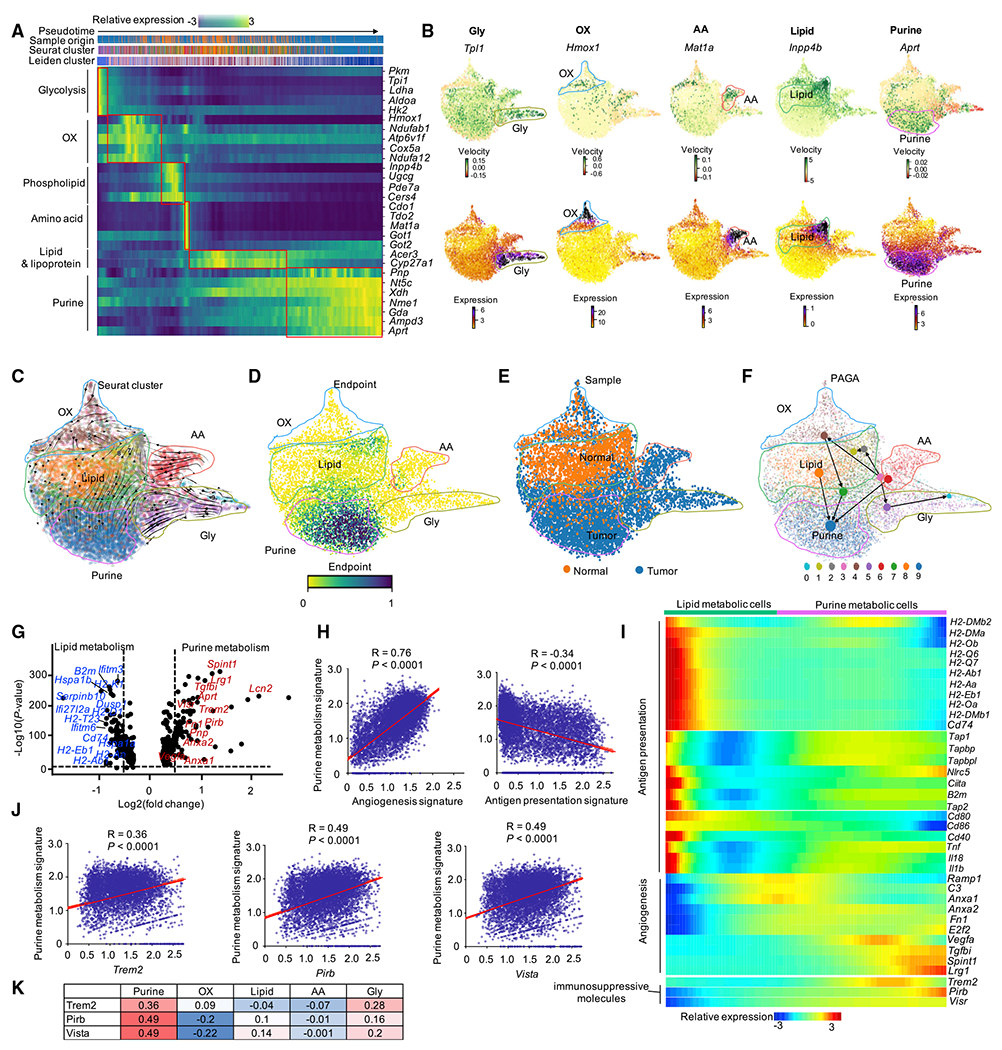
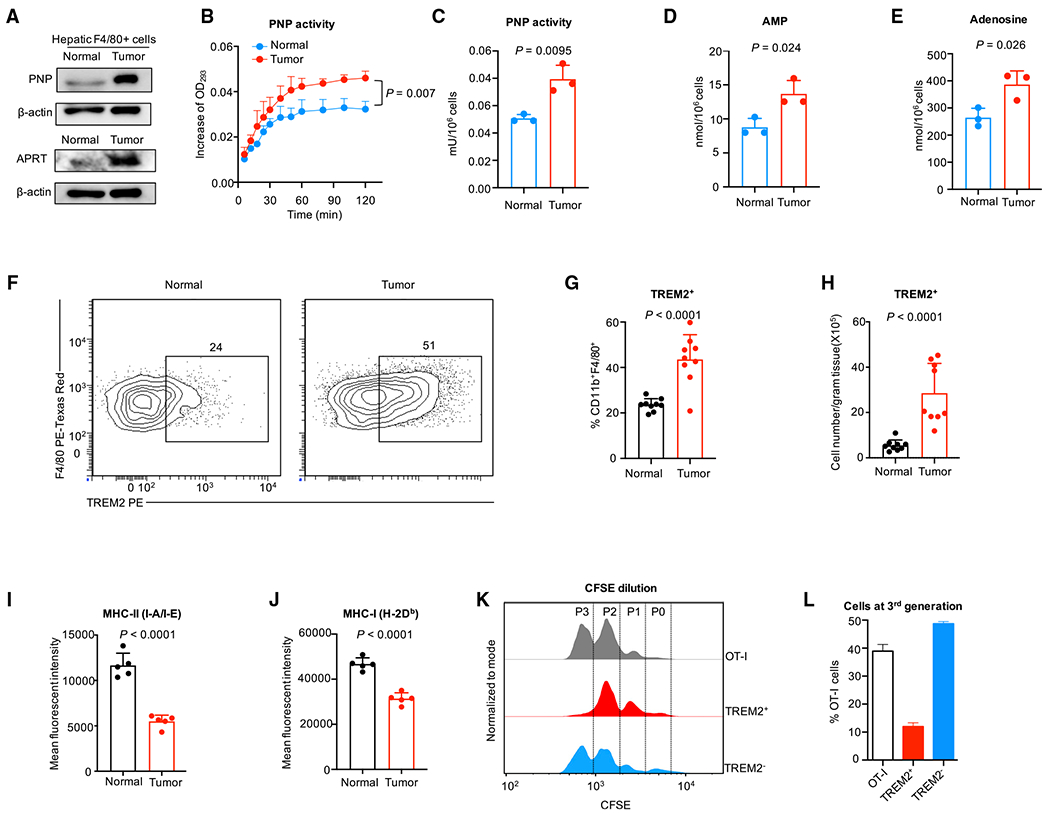
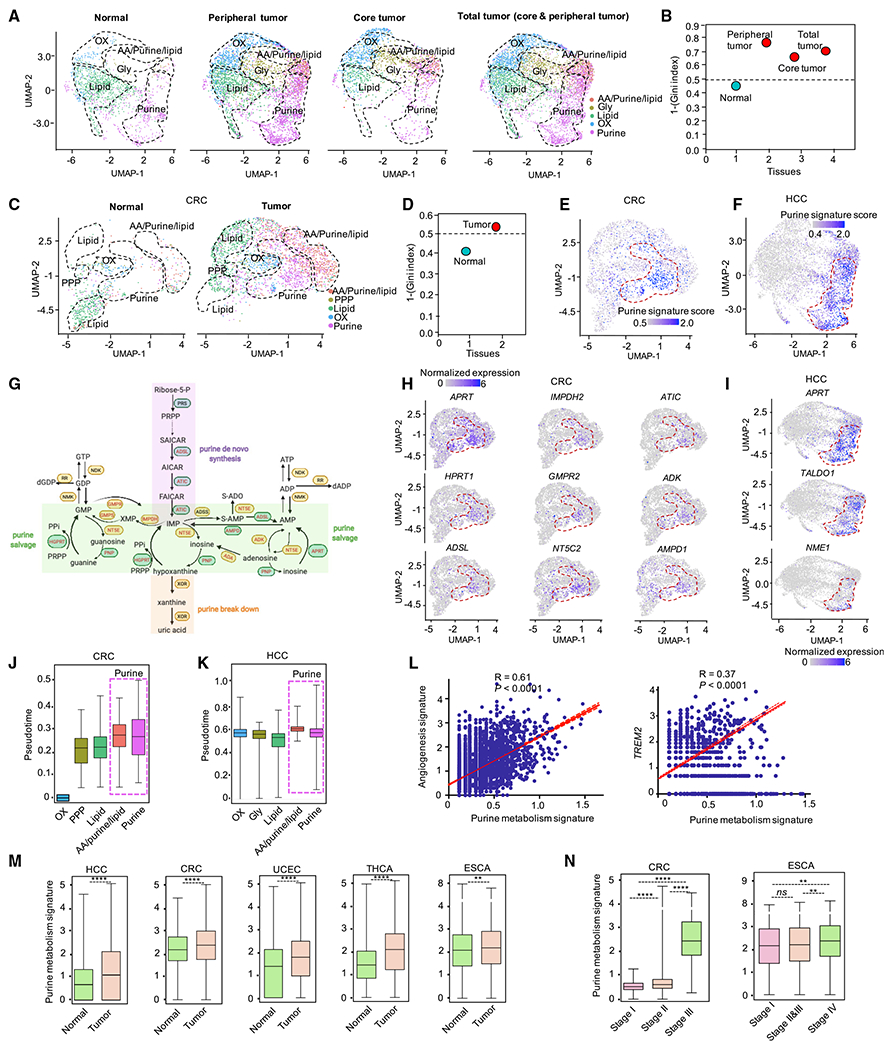
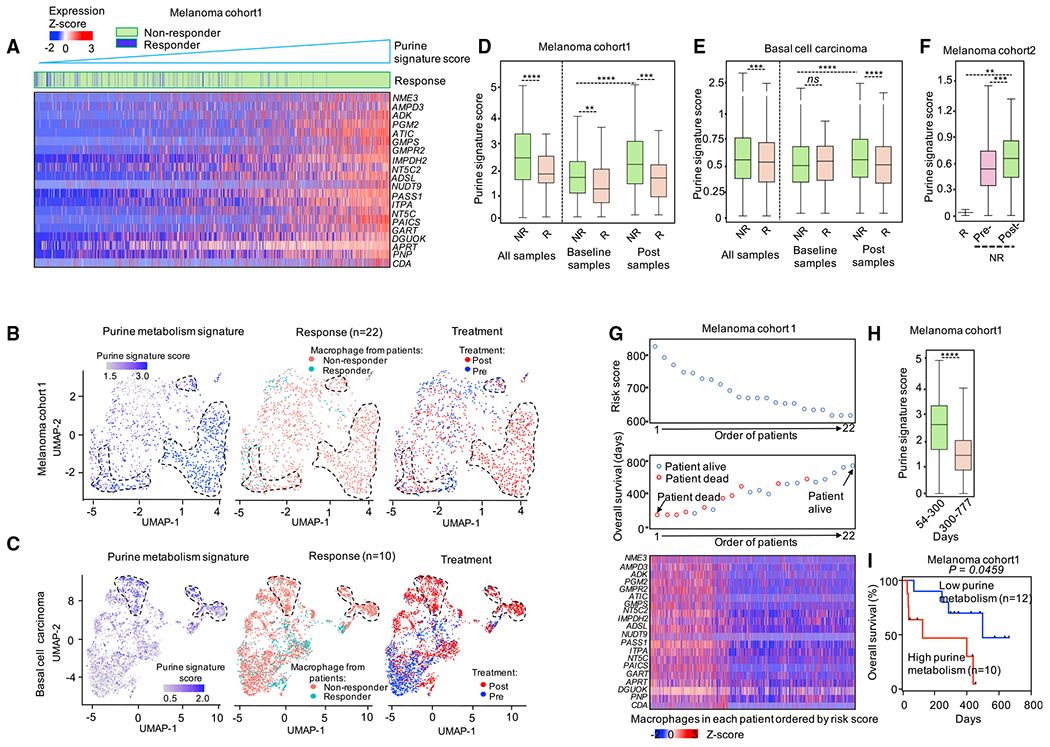
Tumor-associated macrophages (TAMs) are a major cellular component in the tumor microenvironment (TME). However, the relationship between the phenotype and metabolic pattern of TAMs remains poorly understood. We performed single-cell transcriptome profiling on hepatic TAMs from mice bearing liver metastatic tumors. We find that TAMs manifest high heterogeneity at the levels of transcription, development, metabolism, and function. Integrative analyses and validation experiments indicate that increased purine metabolism is a feature of TAMs with pro-tumor and terminal differentiation phenotypes. Like mouse TAMs, human TAMs are highly heterogeneous. Human TAMs with increased purine metabolism exhibit a pro-tumor phenotype and correlate with poor therapeutic efficacy to immune checkpoint blockade. Altogether, our work demonstrates that TAMs are developmentally, metabolically, and functionally heterogeneous and purine metabolism may be a key metabolic feature of a pro-tumor macrophage population.

Keywords: CP: Cancer; CP: Metabolism; cancer; checkpoint; immunosuppression; immunotherapy; liver; macrophage; metabolism; purine; single-cell RNA sequencing; tumor microenvironment.


Conflict of interest statement

Declaration of interests We declare that we have no competing interests.

Figures

Figure 1.
Figure 1.. Heterogeneity of TAMs within the liver TME
(A) Gene expression heatmap of 14 macrophage clusters. (B and C) UMAP visualization of integrated (B) and split projections (C) from tumor and normal sample, color-coded based on the clusters; each dot represents a single cell. (D) Proportions of each macrophage cluster in tumor and normal sample. (E) UMAP showing the expression levels of 14 selected marker genes for macrophages; expression levels are color-coded as gray: not expressed and blue: expressed. (F) Heatmap visualization of the expression of markers for typical macrophages, Kupffer cells, MDMs, LCMs, and PMs. (G) Violin plots showing the enrichment of gene signatures of Kupffer cells, MDMs, LCMs and PMs in macrophages, determined by multiple features analysis of Seurat v. 3. (H) Principal-component analysis (PCA) for 14 macrophage clusters for all marker genes in each cluster. Averaged position of all cells in each cluster were represented; dots are colored by Seurat cluster, as shown in (B). (I) Heatmap showing the expression level of iron metabolism-, hypoxia-, proliferation-related genes and T-cell-co-inhibitory molecules in Kupffer cells, MDMs, LCMs, and PMs; color of each heatmap cell represents the relative expression level of each gene (Z score).
Figure 2.
Figure 2.. TAMs manifest high metabolic diversification
(A) Schematic representing the workflow of metabolic pathway activity analysis for each macrophage cluster with scRNA-seq. (B) Landscape of the activity of different metabolic pathways in different macrophage populations (left). Enrichment analysis by GSEA; color of each heatmap cell represents the value calculated with formula: +/−Log2|NES/FDR|. Red: significantly up-regulated (nominal p < 0.05); blue: significantly down-regulated (nominal p< 0.05); gray: pathways not enriched (nominal p > 0.05). Heatmap on the right shows the ratio between tumor and normal sample and the polarization state as well as the origin, defined in Figure 1G, for each macrophage population; AA: amino acid metabolism; NES: normalized enrichment scores, FDR: false discovery rate. (C) The activity of selected metabolic pathway in selected macrophage populations. Normalized enrichment scores and nominal p values are calculated by Kolmogorov-Smirnov test. (D) Workflow of metabolic heterogeneity analysis of macrophages with scRNA-seq; GO: the gene ontology; Lipid: lipid metabolism; Purine: purine metabolism; Gly: glycolysis; AA: amino acid metabolism; OX: oxidative phosphorylation. (E) UMAP plots showing the metabolic clusters of macrophages. The color of each dot indicates the dominant metabolic cluster of each cell, determined using 1,310 metabolic genes. (F) GSEA score (+/−Log2|NES/FDR|) of 5 metabolic clusters against 5 metabolic gene signatures. Red: positively enriched; green: negatively enriched; white: not enriched. (G–I) UMAP plots showing the metabolic clusters of macrophages. The color of each dot indicates the developmental origin (G) and the sample (H) as well as the polarization state of each macrophage (I). (J) The expression level of genes from SLC family members, ABC transporters, and pump and ion channels. Fold change: each metabolic cluster compared with other clusters. (K) Enrichment analysis of transcriptional factors (TF) associated with the 5 metabolic clusters using BART (binding analysis for regulation of transcription) (Wang et al., 2018), with top 10 highly expressed genes in each cluster; top 5 significantly enriched TF in each cluster represented; red grid: top 5 or not; white grid: not available. (L) The metabolic landscape of macrophage populations from normal and tumor in the context of 14 original macrophage populations, as shown in Figure 1C, the dot color was coded based on the dominant metabolism, as shown in Figure 2E. (M) Relative proportion of cells in each metabolic cluster, as shown in Figure 2L, versus samples from normal and tumor. Chi-squared test was used to calculate the significance between tumor and normal groups; *p < 0.05, **p < 0.01, and ***p < 0.001. (N) Immunofluorescence staining of CLEC4F and F4/80 in liver tissue with tumor. (O) Sankey diagram showing the distribution of macrophages in terms of origin and metabolic clusters.
Figure 3.
Figure 3.. Metabolic profiles correlate to distinct functional programs in TAMs
(A–I) Heatmap, violin plots, and Sankey diagrams showing the expression level of genes from phagocytosis (A–C) and antigen presentation (D–F) as well as angiogenesis (G–I) pathways in metabolic cluster of AA, Gly, lipid, OXPHOS, and purine in normal and tumor. Each violin represents the score of each signature (B, E, and H); Sankey diagrams show the proportion of macrophages expressed relative functional gene signature in context of five metabolic clusters; hi: expression score >1 (C, F, and I). (J) PCA of 5 metabolic clusters with the expression level of phagocytosis-(left) and antigen presentation (middle) as well as angiogenesis (right) gene signature. Cells from normal and tumor sample were analyzed separately; each dot shows the averaged position of cells in each cluster; N: normal, T: tumor.
Figure 4.
Figure 4.. RNA velocity analysis identifies terminal-differentiated immunosuppressive macrophage subset
(A) Gene expression dynamics of selected metabolic maker genes in each cluster ordered along latent time inferred by RNA velocity analysis with scVelo. Cells were labeled by pseudo-time (first row), sample (second row), Seurat cluster (third row), and Leiden cluster (fourth row) of each cell, respectively. (B) The RNA velocity and referred expression level of selected metabolic marker genes in each metabolic cluster on the Louvain projection modeled by scVelo. Positive velocity: up-regulated; negative velocity: down-regulated. (C) RNA velocity of 5 metabolic clusters overlaid with RNA velocity stream. Cells colored by Seurat cluster, as shown in Figure 2E. (D) Endpoints analysis of macrophages. The endpoints are obtained as stationary states of the velocity-inferred transition matrix, which is given by left eigenvectors corresponding to an eigenvalue of 1, i.e., μend = μendπ. Color bars show the endpoint score of macrophages; dark blue: end. (E) UMAP embedding of macrophages modeled by scVelo. Cells were colored by the sample; orange: normal; dark blue: tumor. (F) PAGA graph showing the inferred developmental trajectories for 5 metabolic clusters. PAGA: partition-based graph abstraction. (G) Volcano plot showing the fold change versus p value of macrophages of cluster 0 (and cluster 1) from normal and tumor (as shown in Figure 2L), Representative genes were highlighted. Red: up-regulated in purine metabolism; blue: down-regulated in purine metabolism. Dashed lines show p < 0.05 and fold change >1.5. (H) Correlation analysis between gene signatures of purine metabolism (y axis) and functional programs of angiogenesis and antigen presentation (x axis) on macrophages. Pearson’s correlation coefficient (R) and correlation test (p values) were used to evaluate the association between two signatures. (I) Expression of genes from antigen presentation, angiogenesis signature, and immunosuppressive molecules along with the pseudo-time inferred by Monocle v. 2. (J) Correlation analysis between purine metabolic gene signatures (y axis) and 3 immunosuppressive molecules (x axis) on macrophages. (K) Summary of the correlation between 5 metabolic gene signatures with 3 immunosuppressive molecules; Pearson correlation coefficient was shown in each square.
Figure 5.
Figure 5.. TREM2+ TAMs display purine metabolic activity and are immunosuppressive
(A) Western blotting of APRT and PNP in F4/80+ cells sorted from liver with and without tumor. (B and C) Metabolic activity of PNP. PNP was detected in TREM2+ TAMs and hepatic F4/80+ macrophages from normal liver. Student’s t test was used to calculate the significance between two groups. (D and E) Levels of key purine pathway metabolites. AMP (D) and adenosine (E) were measured in TREM2+ TAMs and hepatic F4/80+ macrophages from normal liver. Student’s t test was used to calculate the significance between two groups. (F–H) Flow cytometry quantification of TREM2+ hepatic macrophages in liver with and without tumor. Percentage of TREM2+ hepatic macrophages in CD11b+F4/80+ macrophages (G) and cell number of TREM2+ hepatic macrophages (H) are shown. Student’s t test was used to calculate the significance between two groups. (I and J) Flow cytometry analysis of MHC-II (I-A/I-E) (I) and MHC-I (H-2Db) (J) expression in TREM2+ TAMs and macrophages from liver without tumor. Student t-test was used to calculate the significance between two groups. (K and L) Flow cytometry analysis of OT-I cell proliferation in the presence or absence of TREM2+ and TREM2 cells purified from liver with tumor. Representative histogram (K) and the percentage of OT-I cells at the third generation (L) are shown. The ratio of TREM2+ or TREM2 cells to OT-I cells is 4:1.
Figure 6.
Figure 6.. Human TAMs manifest high metabolic heterogeneity
(A) UMAP visualization of split projections of metabolic clusters from macrophages in tissue of adjacent normal, peripheral tumor, core tumor, and total tumor from cohort of HCC. HCC: hepatocellular carcinoma. (B) Heterogeneity of macrophages in tissue of adjacent normal, peripheral tumor, core tumor, and total tumor from cohort of HCC. Heterogeneity: 1-(Gini index); dashed line: sample with significant diversity. (C) UMAP visualization of split projections of metabolic clusters from macrophages in tissue of adjacent normal and tumor from cohort of CRC (colorectal cancer). (D) Heterogeneity of macrophages in tissue of adjacent normal and tumor from cohort of CRC. Heterogeneity: 1-(Gini index). Dashed line: sample with significant diversity. (E and F) Enrichment of purine metabolic gene signature in each macrophage from cohort of CRC (E) and HCC (F), respectively. (G) Diagram showing the expression of genes in purine metabolic pathways. Red font: genes enriched, black font: genes not enriched. Data from cohort of CRC were used. (H and I) UMAP visualization of the expression level of selected purine metabolic genes in macrophages from cohort of CRC (H) and HCC (I), respectively. (J and K) Pseudo-time analysis of macrophages in each metabolic cluster from cohort of CRC (J) and HCC (K), respectively. Pseudo-time for each macrophage in cohort of CRC was inferred by R package of URD. Pseudo-time for each macrophage in cohort of HCC was extracted directly from the original data (Sharma et al., 2020). (L) Correlation analysis between gene signature of purine metabolism (x axis) with angiogenesis and TREM2 (y axis) on macrophages. Data from cohort of HCC (Sharma et al., 2020) were used. Pearson’s correlation coefficient (R) and correlation test (p values) were used to evaluate the correlation between the purine metabolic signature and angiogenesis signatures (and TREM2). (M and N) Pan-cancer analysis of purine metabolic gene expression in macrophages from different tissues (M), and from patients at different grade malignancy (Cheng et al., 2021) (N) Mann-Whitney test was used to calculate the significance between two groups; only CRC and ESCA have enough patients for stage analysis (at least 2 patients at each stage are needed); *p < 0.05, **p < 0.01, and ***p < 0.001. HCC: hepatocellular carcinoma; CRC: colorectal cancer; UCEC: uterine corpus endometrial carcinoma; THCA: thyroid cancer; ESCA: esophageal carcinoma.
Figure 7.
Figure 7.. Purine metabolic TAMs were associated with clinical outcome
(A) Heatmap showing the expression level of purine metabolic genes in macrophages from patients with melanoma (Sade-Feldman et al., 2018). Macrophages were ordered by the score of purine metabolic gene signature. Macrophages were labeled (the “Response” row) by their origins; green: macrophage from ICB non-responders; blue: macrophage from ICB responders. (B and C) UMAP plots showing the clusters of macrophages from melanoma cohort 1 (Sade-Feldman et al., 2018) (B) and basal cell carcinoma cohort (C). Cells were colored by the score of purine metabolic gene signature, ICB response of patients, and samples the macrophages were isolated from, respectively. (D–F) The expression level of purine metabolic genes in macrophages from ICB responders and non-responders over three cohorts (Jerby-Arnon et al., 2018; Sade-Feldman et al., 2018; Yost et al., 2019). The thick line represents the median value, the bottom and top of the boxes are the 25th and 75th percentiles (interquartile range). Whiskers encompass 1.5 times the interquartile range. Mann-Whitney test was used to calculate the significance between two groups; *p < 0.05, **p < 0.01, and ***p < 0.001. (G) The impact of expression of purine metabolic genes in macrophages on overall survival (OS) in melanoma patients. Upper: the ranked risk score of 22 melanoma patients evaluated by the coefficient of purine metabolic genes. Middle: the OS distribution of the 22 patients ranked according to the risk score (from upper). Bottom: heatmap of the expression pattern of purine metabolic genes in the macrophages from the 22 melanoma patients. (H) The expression level of purine metabolic genes in macrophages from patients with melanoma. Macrophages were grouped by the OS time of corresponding patients. Mann-Whitney test was used to calculate the significance between two groups; *p < 0.05, **p < 0.01, and ***p < 0.001. (I) Kaplan–Meier plots of OS for 22 melanoma patients accept ICB therapy (Sade-Feldman et al., 2018). Patients were stratified into low and high purine metabolism groups with the median of the purine metabolism score in macrophages from corresponding melanoma patients. Cox proportional hazards model was used to test the OS difference between low and high group.

References

    1. Alquicira-Hernandez J, Sathe A, Ji HP, Nguyen Q, and Powell JE (2019). scPred: accurate supervised method for cell-type classification from single-cell RNA-seq data. Genome Biol. 20, 1–17. - PMC - PubMed
    1. Argüello RJ, Combes AJ, Char R, Gigan J-P, Baaziz AI, Bousiquot E, Camosseto V, Samad B, Tsui J, Yan P, et al. (2020). SCENITH: a flow cytometry-based method to functionally profile energy metabolism with single-cell resolution. Cell Metab. 32, 1063–1075.e7. - PMC - PubMed
    1. Azizi E, Carr AJ, Plitas G, Cornish AE, Konopacki C, Prabhakaran S, Nainys J, Wu K, Kiseliovas V, Setty M, et al. (2018). Single-cell map of diverse immune phenotypes in the breast tumor microenvironment. Cell 174, 1293–1308.e6. - PMC - PubMed
    1. Ben-Moshe S, and Itzkovitz S (2019). Spatial heterogeneity in the mammalian liver. Nat. Rev. Gastroenterol. Hepatol 16, 395–410. - PubMed
    1. Ben-Moshe S, Shapira Y, Moor AE, Manco R, Veg T, Halpern KB, and Itzkovitz S (2019). Spatial sorting enables comprehensive characterization of liver zonation. Nat. Metab 1, 899–911. - PMC - PubMed

Publication types