. 2022 Apr 5;39(1):110598.
doi: 10.1016/j.celrep.2022.110598.

ALS-associated KIF5A mutations abolish autoinhibition resulting in a toxic gain of function

Affiliations

ALS-associated KIF5A mutations abolish autoinhibition resulting in a toxic gain of function

Desiree M Baron et al. Cell Rep. .

Abstract

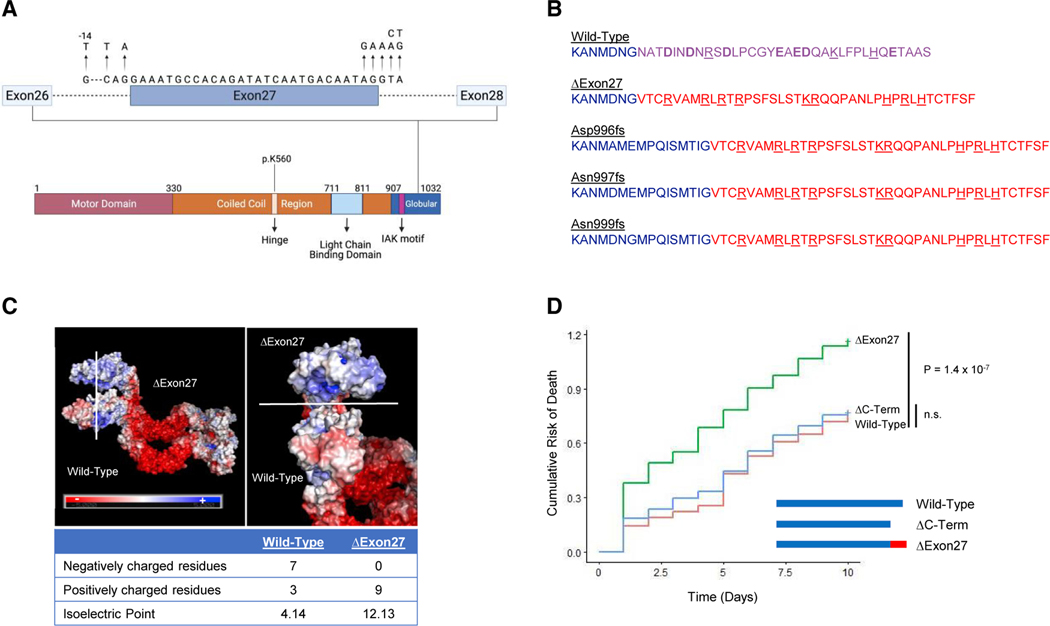
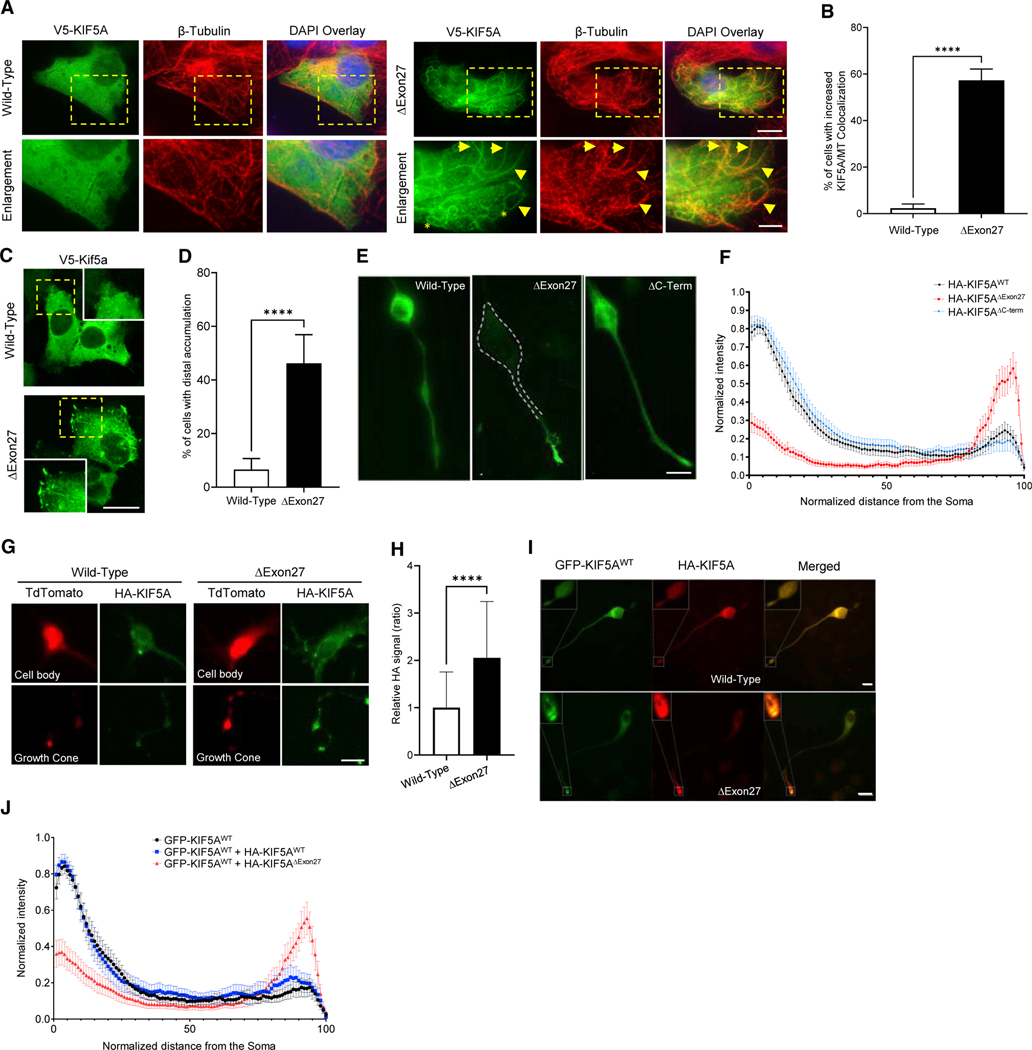
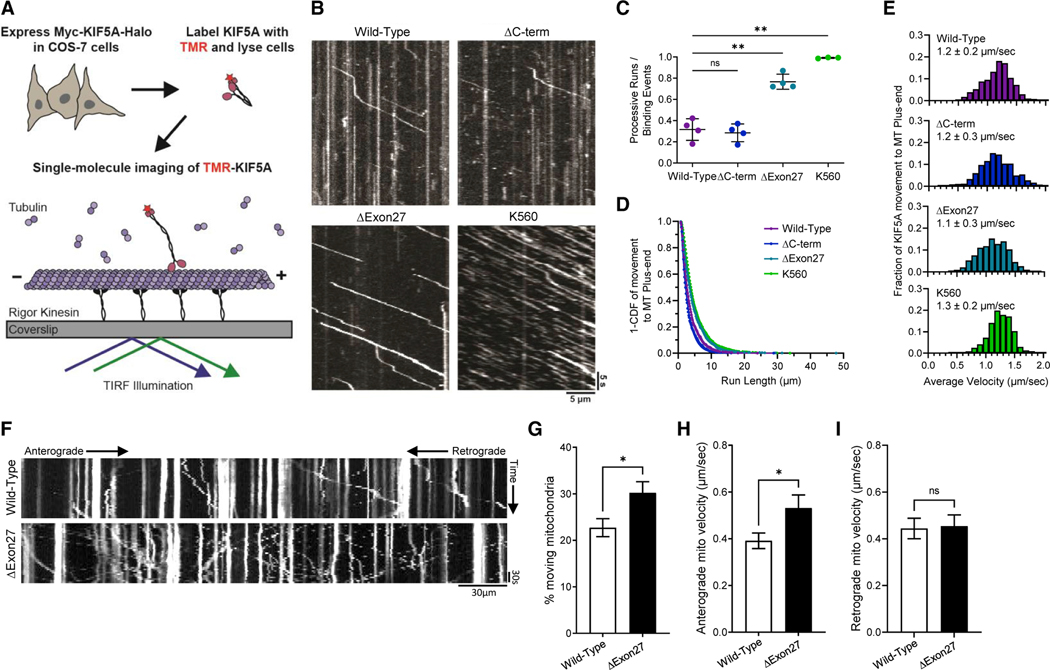
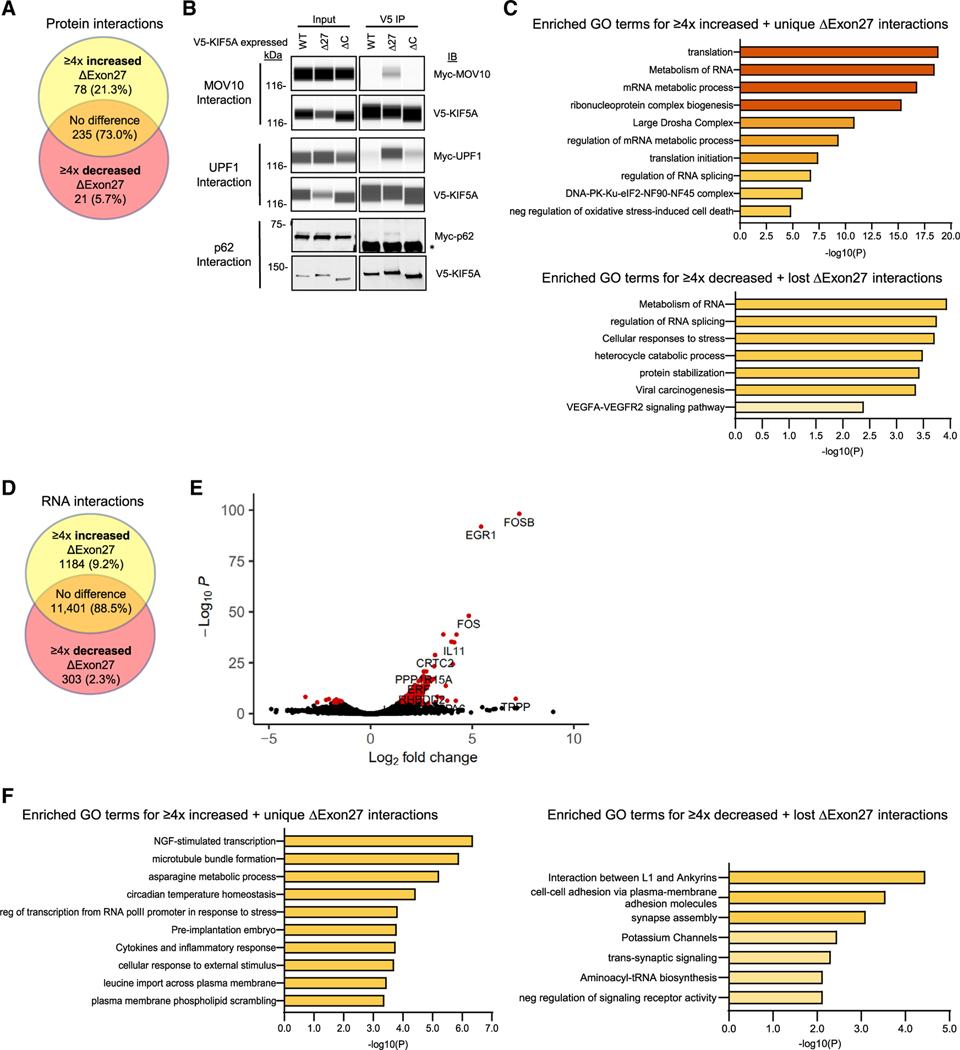
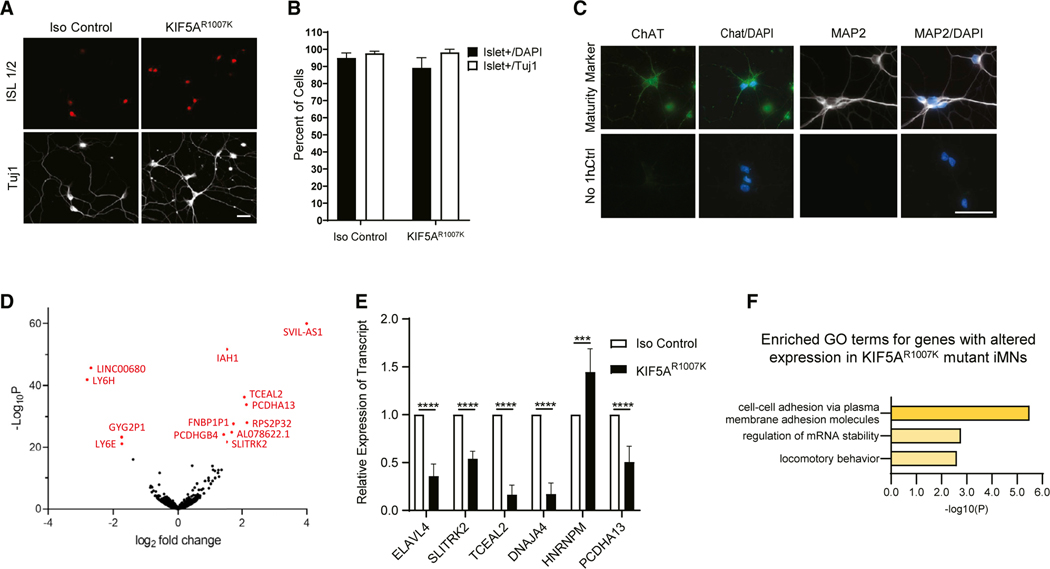
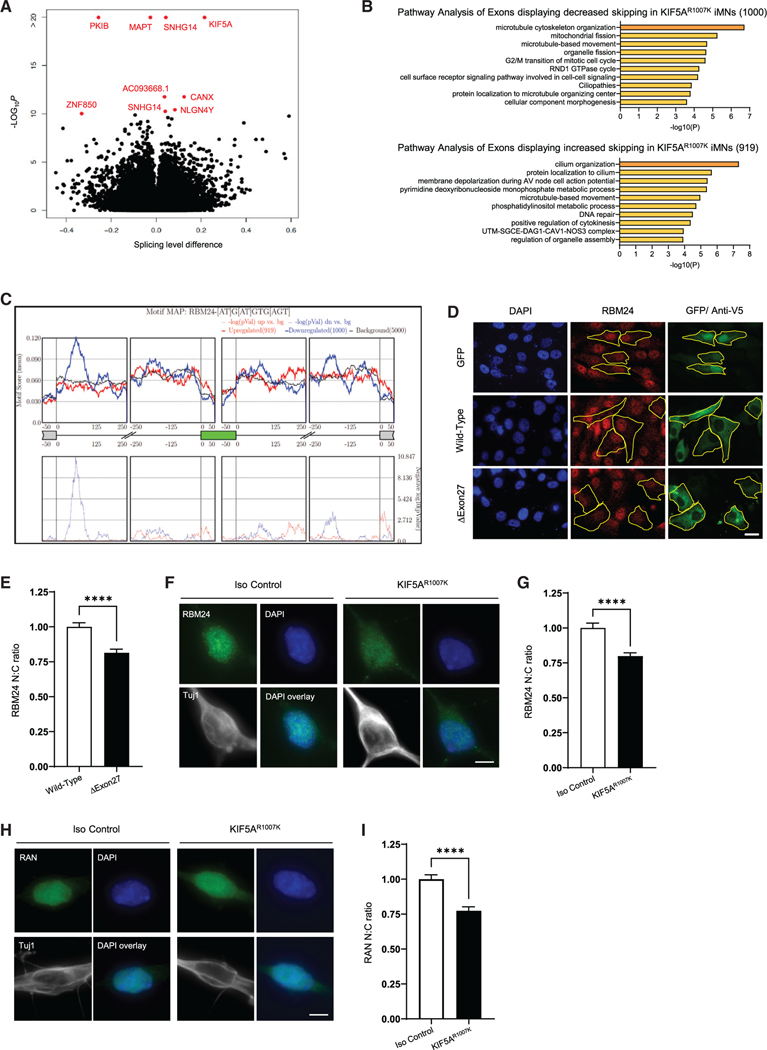
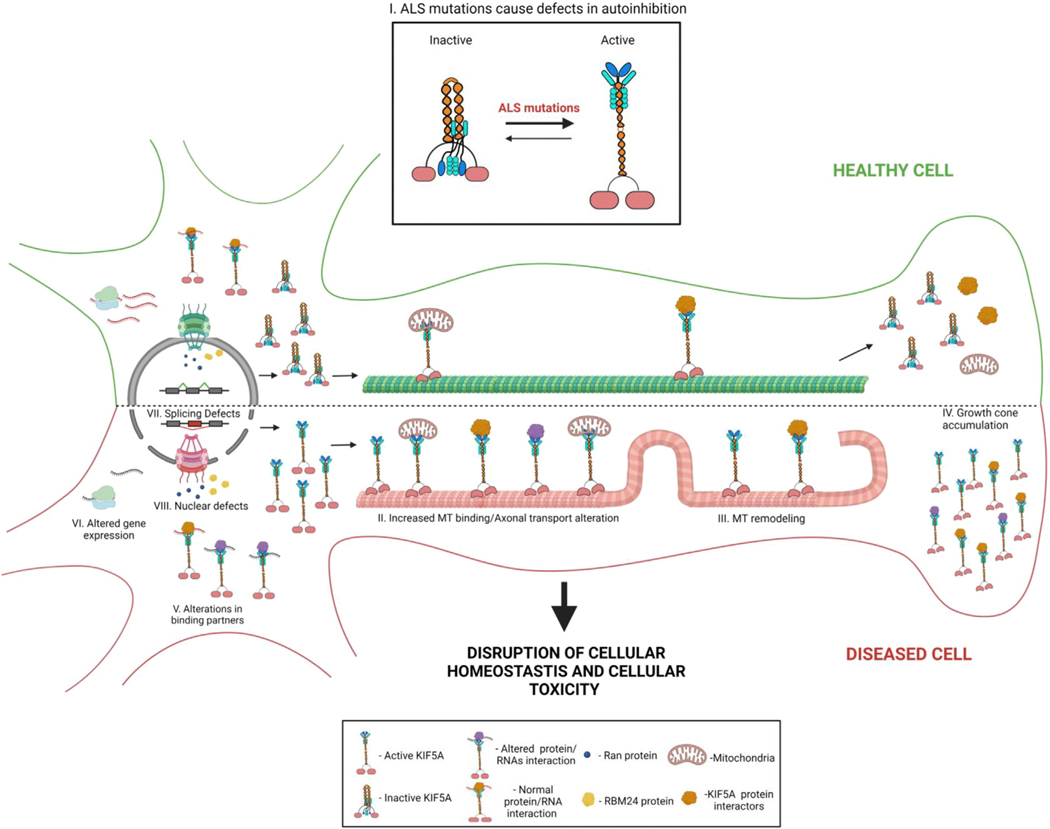
Understanding the pathogenic mechanisms of disease mutations is critical to advancing treatments. ALS-associated mutations in the gene encoding the microtubule motor KIF5A result in skipping of exon 27 (KIF5AΔExon27) and the encoding of a protein with a novel 39 amino acid residue C-terminal sequence. Here, we report that expression of ALS-linked mutant KIF5A results in dysregulated motor activity, cellular mislocalization, altered axonal transport, and decreased neuronal survival. Single-molecule analysis revealed that the altered C terminus of mutant KIF5A results in a constitutively active state. Furthermore, mutant KIF5A possesses altered protein and RNA interactions and its expression results in altered gene expression/splicing. Taken together, our data support the hypothesis that causative ALS mutations result in a toxic gain of function in the intracellular motor KIF5A that disrupts intracellular trafficking and neuronal homeostasis.

Keywords: ALS; CP: Neuroscience; KIF5A; amyotrophic lateral sclerosis; autoinhibition; axonal transport; kinesin; neurodegenerative disease; neuronal survival.


Conflict of interest statement

Declaration of interests J.E.L. is a member of the scientific advisory board for Cerevel Therapeutics, a consultant for ACI Clinical LLC sponsored by Biogen, Inc. and Ionis Pharmaceuticals, Inc. J.E.L. is also a consultant for Perkins Coie LLP and may provide expert testimony.

Figures

Figure 1.
Figure 1.. ALS-associated KIF5A mutations are clustered to exon 27 resulting in a common toxic C terminus mutation
(A) KIF5A domain structure. The kinesin light chain domain, the hinge domain, and the regulatory IAK domain are indicated. Arrows in the expanded intron/exon diagram indicate the ALS-related mutations. A mutation denoted with −14, is positioned 14 bp upstream of exon 27, but still creates the same mutant C terminus. Image created with Biorender.com. (B) ALS-associated mutations in KIF5A all lead to a common C-terminal tail as indicated in red. Positively and negatively charged amino acids are underlined and bolded, respectively. (C) Electrostatic surface charge distribution images show that the novel mutant C-terminal tail reverses the protein charge density making the mutant tail highly positively charged. (D) Expression of the KIF5AΔExon27 mutant, but not KIF5AΔC-term, in primary mouse cortical neurons leads to increased risk of death compared with KIF5AWT-expressing cells. A representative graph of three biological experiments is shown; n = 597 cells for KIF5AWT, n = 212 cells for KIF5AΔExon27, and n = 475 cells for KIF5AΔC-term in the experiment shown. p = 1.4 3 10−7 by Cox hazard analysis.
Figure 2.
Figure 2.. Mutant KIF5A associates more readily with microtubules, displays microtubule plus-end accumulation, and has a dominant-negative effect on wild-type KIF5A
(A) SKNAS cells expressing V5-tagged KIF5AΔExon27 show increased microtubule (MT) co-localization compared with KIF5AWT as demonstrated by V5-KIF5A highlighting the MT tracks. Examples of KIF5A (V5; green) and β-tubulin (red) co-localization are indicated by arrowheads. Many cells have KIF5AΔExon27-associated MTs with a non-radial pattern (asterisks). Scale bars, 10 mm (wide view), 5 mm (enlargement). (B) Quantification of the experiment in (A). n = 5 biological replicates are shown with p < 0.0001. (C, E, and G). Expression of KIF5AΔExon27 results in distal/growth cone accumulation of tagged-KIF5A in transfected SKNAS (C), differentiated N2A (E), and PMN cells (G). Scale bars, 20 mm (C), 25 μm (E), and 10 μm (G). (D) Quantification of the percentage of transfected SKNAS cells in (C) with distal accumulation. n = 5 biological replicates are shown with p < 0.0001. (F) HA intensity analysis of the experiment in (E). n = 3 biological replicates are shown with n ≥ 60 cells per sample. (H) Quantification of the HA signal intensity from the growth cone compared with that of the cell body for the PMNs in (G). n = 3 biological replicates are shown with p < 0.0001. (I) Representative images of differentiated N2A cells transfected with GFP-KIF5AWT and either HA-tagged KIF5AWT or KIF5AΔExon27. Scale bar, 25 μm. Confirmation of this protein binding is shown in Figure S1B. (J) Quantification of the GFP intensity along the length of the cells in (I) when different forms of HA-tagged KIF5A are present. n = 3 biological replicates with n≥51 cells analyzed per sample. Data in (B), (D), and (H) are represented as mean ± SD. Data in (F) and (J) are represented as mean ± 95% CI.
Figure 3.
Figure 3.. Mutant KIF5A displays qualities of a hyperactive kinesin in axonal transport
(A) Schematic representation of the single-molecule labeling method used to track KIF5A axonal movement. (B) Representative kymograms showing the effect of KIF5AΔC−Term, KIF5AΔExon27, and KIF5AK560 mutations on motility compared with KIF5AWT. Scale bars, 5 μm (distance) and 5 s (time). (C) Quantification of the ratio of processive runs to total binding events for KIF5A. n = 3–4 biological replicates with p = 0.0022 for K560 versus wild-type, p = 0.0021 for ΔExon27 versus wild-type and non-significant for ΔC-term versus wild-type as determined by the Brown-Forsythe ANOVA with Dunnett’s multiple comparison test. (D and E) Inverse cumulative distribution functions (CDF) of run length and histogram distributions of velocity for KIF5A transport to the MT plus end (n = 652 events for wild-type, 667 events for ΔC-term, 1,074 events for ΔExon27, and 660 events for K560 samples). The curves in CDF graph (D) represent single exponential decay fits. The values in (C and E) are mean ± SD. (F) Representative kymograms showing the effect of the KIF5AΔExon27 on mitochondrial transport. Scale bar, 30 mm (distance) and 30 s (time). (G–I) Quantification of mitochondrial transport characteristics. The total number of moving mitochondria (G) are reported as well as anterograde mitochondrial velocity (H), and retrograde velocity (I). For each experiment n = 3 biological replicates p = 0.017 in (G), 0.032 in (H), and is non-significant (ns) in (I). The data represented in (G–I) are mean ± SEM.
Figure 4.
Figure 4.. KIF5A binding partners are altered in cells expressing mutant KIF5A
(A) Mass spectrometry analysis of V5-tagged KIF5AWT and KIF5AΔExon27 bound proteins in SKNAS cells. Venn diagram indicates the number of protein binding partners altered in KIF5AΔExon27 mutant immunoprecipitations. Yellow region: proteins that are unique to, or have ≥4× increase in the amount bound to, KIF5AΔExon27. Red region: proteins that are absent from, or have ≥4× decrease in the amount bound to, KIF5AΔExon27. Orange region: proteins that show no binding preference to either form of KIF5A. (B) Validation of several Myc-tagged mass spectrometry hits from (A) by western blotting. Capillary western blots of MOV10 (upper panel) and UPF-1 (middle panel) show the strong interaction of V5-KIF5AΔExon27, but not KIF5AWT. Exposure settings for the capillary western blots were adjusted individually for each band of interest as needed for each sample set (samples of the same type; ex:. all of the input samples). A traditional western blot of p62 (lower panel) also shows a unique interaction with V5-KIF5AΔExon27. Asterisk: the antibody heavy chain pulled down in the IP. The blot for MOV10, UPF1, and p62 is representative of n = 4, n = 1, and n = 4 biological replicates, respectively. (C) Pathway analysis on the proteins enriched (upper) and diminished (lower) in the KIF5AΔExon27 mutant mass spectrometry sample (D) Analysis of RNAs associated with immunoprecipitated V5-tagged KIF5AWT and KIF5AΔExon27 mutant containing complexes. The Venn diagram indicates how many RNAs had altered interactions with KIF5AΔExon27 mutant samples as described in (A). (E) A volcano plot of RNA immunoprecipitation results sowing significantly altered RNA interactors in red. Data are based on n = 2 biological replicates. (F) Pathway analysis on the RNAs enriched (left) and diminished (right) in the KIF5AΔExon27 mutant sample. See expanded pathway analyses in Figure S2.
Figure 5.
Figure 5.. Isogenic iPSCs expressing mutant KIF5A display altered gene expression
(A) Patient-derived Arg1007Lys mutant KIF5A iPSC line and isogenic control differentiated into motor neurons (iMNs) display the MN specific marker, Islet1/2 (red), and Tuj1 (white) at DIV15. Scale bar, 50 μm. (B) The differentiation efficiency of KIF5A iMNs at DIV15. Data are representative of n = 3 biological replicates where n = 531 control cells and n = 624 KIF5AR1007K cells were counted over all experiments. (C) Staining for maturity markers in DIV15 control iMNs differentiated by this method. At least 100 cells were observed in each of n = 2 biological replicates. Scale bar, 50 μm. (D) A volcano plot of RNA-seq analysis of the KIF5AR1007K line and isogenic control showing several genes that are differentially expressed in the mutant. n = 4 biological replicates. (E) Validation of several of the differentially expressed genes in (D) via qPCR. n = 3 biological replicates, each experiment run in triplicate with p < 0.0001 by two-way ANOVA. (F) Pathway analysis of differentially expressed genes in (D). Enriched GO terms recapitulate themes of mRNA processing from previous experiments. Data in (B) and (E) are represented as mean ± SD.
Figure 6.
Figure 6.. Nuclear cytoplasmic transport is disrupted in mutant KIF5A-expressing cells
(A) Volcano plot of splicing analysis results from RNA-seq experiments showing significantly altered genes in KIF5AΔExon27 iMNs. Red dots indicate values with p < 10−10. Data are representative of n = 4 biological replicates. (B) Pathway analysis of genes where decreased (top) or increased (bottom) exon skipping is observed. The number of affected exons in each group are listed in parentheses. See expanded pathway analyses in Figure S4. (C) Motif mapping identifies enrichment of RBM24 binding sites in alternatively spliced genes (p < 10−10). (D) Micrographs of SKNAS cells transfected with either GFP alone or V5-tagged KIF5AWT or KIF5AΔExon27 (green) and stained for RBM24 (red) show that RBM24 localization is altered in KIF5AΔExon27-expressing cells. Scale bar, 20 μm. Cells outlined with yellow dashed lines show examples of this phenomena. (E) Quantification of the RBM24 staining intensity in the nucleus versus the cytoplasm (N:C) in SKNAS transfected cells represented in (D). Graph represents data from 171 KIF5AWT and 176 KIF5AΔExon27 cells collected over n = 4 biological replicates with p < 0.0001. (F) Max projected micrographs of KIF5AR1007K and isogenic control iMNs stained with RBM24 (green), DAPI (blue), and Tuj1 (white) confirm the N:C ratio dysregulation seen in SKNAS cells. Scale bar, 5 μm. (G) Quantification of RBM24 localization in cells represented in (F). Graph represents data from 116 isogenic control and 124 KIF5AR1007K iMNs collected over n = 4 biological replicates with p < 0.0001. (H) Max projected micrographs of KIF5AR1007K and isogenic control iMNs stained with RAN (green), DAPI (blue), and Tuj1 (white) shows expression of KIF5AR1007K in differentiated iMNs alters RAN localization in these cells Scale bar, 5 μm. (I) Quantification of RAN localization in cells represented in (H). Graph represents data from 89 isogenic controls and 92 KIF5AR1007K iMNs collected over n = 3 biological replicates with p < 0.0001. Data in (E), (G), and (I) are represented as mean ± SEM.
Figure 7.
Figure 7.. Schematic of how expression of ALS-related mutant KIF5A affects cellular homeostasis leading to cellular toxicity
ALS-related KIF5A mutations lead to defective autoinhibition (I). As a result, KIF5A has increased binding to MTs and altered axonal transport (II), MT remodeling (III), and growth cone accumulation (IV). The protein and RNA binding partners of mutant KIF5A are also changed (V). On a global scale, differences in gene expression (VI) occur as well as NCT disruptions (VIII) which may affect gene splicing (VII). Ultimately the disruption of cellular homeostasis leads to cellular toxicity and death. This image was created with BioRender.com.

References

    1. Aiken J, and Holzbaur ELF (2021). Cytoskeletal regulation guides neuronal trafficking to effectively supply the synapse. Curr. Biol. 31, R633–R650. - PMC - PubMed
    1. Akiyama T, Suzuki N, Ishikawa M, Fujimori K, Sone T, Kawada J, Funayama R, Fujishima F, Mitsuzawa S, Ikeda K, et al. (2019). Aberrant axon branching via Fos-B dysregulation in FUS-ALS motor neurons. EBioMedicine 45, 362–378. - PMC - PubMed
    1. Anders S, Pyl PT, and Huber W. (2015). HTSeq — a Python framework to work with high-throughput sequencing data. Bioinformatics 31, 166–169. - PMC - PubMed
    1. Antrobus R, and Borner GHH (2011). Improved elution conditions for native co-immunoprecipitation. PLoS One 6, e18218. - PMC - PubMed
    1. Arrasate M, and Finkbeiner S. (2005). Automated microscope system for determining factors that predict neuronal fate. Proc. Natl. Acad. Sci. U S A 102, 3840–3845. - PMC - PubMed