. 2022 Jun;606(7914):576-584.
doi: 10.1038/s41586-022-04702-4. Epub 2022 Apr 6.

FcγR-mediated SARS-CoV-2 infection of monocytes activates inflammation

Affiliations

FcγR-mediated SARS-CoV-2 infection of monocytes activates inflammation

Caroline Junqueira et al. Nature. 2022 Jun.

Abstract

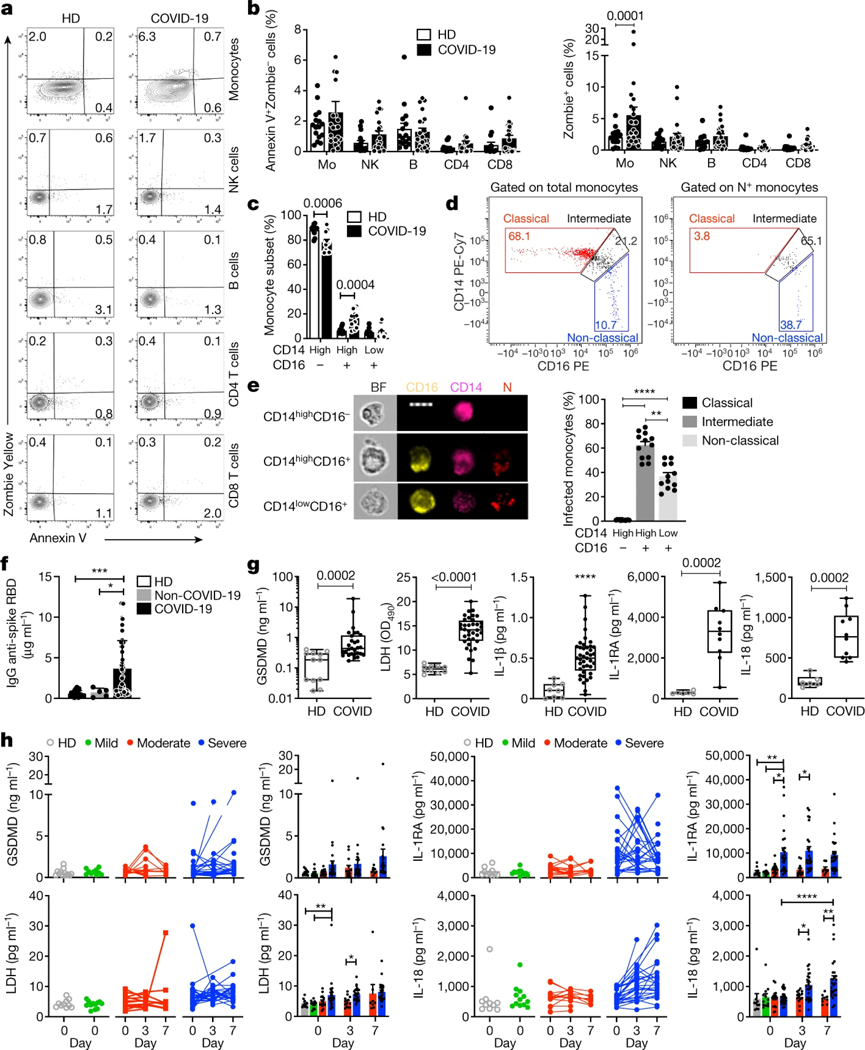
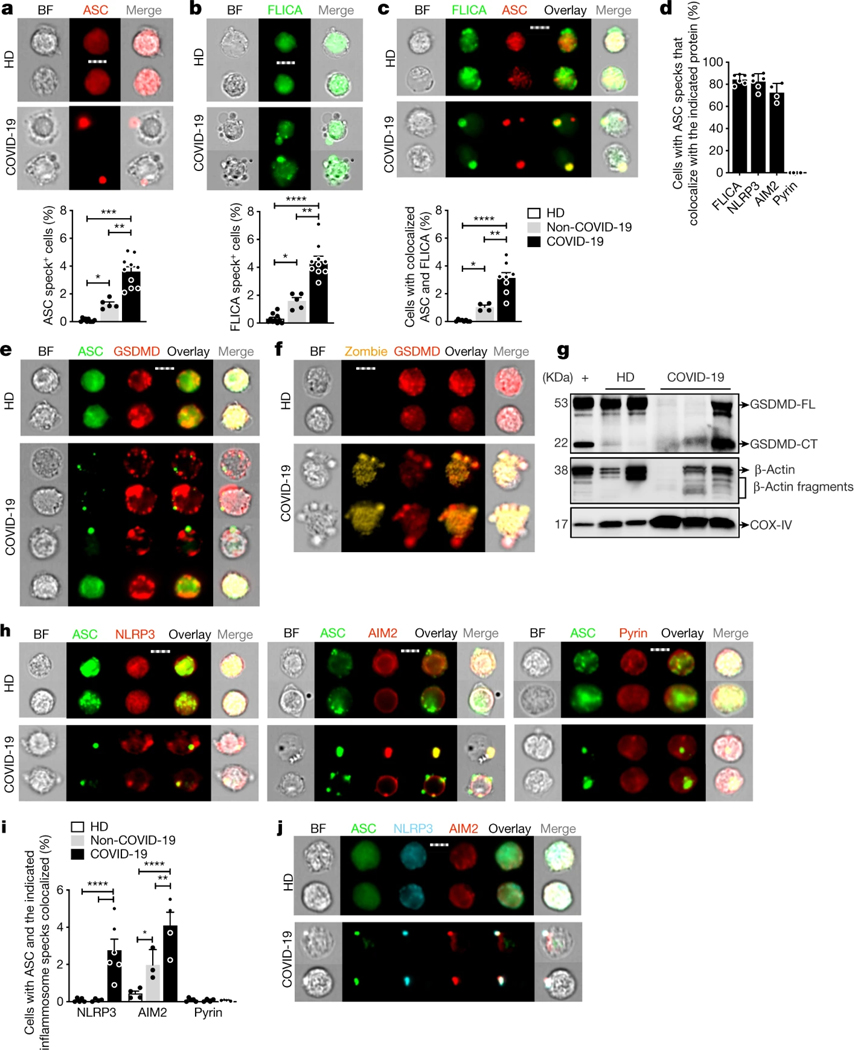
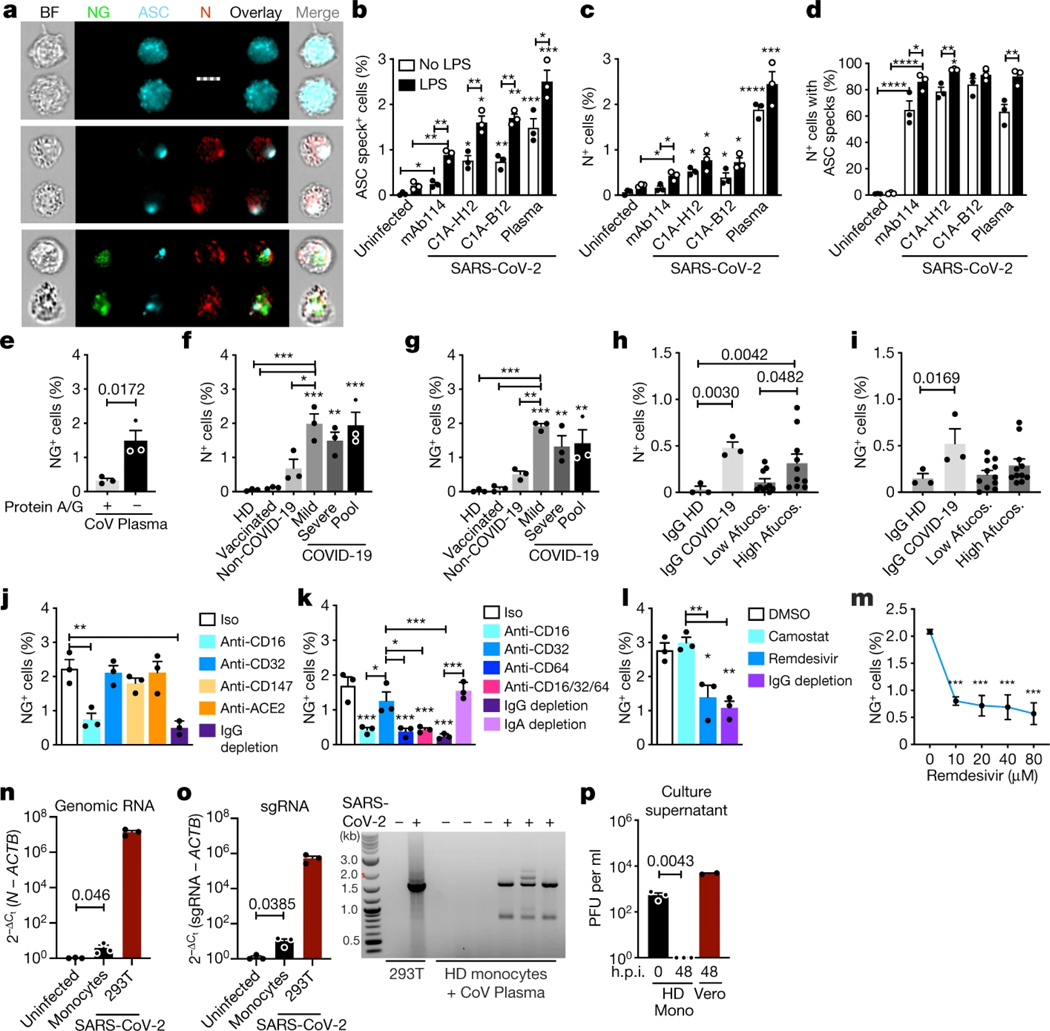
SARS-CoV-2 can cause acute respiratory distress and death in some patients1. Although severe COVID-19 is linked to substantial inflammation, how SARS-CoV-2 triggers inflammation is not clear2. Monocytes and macrophages are sentinel cells that sense invasive infection to form inflammasomes that activate caspase-1 and gasdermin D, leading to inflammatory death (pyroptosis) and the release of potent inflammatory mediators3. Here we show that about 6% of blood monocytes of patients with COVID-19 are infected with SARS-CoV-2. Monocyte infection depends on the uptake of antibody-opsonized virus by Fcγ receptors. The plasma of vaccine recipients does not promote antibody-dependent monocyte infection. SARS-CoV-2 begins to replicate in monocytes, but infection is aborted, and infectious virus is not detected in the supernatants of cultures of infected monocytes. Instead, infected cells undergo pyroptosis mediated by activation of NLRP3 and AIM2 inflammasomes, caspase-1 and gasdermin D. Moreover, tissue-resident macrophages, but not infected epithelial and endothelial cells, from lung autopsies from patients with COVID-19 have activated inflammasomes. Taken together, these findings suggest that antibody-mediated SARS-CoV-2 uptake by monocytes and macrophages triggers inflammatory cell death that aborts the production of infectious virus but causes systemic inflammation that contributes to COVID-19 pathogenesis.


Figures

Extended Data Fig. 1 |
Extended Data Fig. 1 |. Identification of lymphocyte and monocyte subsets in healthy donors and COVID-19 patients.
Flow cytometry gating strategy for identifying lymphocytes and monocytes in Fig. 1a, b (a) and for identifying monocyte subpopulations in Fig. 1c (b). Monocyte subpopulations: CL - classical CD14hiCD16; ITM - intermediate CD14hiCD16+; NCL - non-classical CD14loCD16+.
Extended Data Fig. 2 |
Extended Data Fig. 2 |. Inflammasome imaging and GSDMD cleavage analysis.
a, Gating strategy for imaging flow cytometry analysis of isolated monocytes. b, Representative imaging flow cytometry images of GSDMD and ASC staining in COVID-19 patient monocytes that lacked ASC specks. c, d, Representative imaging flow cytometry images of HEK293T cells (negative control) and THP-1 cells untreated or treated with LPS+nigericin or transfected with poly(dA:dT), then stained with anti-NLRP3 (c) and anti-AIM2 (d). e, Single staining controls for antibody staining. Representative images of monocytes from COVID-19 patients shown were stained with 1° ASC - 2° AF488; 1° NLRP3 – 2°AF568; 1° GSDMD, Pyrin, AIM2, J2, N - 2° AF647; or FAM FLICA Caspase-1 fluorescence, and Zombie Yellow dye. FLICA+ and Zombie+ cells in cells undergoing pyroptosis; GSDMD, Pyrin, AIM2 and NLRP3 in non-pyroptotic cells (diffuse staining); J2+ and N+ in infected monocytes. Scale bar, 7 μm (b–e). f, Representative confocal image z-stacks and plane projections of monocytes of HD and COVID-19 patients, stained for the same markers as in Figure 2. Scale bars, 5 μm. g, Full scan images for blots shown in Fig. 2g.
Extended Data Fig. 3 |
Extended Data Fig. 3 |. ACE2 and CD147 expression on circulating monocytes.
Purified blood monocytes from HD (n = 3), COVID-19 patients (n = 4) and A549-ACE2 (n = 3) were analysed by flow cytometry (a, c) and RT–qPCR (b, d) for expression of ACE2 (a, b) or CD147 (BSG) (c, d). HD monocytes were treated or not with LPS before analysis. A549-ACE2 cells were used as positive control. Mean ± S.E.M. is shown. *p<0.05, ***p<0.001, ****p<0.0001 relative to isotype (Iso) control antibody-stained, LPS-activated HD monocytes (a,c) by one-way ANOVA with Tukey’s multiple comparisons test. Data are representative of 2 independent experiments.
Extended Data Fig. 4 |
Extended Data Fig. 4 |. Effect of anti-spike monoclonal antibodies or pooled COVID-19 plasma on in vitro infection of healthy donor purified monocytes with icSARS-CoV-2-mNG.
a–e, HD monocytes (n = 3) were primed with LPS, infected with icSARS-CoV-2-mNG (MOI, 1), then stained 48 h later for nucleocapsid (N) or dsRNA (J2) and ASC and analysed by imaging flow cytometry. Before infection, virus was preincubated with indicated monoclonal antibodies (IgG1 isotype control mAb114 (Iso)), non-neutralizing anti-spike (C1A-H12 (H12)) or neutralizing anti-RBD (C1A-B12 (B12)) or with pooled HD or COVID-19 patient plasma that had been heat-inactivated (HI) or not. U, uninfected. Quantification of HD monocyte staining for N (a), J2 (b), NG (c, e) or ASC specks (d). (e) Shows the percentage of N+ cells that were also NG fluorescent. f, g, A5490-ACE2 (n = 3) (f) or LPS-primed HD monocytes (n = 3) (g) were infected at the indicated MOI with icSARS-CoV-2-mNG (NG), a molecular clone of the Washington (WA) strain, or with clinical WA and Delta strains. Infection was measured by N staining and flow cytometry. Mean ± S.E.M. is shown. *p<0.05, **p<0.01, ***p<0.001, ****p<0.0001 by one-way ANOVA with Tukey’s multiple comparisons test, relative to Iso or as indicated (a–g). Data are representative of 2 independent experiments.
Extended Data Fig. 5 |
Extended Data Fig. 5 |. In vitro infection of healthy donor monocytes and neutrophils.
a–c, LPS-primed HD monocytes (n = 3) (a, b) or purified HD neutrophils (n = 3) (c) were infected with icSARS-CoV-2-mNG (MOI, 1), then stained 48 h later for nucleocapsid (N) or analysed for NG fluorescence (c, right). Before infection, virus was preincubated with COVID-19 plasma, depleted or not of IgG as indicated, and infection was carried out in the presence of indicated blocking or isotype (Iso) control antibodies (a–c). The monocyte and neutrophil infections in (b) and (c) were performed with cells isolated from the same HDs. d, Freshly isolated neutrophils, enriched by negative selection, from HD (n = 3) and COVID-19 patients of mixed disease severity (n = 4) were stained for N and analysed by flow cytometry to assess in vivo infection. e, Infection of LPS-primed HD monocytes (n = 3) with icSARS-CoV-2-mNG in the presence of pooled COVID-19 patient plasma, depleted or not of IgG as indicated, and antiviral drugs, Camostat and Remdesivir. f, Infection of A549-ACE2 (n = 3) with icSARS-CoV-2-mNG to verify the inhibitory activity of 10 μM Remdesivir. Infection was measured by N staining and flow cytometry. g, Infection of A549-ACE2 (n = 3) and HD monocytes (n = 3) with icSARS-CoV-2-mNG in the presence of anti-ACE2 blocking antibody at different concentrations. Infection was measured by NG fluorescence. Mean ± S.E.M. is shown. *p<0.05, **p<0.01, ***p<0.001, by one-way ANOVA with Tukey’s multiple comparisons test (a–c, g), nonparametric unpaired t-test (d, f) and two-tailed nonparametric unpaired multiple t-test (e). Data are representative of 2 replicate experiments.
Fig. 1 |
Fig. 1 |. Monocytes of patients with COVID-19 undergo pyroptosis.
a, b, Representative flow cytometry plots (a) and the percentage of lymphocyte subset and monocyte (Mo) staining for annexin V only or Zombie dye (b) in fresh blood from HDs (n = 16) and patients with COVID-19 (n = 22). NK, natural killer cells. c, The frequency of monocyte subsets (classical, CD14highCD16; intermediate, CD14highCD16+; and non-classical, CD14lowCD16+) in freshly isolated blood from HDs (n = 11) and patients with COVID-19 (n = 12). d, e, Imaging flow cytometry analysis of SARS-CoV-2 infection in monocyte subsets of patients with COVID-19 (n = 12). Monocytes from patients with COVID-19 were enriched by negative selection and stained for CD14, CD16 and SARS-CoV-2 N. d, Representative dot plots of monocyte subsets gated on all monocytes (left) or N+ monocytes. e, Representative images of imaging flow cytometry (left) and quantification of infection (N+) in the monocyte subsets (right). BF, bright field. Scale bar, 7 μm. f, The concentration of anti-spike RBD IgG in the plasma of HDs (n = 20), non-COVID-19 patients (with COVID-19-like symptoms but PCR negative for SARS-CoV-2; n = 5) and patients with COVID-19 (n = 68) at presentation. g, The concentration of pyroptosis biomarkers and cytokines in HD and COVID-19 plasma. GSDMD (n = 12 (HD), n = 29 (COVID-19)); LDH activity (n = 10 (HD), n = 36 (COVID-19)); IL-1β (n = 8 (HD), n = 41 (COVID-19)); IL-1RA and IL-18 (n = 6 (HD), n = 10 (COVID-19)). A description of the samples is provided in Supplementary Table 1. OD490, optical density at 490 nm. h, Plasma pyroptosis biomarkers at presentation (day 0) and during hospitalization (day 3 and 7) in patients with COVID-19 with mild (n = 12), moderate (n = 16) and severe (n = 32) COVID-19 Acuity scores (the samples are described in Supplementary Table 2). Left, individual patient data. Right, grouped data. For b, c, e, f, h, data are mean ± s.e.m. The plots in g show the median (centre line), the interquartile range between the 25th and 75th percentiles (box), and the 25th percentile value − 1.5× the interquartile range (lower whisker) and the 75th percentile value + 1.5× the interquartile range (upper whisker) . Statistical analysis was performed using two-tailed nonparametric unpaired t-tests (b, c), one-way analysis of variance (ANOVA) with Tukey multiple-comparisons test (e, f), two-tailed nonparametric unpaired t-tests (g) and two-way ANOVA with Tukey multiple-comparisons test (h); *P < 0.05, **P < 0.01, ***P < 0.001, ****P < 0.0001.
Fig. 2 |
Fig. 2 |. Monocytes of patients with COVID-19 have activated inflammasomes, caspase-1 and GSDMD.
Monocytes from HDs, non-COVID-19 patients or patients with COVID-19 at the time of presentation were analysed by imaging flow cytometry for ASC, GSDMD, caspase-1 activation (FLICA) and/or Zombie dye uptake. ac, The percentage of monocytes with activated ASC (a) or caspase-1 (b) (n = 8 (HD), n = 5 (non-COVID-19), n = 10 (COVID-19)) or colocalized ASC/caspase-1 specks (c) (n = 8 (HD), n = 4 (non-COVID-19), n = 8 (COVID-19)) (c). Representative images (top) and quantification of all samples (bottom) are shown. d, The percentage of ASC-speck-containing monocytes with colocalized activated caspase-1, NLRP3, AIM2 or pyrin specks. n = 6. e, f, Representative images of ASC (e) or Zombie dye (f) and GSDMD co-stained monocytes. n = 4 independent experiments. g, Lysates of purified monocytes of HDs and patients with COVID-19, and of LPS- and nigericin-treated monocytes of HDs (+) probed with a monoclonal antibody that recognizes full length GSDMD (GSDMD-FL) and the C-terminal of GSDMD (GSDMD-CT) (top), β-actin (middle) and COX-IV (bottom). Representative of n = 4 independent experiments. h, i, Representative images of ASC co-staining with NLRP3 (left; n = 5 (HD), n = 4 (non-COVID-19), n = 6 (COVID-19)), AIM2 (middle; n = 4 (HD), n = 3 (non-COVID-19), n = 4 (COVID-19)) and pyrin (right; n = 4 (HD), n = 4 (non-COVID-19), n = 5 (COVID-19)) (h), and quantification of monocytes showing ASC specks colocalized with the indicated inflammasomes (i). j, Representative images of co-staining of ASC, NLRP3 and AIM2. n = 3 independent experiments. For ac, e, f, h, j, scale bars, 7 μm. For ad, i, data are mean ± s.e.m. Statistical analysis was performed using one-way ANOVA with Tukey multiple-comparisons test (ad) and two-way ANOVA with Tukey multiple-comparisons test (i); *P < 0.05, **P < 0.01, ***P < 0.001, ****P < 0.0001.
Fig. 3 |
Fig. 3 |. SARS-CoV-2-infected monocytes and lung macrophages have activated inflammasomes.
ah, Monocytes of HDs and patients with COVID-19 were stained for SARS-CoV-2 N (n = 5) (ad) or dsRNA (anti-J2 antibodies) (n = 4) (eh) and ASC. a, e, Representative imaging flow cytometry images. b, f, Quantification of infected cells on the basis of N (b) or J2 (f) staining. c, g, Uninfected or infected cells that showed ASC specks. d, h, The percentage of cells with or without ASC specks that were infected. For a, e, scale bars, 7 μm. ik, Lung autopsies from five patients with COVID-19 (the samples are described in Supplementary Table 3) and three control individuals who have experienced trauma were stained for N (green), ASC (red) and CD14 (magenta), and with DAPI (blue). i, Digital scanner images of a representative patient who experienced trauma (left) and a patient with COVID-19 (middle), showing a magnified image of representative infected CD14+ (top) and CD14 (bottom) cells from the lungs of the patient with COVID-19 (right). Scale bars, 50 μm (left), 100 μm (middle). j, k, Representative confocal microscopy COVID-19 lung images of infected CD14+ (j) and CD14 (k) cells (left). Right, quantification of CD14+ (j) and CD14 (k) cells that are N positive and/or have ASC specks in the lungs of patients with COVID-19 (n = 5) and control individuals (n = 3). In k, representative images of CD14N+ cells (left) were co-stained for ASC and E-cadherin, an epithelial marker (top), or CD31, an endothelial marker (bottom). For j, k, scale bars, 7 μm. For bd, fh, j, k, data are mean ± s.e.m. Statistical analysis was performed using two-tailed nonparametric unpaired t-tests (Mann–Whitney U-tests) (bd, fh) and two-way ANOVA with Tukey multiple-comparisons test (j, k); *P < 0.05, **P < 0.01, ***P < 0.001, ****P < 0.0001.
Fig. 4 |
Fig. 4 |. HD monocytes take up antibody-opsonized SARS-CoV-2 through an FcγR but viral replication is aborted.
a–d, HD monocytes (n = 3) were primed (black bars) or not (white bars) with LPS, infected with icSARS-CoV-2-mNG and stained 48 h later for N and ASC. Virus was preincubated with IgG1 control mAb114, non-neutralizing anti-spike (C1A-H12) or neutralizing anti-RBD (C1A-B12), or with pooled plasma from patients with COVID-19, and these were retained throughout culture. a, Representative imaging flow cytometry images of uninfected (top), N+NG (middle) or N+NG+ (bottom) monocytes. Scale bar, 7 μm. b–d, Quantification of the percentage of ASC speck+ (b) or N+ (c) monocytes, and of N+ monocytes with ASC specks (d). n = 3. e–i, LPS-activated HD monocytes were infected with icSARS-CoV-2-mNG preincubated with pooled COVID-19 plasma, depleted or not depleted of immunoglobulins using protein A/G beads (n = 3; e), or preincubated with pooled plasma from HDs, recipients of a COVID-19 mRNA vaccine, non-COVID-19 patients or patients with COVID-19 with mild and/or severe disease (n = 3; f, g); or with purified IgG from HDs (n = 3), pooled from patients with COVID-19 of mixed severity (n = 3) or patients with COVID-19 with low (about 8%) or high (about 30%) afucosylated (Afucos.) anti-spike IgG (n = 11) (h, i). Infection was quantified by N staining (f, h) or NG fluorescence (e, g, i). j–m, LPS-treated HD monocytes were infected with icSARS-CoV-2-mNG, preincubated with pooled plasma from patients with COVID-19, depleted or not depleted of IgG or IgA as indicated, in the presence of the indicated blocking or isotype control (Iso) antibodies (n = 3; j, k) or antiviral drugs (l (10 μM remdesivir), m), and infection was assessed 48 h later by NG fluorescence. The statistical analysis in m compared drug with no drug. n, o, RT–qPCR analysis of genomic SARS-CoV-2 N RNA (n) and sgRNA (o, left) in uninfected or infected HD monocytes (n = 3), normalized to ACTB mRNA. Infected HEK293T cells were used as a positive control (n = 3). Agarose gel electrophoresis of ethidium-bromide-stained RT–qPCR-amplified sgRNA is shown (o, right). The approximately 1,600-bp band in the samples from patients with COVID-19 was sequenced and confirmed to be N sgRNA. p, SARS-CoV-2 plaque-forming units (PFU) in culture supernatants of infected monocytes (Mono) or Vero E6 cells collected at the indicated hours post-infection (h.p.i.). For b–p, data are mean ± s.e.m. Statistical analysis was performed using two-way ANOVA with Sidak multiple-comparisons test (b–d), two-tailed nonparametric unpaired t-tests (e) and one-way ANOVA with Tukey multiple-comparisons test (f–p); *P < 0.05, **P < 0.01, ***P < 0.001, ****P < 0.0001. Data are representative of n = 3 replicate experiments.

Update of

Comment in

References

    1. Hu B, Guo H, Zhou P. & Shi ZL Characteristics of SARS-CoV-2 and COVID-19. Nat. Rev. Microbiol. 19, 141–154 (2021). - PMC - PubMed
    1. Del Valle DM et al. An inflammatory cytokine signature predicts COVID-19 severity and survival. Nat. Med. 26, 1636–1643 (2020). - PMC - PubMed
    1. Liu X, Xia S, Zhang Z, Wu H. & Lieberman J. Channelling inflammation: gasdermins in physiology and disease. Nat. Rev. Drug Discov. 20, 384–405 (2021). - PMC - PubMed
    1. Akbar AN & Gilroy DW Aging immunity may exacerbate COVID-19. Science 369, 256–257 (2020). - PubMed
    1. Dinarello CA Interleukin-1 in the pathogenesis and treatment of inflammatory diseases. Blood 117, 3720–3732 (2011). - PMC - PubMed