. 2022 Oct 1;107(10):2454-2465.
doi: 10.3324/haematol.2022.280732.

Iron- and erythropoietin-resistant anemia in a spontaneous breast cancer mouse model

Affiliations

Iron- and erythropoietin-resistant anemia in a spontaneous breast cancer mouse model

Nuria Fabregas Bregolat et al. Haematologica. .

Abstract

Anemia of cancer (AoC) with its multifactorial etiology and complex pathology is a poor prognostic indicator for cancer patients. One of the main causes of AoC is cancer-associated inflammation that activates mechanisms, commonly observed in anemia of inflammation, whereby functional iron deficiency and iron-restricted erythropoiesis are induced by increased hepcidin levels in response to raised levels of interleukin-6. So far only a few AoC mouse models have been described, and most of them did not fully recapitulate the interplay of anemia, increased hepcidin levels and functional iron deficiency in human patients. To test if the selection and the complexity of AoC mouse models dictates the pathology or if AoC in mice per se develops independently of iron deficiency, we characterized AoC in Trp53floxWapCre mice that spontaneously develop breast cancer. These mice developed AoC associated with high levels of interleukin-6 and iron deficiency. However, hepcidin levels were not increased and hypoferremia coincided with anemia rather than causing it. Instead, an early shift in the commitment of common myeloid progenitors from the erythroid to the myeloid lineage resulted in increased myelopoiesis and in the excessive production of neutrophils that accumulate in necrotic tumor regions. This process could not be prevented by either iron or erythropoietin treatment. Trp53floxWapCre mice are the first mouse model in which erythropoietin-resistant anemia is described and may serve as a disease model to test therapeutic approaches for a subpopulation of human cancer patients with normal or corrected iron levels who do not respond to erythropoietin.


Figures

Figure 1.
Figure 1.
Anemia of cancer in Trp53floxWapCre breast cancer mice. Blood from tumor-bearing Trp53floxWapCre mice (gray boxes) was taken when the tumor reached maximal permitted size (defined as terminal stage). Age-matched tumor-free Trp53floxWapCre mice (white boxes) served as controls. (A) Hematocrit (n=14-15) and hemoglobin (n=16-33) analyzed by microcentrifugation and by an ABL800, respectively, as well as erythrocyte count (n=6), proportion of overall circulating reticulocytes and proportion of immature and mature reticulocyte fractions (n=4) analyzed by a Sysmex XT-2000iV from whole blood. (B) Mean corpuscular hemoglobin, mean corpuscular hemoglobin concentration, mean corpuscular volume, and red cell distribution width (n=4-6), analyzed by a Sysmex XT-2000iV from whole blood. Data are shown as a box plot with minimum to maximum whiskers and were analyzed by a Student t-test (black symbols) or a Mann-Whitney test (red symbols or P-values) (*P<0.05, ** P<0.01, *** P<0.001). TF: tumor free; TS: terminal stage; MCH: mean corpuscular hemoglobin, MCHC: mean corpuscular hemoglobin concentration; MCV: mean corpuscular volume; RDW: red cell distribution width.
Figure 2.
Figure 2.
Inflammation in anemic Trp53floxWapCre breast cancer mice. Blood and liver tissue from tumor-bearing Trp53floxWapCre mice (gray boxes) were taken when the tumor reached maximal permitted size (defined as terminal stage, TS). Age-matched tumor-free Trp53floxWapCre mice (TF, white boxes) served as controls. (A) Liver mRNA levels of serum amyloid A 1 (Saa-1) (n=14-15) determined by quantitative polymerase chain reaction analysis and normalized to β-actin (Actb) mRNA levels (left panel) as well as plasma interleukin-6 (IL-6) levels (n=4), determined by enzyme-linked immunosorbent assay (right panel). (B) Cell counts of leukocytes, lymphocytes, monocytes, neutrophils, eosinophil, and basophils in blood from TF (white boxes) and TS (grey boxes) Trp53floxWapCre mice, analyzed by a Sysmex XT-2000iV. (n.d. not detected) (C) Representative image of suppuratively inflamed tumor regions with massive neutrophil invasion (black arrows representative examples). Scale bar 250 μm. Data are shown as a box plot with minimum to maximum whiskers and were analyzed by a Student t-test (black symbols) or a Mann-Whitney test (red symbols) (*P<0.05, **P<0.01, ***P<0.001).
Figure 3.
Figure 3.
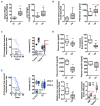
Iron and erythropoietin resistance in hypoferremic Trp53floxWapCre breast cancer mice with anemia of cancer. (A, B and D) Tissue and blood from tumor-bearing Trp53floxWapCre mice (gray boxes) were taken when the tumor reached maximal permitted size (defined as terminal stage; TS). Age-matched tumor-free Trp53floxWapCre mice (TF, white boxes) served as controls. (A) Wet weight of spleen (left panel) and liver (right panel) normalized to the bodyweight. (B) Polymerase chain reaction (qPCR)-quantified erythropoietin (Epo) mRNA levels in the kidney normalized to β-actin (Actb) (n=9-10) (left panel) as well as EPO plasma levels determined by enzyme-linked immunosorbent assay (ELISA) (n=9-12) (right panel). (C) Immediately after tumor onset, Trp53floxWapCre mice were subcutaneously injected with either 1000 U/kg EPO (purple) or saline (light blue) thrice a week until tumors reached maximal size. The modified Kaplan-Meier curve shows the percentage of mice treated with saline (light blue) or 1000 U/kg EPO (purple) which reached maximal tumor size (n=11-13) (left panel). Hematocrit levels of saline-treated (light blue) or 1000 U/kg EPO-treated (purple) tumor mice (Tumor +) as well as TF controls (Tumor -) are also shown (n=6-14) (right panel). Red arrows indicate two EPO-treated mice that showed increased hematocrit values. (D) Plasma iron and transferrin saturation (n=19-20) analyzed by a bathophenanthroline assay (upper panels). Plasma ferritin (n=6) and plasma hepcidin levels (n=5-7) analyzed by ELISA (middle panels). Liver mRNA levels of hepcidin (Hamp1) (n=9-11) as well as erythroferrone (Erfe) (n=4-6) in bone marrow (BM) and spleen were determined by qPCR and normalized to β-actin (Actb) (lower panels). (E) Trp53floxWapCre mice were intravenously injected with a single dose of iron (dark blue boxes) or saline (light blue boxes) immediately after tumor onset. In experiment 1, mice received 20 mg/kg Ferinject® and blood as well as tissues were collected 15 days after treatment (15 DAT). In experiment 2, mice received 13.28 mg/kg Ferinject® or saline and blood as well as tissues were collected when the tumor reached maximal permitted size (TS). The modified Kaplan-Meier curve shows the percentage of saline-treated (light blue) and iron-treated (dark blue) mice, which reached maximal tumor size (n=9-10) (left panel) as well as hematocrit (n=8-10) (right panel). The black and red dotted lines in (E) indicate the average values of untreated TF (black dotted line) and untreated TS (red dotted line) mice. Data are shown as a box plot with minimum to maximum whiskers and were analyzed by a Student t-test (black symbols) or a Mann-Whitney test (red symbols) (*P<0.05, **P<0.01, ***P<0.001). Modified Kaplan-Meier curves were analyzed with a log-rank (Mantel-Cox) test.
Figure 4.
Figure 4.
Late-stage erythropoiesis in anemic Trp53floxWapCre mice. Bone marrow and spleen cells from age-matched tumor free (TF) and terminal stage (TS) Trp53floxWapCre mice were collected when the tumors reached maximal permitted size and analyzed by flow cytometry. (A) Representative image of Ter119+ cells (late erythroid precursors) gating in Ter119+ vs. SSC-Area plots (left panel). Different clusters of Ter119+ cells in an FSC-Area vs. CD44 plot (right panel) identified erythroid maturation stages (I: proerythroblasts; II: basophilic erythroblasts; III: polychromatic erythroblasts; IV: orthochromatic erythroblasts (including reticulocytes); and V: mature erythrocytes) based on cell size and CD44 expression levels. (B) Average proportions of Ter119+ (red) and Ter119- (yellow) cells in bone marrow (upper panels) and spleen (lower panels) from TF (left) and TS (right) Trp53floxWapCre mice analyzed by flow cytometry (n=4). (C) Average proportion of the five maturation stages of erythrocytes (I to V) identified by flow cytometry in an FSC-Area vs. CD44 plot in bone marrow (upper panels) and spleen (lower panels) from TF (left) and TS (right) Trp53floxWapCre mice analyzed by flow cytometry (n=4). (D) Age-matched TF and tumor-bearing (TB) mice received a single intravenous 20 mg/kg iron injection when tumors reached a size of 1.5 cm. Bone marrow and spleen were harvested 48 h after injection and analyzed by flow cytometry. The proportions of bone marrow (left panel) and spleen Ter119+ cells (right panel) in iron-treated mice (n=4) are shown. Data in (B and C) are shown as average values in pie charts (n=4), data in (D) are shown as a box plot with minimum to maximum whiskers. Data were analyzed by a Student t-test (black symbols) or a Mann-Whitney test (red symbols, P-values) (***P<0.001; **P<0.01; *P<0.05). The black and red dotted lines in panel (D) indicate the average values of untreated TF (black dotted line) and untreated TS (red dotted line) mice. #in panel (D) indicates a difference (P<0.05) between iron-treated TS and untreated TS (red dotted line) mice.
Figure 5.
Figure 5.
Early-stage hematopoiesis in anemic Trp53floxWapCre mice. (A) Bone marrow and spleen from age-matched tumor free (TF, white boxes) and terminal stage (TS, gray boxes) Trp53floxWapCre mice were collected when the tumors reached maximal permitted size and analyzed by flow cytometry. Proportions of CD48-/CD150+ hematopoietic stem cells (HSC), CD48+/CD150-multipotent progenitors (MPP), CD105-/CD150+ pre-megakaryocyte erythrocyte progenitors (Pre-MgE), CD105-/CD150- pre-granulocyte-monocyte lineage cells (Pre-GM) (n=4) are shown. The proportions of CD45+/GR1+ positive leukocyte precursors in bone marrow and spleen are also shown, as well as CD150+/CD41+ megakaryocyte precursors (Mkp), CD105+/CD150+ pre-colony-forming units erythrocyte (Pre-CFUe), and CD105+/CD150- colony-forming units erythrocyte (CFUe) in bone marrow (n=4). (B) Schematic illustration of the steps of hematopoiesis. The red arrows indicate an up- or down regulation of hematopoietic precursors and the triple black arrows indicate a shift in the maturation of common myeloid progenitors (CMP) towards Pre-GM in the bone marrow of TS Trp53floxWapCre mice. (C) mRNA levels of stem cell factor (Scf) (left panel) and suppressor of cytokine signaling 3 (Socs3) (right panel) in the bone marrow (BM) and spleen, determined by quantitative polymerase chain reaction (qPCR) and normalized to (3-actin (Actb) mRNA levels (n=4-6). (D) mRNA levels of tumor necrosis factor alpha (Tnfα), interleukin 1 beta (Il-1b), granulocyte-macrophage colony-stimulating factor (Csf2) and granulocyte colony-stimulating factor (Csf3) in mammary tissue of tumor free (TF Mamma) and in tumor tissue of terminal stage Trp53floxWapCre mice (TS Tumor), determined by qPCR and normalized to (3-actin (Actb) mRNA levels (n=4-8). (E) Plasma levels of tumor necrosis factor alpha (TNFα) and Interleukin 1 beta (IL-1β) (left panel) as well as granulocyte-macrophage colony-stimulating factor (GM-CSF) and interferon gamma (INFy) (right panel) quantified by enzyme-linked immunosorbent assay (n=7-8). Data are shown as a box plot with minimum to maximum whiskers and were analyzed by a Student t-test (black P values, panel E) or a Mann-Whitney test (red symbols, P values) (***P<0.001; **P<0.01; *P<0.05).

References

    1. Gilreath JA, Stenehjem DD, Rodgers GM. Diagnosis and treatment of cancer-related anemia. Am J Hematol. 2014;89(2):203-212. - PubMed
    1. Zhang Y, Chen Y, Chen D, et al. . Impact of preoperative anemia on relapse and survival in breast cancer patients. BMC Cancer. 2014;14:844. - PMC - PubMed
    1. Nemeth E, Rivera S, Gabayan V, et al. . IL-6 mediates hypoferremia of inflammation by inducing the synthesis of the iron regulatory hormone hepcidin. J Clin Invest. 2004;113(9):1271-1276. - PMC - PubMed
    1. Pigeon C, Ilyin G, Courselaud B, et al. . A new mouse liver-specific gene, encoding a protein homologous to human antimicrobial peptide hepcidin, is overexpressed during iron overload. J Biol Chem. 2001;276(11):7811-7819. - PubMed
    1. Rivera S, Nemeth E, Gabayan V, et al. . Synthetic hepcidin causes rapid dose-dependent hypoferremia and is concentrated in ferroportin-containing organs. Blood. 2005;106(6):2196-2199. - PMC - PubMed

Publication types