. 2022 May;414(13):3945-3958.
doi: 10.1007/s00216-022-04038-y. Epub 2022 Apr 6.

MIMAS: microfluidic platform in tandem with MALDI mass spectrometry for protein quantification from small cell ensembles

Affiliations

MIMAS: microfluidic platform in tandem with MALDI mass spectrometry for protein quantification from small cell ensembles

Jorvani Cruz Villarreal et al. Anal Bioanal Chem. 2022 May.

Abstract

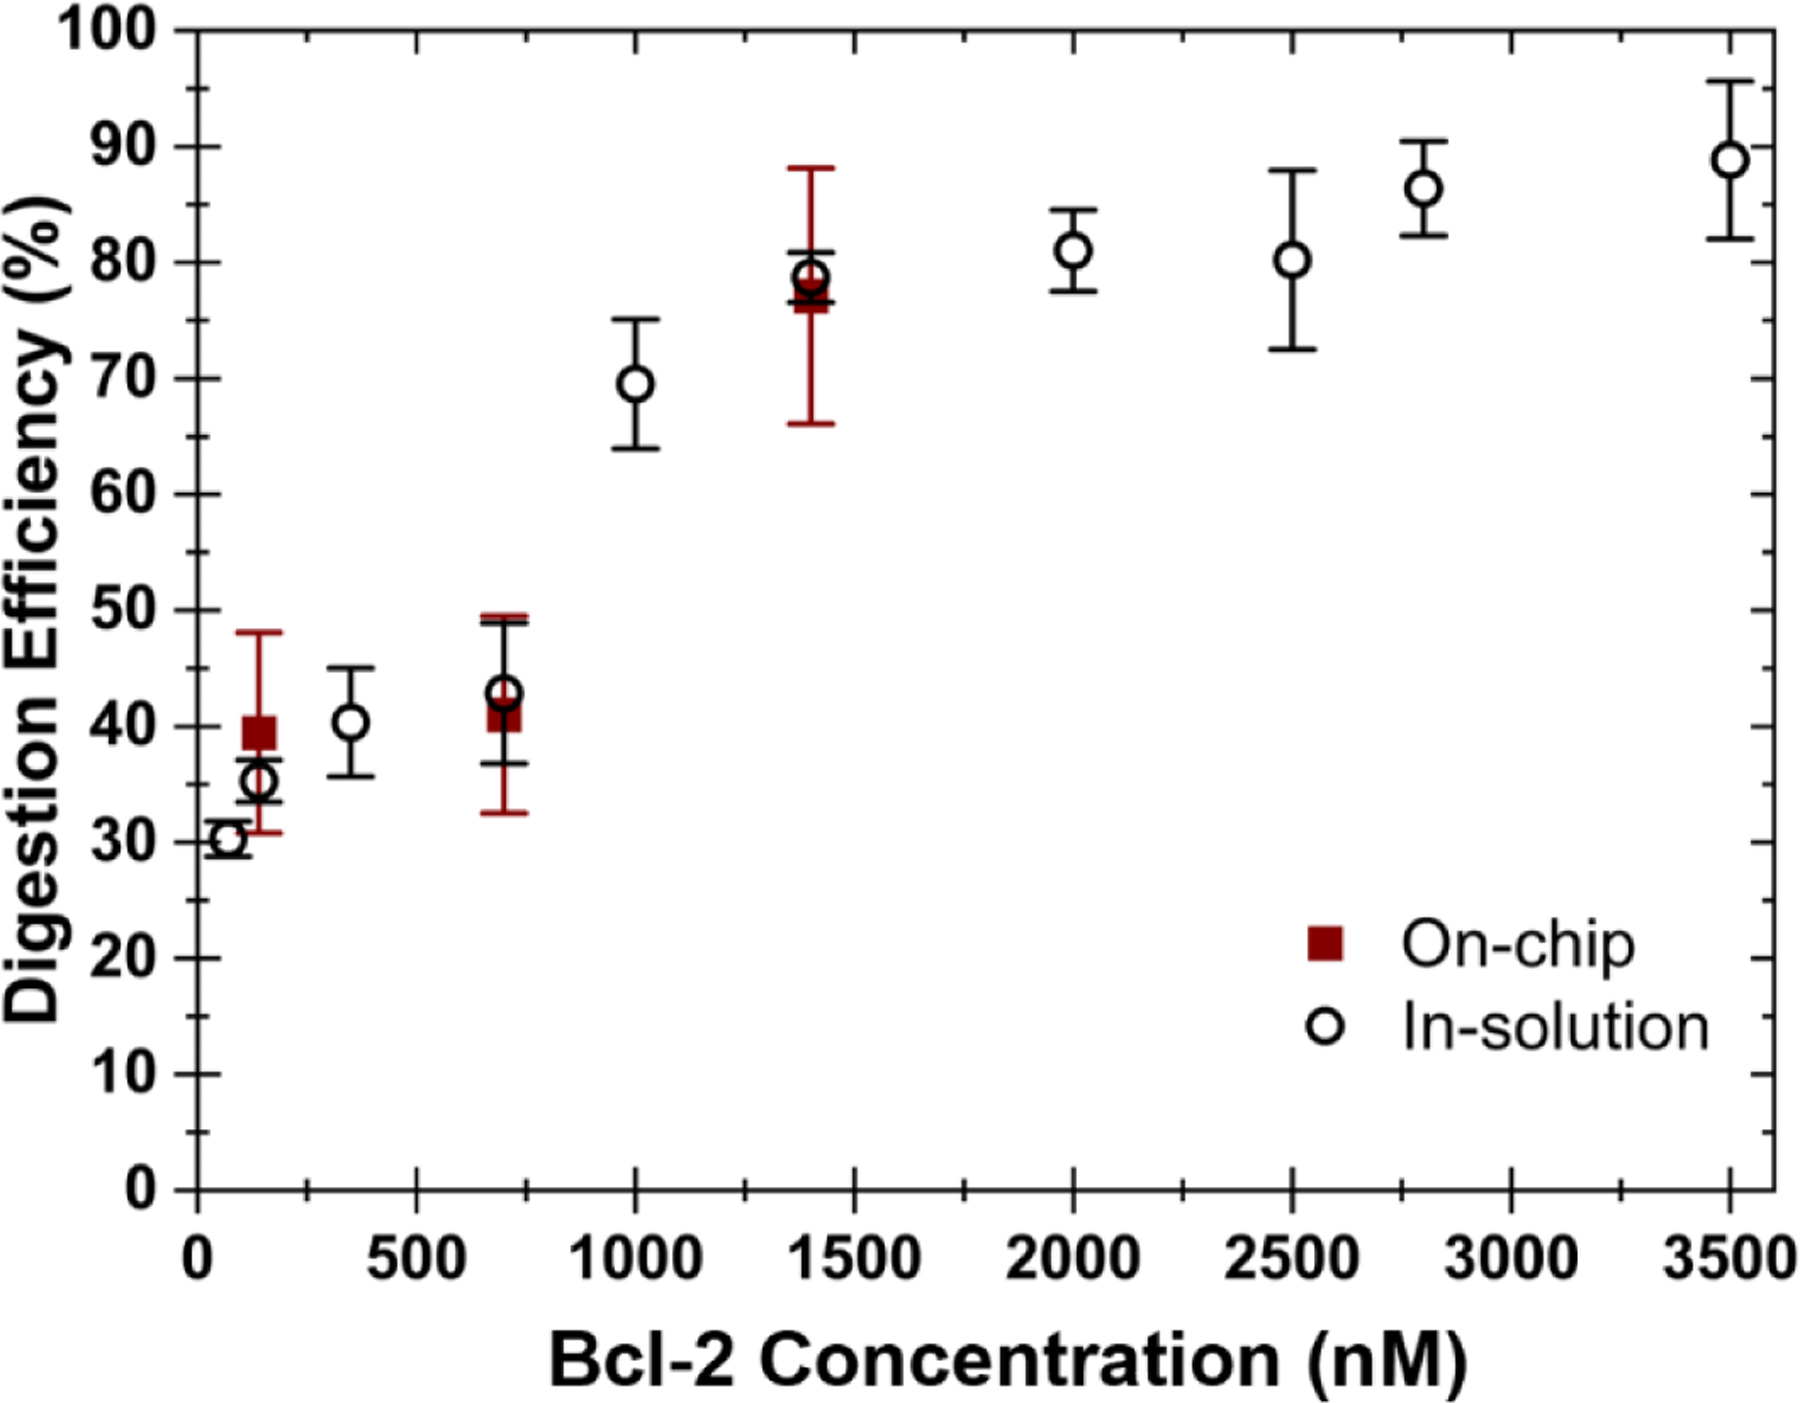
Understanding cell-to-cell variation at the molecular level provides relevant information about biological phenomena and is critical for clinical and biological research. Proteins carry important information not available from single-cell genomics and transcriptomics studies; however, due to the minute amount of proteins in single cells and the complexity of the proteome, quantitative protein analysis at the single-cell level remains challenging. Here, we report an integrated microfluidic platform in tandem with matrix-assisted laser desorption ionization time-of-flight mass spectrometry (MALDI-TOF-MS) for the detection and quantification of targeted proteins from small cell ensembles (> 10 cells). All necessary steps for the assay are integrated on-chip including cell lysis, protein immunocapture, tryptic digestion, and co-crystallization with the matrix solution for MALDI-MS analysis. We demonstrate that our approach is suitable for protein quantification by assessing the apoptotic protein Bcl-2 released from MCF-7 breast cancer cells, ranging from 26 to 223 cells lysed on-chip (8.75 nL wells). A limit of detection (LOD) of 11.22 nM was determined, equivalent to 5.91 × 10⁷ protein molecules per well. Additionally, the microfluidic platform design was further improved, establishing the successful quantification of Bcl-2 protein from MCF-7 cell ensembles ranging from 8 to 19 cells in 4 nL wells. The LOD in the smaller well designs for Bcl-2 resulted in 14.85 nM, equivalent to 3.57 × 10⁷ protein molecules per well. This work shows the capability of our approach to quantitatively assess proteins from cell lysate on the MIMAS platform for the first time. These results demonstrate our approach constitutes a promising tool for quantitative targeted protein analysis from small cell ensembles down to single cells, with the capability for multiplexing through parallelization and automation.

Keywords: Mass spectrometry; Microfabrication; Microfluidics; Protein; Quantification.


Conflict of interest statement

CONFLICT OF INTEREST

The authors declare no competing interests.

Figures

Fig. 1
Fig. 1
(a) Schematic of the device with 5 pairs of wells showing the fluidic wells and control valve layers. Inset: Bright-field microscopy image of a well pair with control layer (valves) highlighted in blue. (b) Workflow of MIMAS assay: (1) Loading of cell suspension and cell lysis by freezing and thawing cycles, (2) immobilization of anti-Bcl2 and blocking step, (3) mixing of well I and well II content, (4) immunocapture, (5) trypsin digestion, (6) addition of matrix solution and internal standard.
Fig. 2
Fig. 2
(a) Resulting Bcl-2 synthetic peptide (m/z 1210.6) peak area from MALDI-MS analysis at different concentrations (n=5) in the MIMAS device. (b) Resulting peak area ratio of Bcl-2 peptide FATVVEELFR and standard FATVVEEL(13C,15N)FR) with a fixed concentration of 1,400 nM for FATVVEEL(13C,15N)FR after the immunocapture and digestion on chip of Bcl-2 protein. Bcl-2 concentrations were varied in the MIMAS device. Error bars represent the standard deviation (n=3, except for 350 nM with n=1). Red dotted line represents the weighted linear regression with R2 = 0.99 for (a) and R2 = 0.98 for (b).
Fig. 3
Fig. 3
Digestion efficiency of Bcl-2 protein on-chip assessed with various concentrations in the 8.75 nL MIMAS well and in-solution with a fixed trypsin concentration (0.1 µg/µL). Internal standard FATVVEEL(13C,15N)FR was added to each condition at the same Bcl-2 protein concentration. The error bars represent the standard deviation (n = 8).
Fig. 4
Fig. 4
(a) Schematics of antibody immobilization with method I and II: incubation steps at 36 °C and at 4 °C, respectively. (b) Representative MS spectrum of control assay carried out with method I (36 °C). (c) Representative MS spectrum of the entire assay carried out with method I (36 °C) and an inset of the FATVVEELFR and FATVVEEL(13C,15N)FR used for quantification. (d) Representative MS spectrum of control assay carried out with method II (4 °C). (e) Representative MS spectrum of the entire assay carried out with method II (4 °C) and an inset of the FATVVEELFR and FATVVEEL(13C,15N)FR used for quantification.
Fig. 5
Fig. 5
(a) Number of Bcl-2 molecules per well vs number of cells based on the Bcl-2 tryptic peptide m/z 1210.6 ratio to the isotope labeled peptide m/z 1217.6 for antibody immobilization at 36 °C for 2 h, and at 4 °C for 2 h. (b) Number of Bcl-2 molecules per cells vs number of cells based on the ratio of Bcl-2 tryptic peptide m/z 1210.6 to the isotope labeled peptide m/z 1217.6 for antibody immobilization at 36 °C for 2 h, and at 4 °C for 2 h. Some cases lack the presence of the Bcl-2 tryptic peptide used for quantification (m/z 1210.6), thus, an estimate number of molecules per well is not available for all the data points (less than ten data points are shown per specified temperature although ten wells were tested).
Fig. 6
Fig. 6
(a) Representative spectrum of the MIMAS assay performed using 300 × 300 µm wells, indicating the Bcl-2 protein tryptic peptides. Zoom-in of the spectrum indicating the Bcl-2 peptide m/z 1210.6 and isotope labeled peptide m/z 1217.6 used for quantification. (b) Box plot of the calculated number of Bcl-2 molecules per well based on the peak area ratio of the Bcl-2 tryptic peptide and the standard using the wells with volume of 8.75 nL and 4 nL. The average number of cells for wells with 8.75 nL is 89 ± 50 and for wells with 4 nL is 14 ± 4, (significantly different at p = 0.012). (c) Box plot of the estimated number of Bcl-2 molecules per cell for the experiments in wells with volume of 8.75 nL and 4 nL, which are not significantly different (p = 0.979). The box contains 5–95% of the data, the average is presented by ■, and the line in the box represents the median.

References

    1. Altschuler SJ, Wu LF (2010) Cellular Heterogeneity: Do Differences Make a Difference? Cell 141 (4):559–563. 10.1016/j.cell.2010.04.033 - DOI - PMC - PubMed
    1. Cheung TK, Lee C-Y, Bayer FP, McCoy A, Kuster B, Rose CM (2021) Defining the carrier proteome limit for single-cell proteomics. Nat Methods 18 (1):76–83. 10.1038/s41592-020-01002-5 - DOI - PubMed
    1. Liu J, He H, Xie D, Wen Y, Liu Z (2021) Probing low-copy-number proteins in single living cells using single-cell plasmonic immunosandwich assays. Nat Protoc 16 (7):3522–3546. 10.1038/s41596-021-00547-9 - DOI - PubMed
    1. Qian M, Yan F, Yuan T, Yang B, He Q, Zhu H (2020) Targeting post-translational modification of transcription factors as cancer therapy. Drug Discov Today 25 (8):1502–1512. 10.1016/j.drudis.2020.06.005 - DOI - PubMed
    1. Chatterjee B, Thakur SS (2018) Investigation of post-translational modifications in type 2 diabetes. Clin Proteom 15 (1):32. doi:10.1186/s12014-018-9208-y - DOI - PMC - PubMed

MeSH terms

LinkOut - more resources