. 2022 Mar 21:10:863700.
doi: 10.3389/fcell.2022.863700. eCollection 2022.

Dynamic Changes in the Proteome of Early Bovine Embryos Developed In Vivo

Affiliations

Dynamic Changes in the Proteome of Early Bovine Embryos Developed In Vivo

Charles Banliat et al. Front Cell Dev Biol. .

Abstract

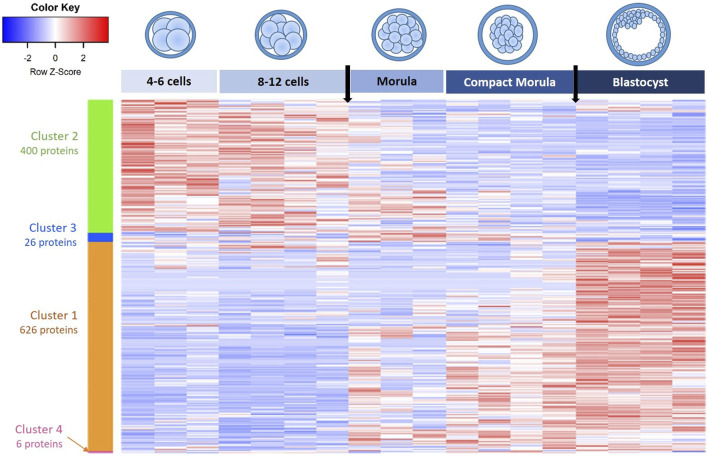
Early embryo development is a dynamic process involving important molecular and structural changes leading to the embryonic genome activation (EGA) and early cell lineage differentiation. Our aim was to elucidate proteomic changes in bovine embryos developed in vivo. Eleven females were used as embryo donors and pools of embryos at the 4-6 cell, 8-12 cell, morula, compact morula and blastocyst stages were analyzed by nanoliquid chromatography coupled with label free quantitative mass spectrometry. A total of 2,757 proteins were identified, of which 1,950 were quantitatively analyzed. Principal component analysis of data showed a clear separation of embryo pools according to their developmental stage. The hierarchical clustering of differentially abundant proteins evidenced a first cluster of 626 proteins that increased in abundance during development and a second cluster of 400 proteins that decreased in abundance during development, with most significant changes at the time of EGA and blastocyst formation. The main pathways and processes overrepresented among upregulated proteins were RNA metabolism, protein translation and ribosome biogenesis, whereas Golgi vesicle transport and protein processing in endoplasmic reticulum were overrepresented among downregulated proteins. The pairwise comparison between stages allowed us to identify specific protein interaction networks and metabolic pathways at the time of EGA, morula compaction and blastocyst formation. This is the first comprehensive study of proteome dynamics in non-rodent mammalian embryos developed in vivo. These data provide a number of protein candidates that will be useful for further mechanistic and functional studies.

Keywords: blastocyst; cattle; development; embryo; mass spectrometry; morula; proteomics.


Conflict of interest statement

Authors CB and BG were employed by the company Union Evolution. The remaining authors declare that the research was conducted in the absence of any commercial or financial relationships that could be construed as a potential conflict of interest.

Figures

FIGURE 1
FIGURE 1
Comparative analysis of proteins identified in bovine early embryos. Venn diagram showing the overlap among developmental stages and histogram showing numbers of proteins identified in each stage.
FIGURE 2
FIGURE 2
Principal component analysis of all in vivo embryos pools from the 4–6 cell to blastocyst stages. All proteins quantified with min 2 NWS in at least one stage were considered. Scatter plots represent the position of each pool of embryos along the first two dimensions of PCA. The variability between pools was mainly explained by their stage of development on the first horizontal dimension (Dim 1, 35% of variance). The square in each ellipse represents the mean of data for a given stage and colored ellipses represent the 95% confidence intervals.
FIGURE 3
FIGURE 3
Heatmap and hierarchical clustering of differentially abundant proteins (DAPs) in in vivo embryos from the 4–6 cell to blastocyst stages. Each line corresponds to one protein and each row to the abundance values of one embryo pool. Red indicates higher abundance while blue indicates lower abundance compared with other conditions. Clusters of proteins are indicated by colored vertical bars and are numbered in the decreasing order of protein numbers. Black arrows on the top indicate biggest changes in protein abundance at the time of 8-12-cell-to morula and compact morula-to-blastocyst transitions.
FIGURE 4
FIGURE 4
Functional enrichment analysis of upregulated (cluster 1) and downregulated (cluster 2) proteins during embryo development. The analysis was performed using Metascape. (A) Bar graph of enriched pathway and process terms for upregulated (top graph) and downregulated (bottom graph) proteins. (B) Bar graph of enriched cellular component terms for upregulated (top graph) and downregulated (bottom graph) proteins. Darker color of bars indicates higher significance (lower p-value).
FIGURE 5
FIGURE 5
Numbers and top-20 differentially abundant proteins after pairwise comparisons between embryonic stages. Numbers of DAPs after t-tests (p-values ≤ 0.05) and considering a min fold-change ratio of 2 are presented. Numbers before rising and downward arrows indicate upregulated and downregulated proteins, respectively. The histograms indicate the top-10 upregulated and downregulated proteins in each comparison.
FIGURE 6
FIGURE 6
Proteomaps of differentially abundant proteins (DAPs) during the 8–12 cell-to-morula transition. Proteomaps were carried out using the lists of gene names of proteins increasing [(A), upper panels] or decreasing [(B), down panels] in abundance (t-test p-value ≤ 0.05; min fold-change of 2) between the 8–12 cell and morula stages and based on the KEGG Pathway gene classification. Functional categories (left and middle panels) and related proteins (right panel) are shown by polygons. Areas of polygons illustrate protein abundance, weighted by protein size. Functionally related functions/proteins are arranged in common regions and coded using similar colors.
FIGURE 7
FIGURE 7
Protein-protein interaction networks between differentially abundant proteins (DAPs) during the 8–12-cell-to-morula transition. The PPI network was built using STRING and Cytoscape. DAPs increased in abundance between the 8–12 cell and morula stages are in red while proteins decreased in abundance are in blue. The DAPs involved in the three most significant KEGG pathways are indicated by colored circles in green.
FIGURE 8
FIGURE 8
Proteomaps of differentially abundant proteins (DAPs) during the morula-to-compact morula transition. Proteomaps were carried out using the lists of gene names of proteins increasing [(A), upper panels] or decreasing [(B), down panels] in abundance (t-test p-value ≤ 0.05; min fold-change of 2) between the morula and compact stages and based on the KEGG Pathway gene classification. Functional categories (left and middle panels) and related proteins (right panel) are shown by polygons. Areas of polygons illustrate protein abundance, weighted by protein size. Functionally related functions/proteins are arranged in common regions and coded using similar colors.
FIGURE 9
FIGURE 9
Proteomaps of differentially abundant proteins (DAPs) during the compact morula-to-blastocyst transition. Proteomaps were carried out using the lists of gene names of proteins increasing [(A), upper panels] or decreasing [(B), down panels] in abundance (t-test p-value ≤ 0.05; min fold-change of 2) between the compact morula and blastocyst stages and based on the KEGG Pathway gene classification. Functional categories (left and middle panels) and related proteins (right panel) are shown by polygons. Areas of polygons illustrate protein abundance, weighted by protein size. Functionally related functions/proteins are arranged in common regions and coded using similar colors.
FIGURE 10
FIGURE 10
Protein-protein interaction networks between differentially abundant proteins (DAPs) during the compact morula-to-blastocyst transition. The PPI network was built using STRING and Cytoscape. DAPs increased in abundance between the compact morula and blastocyst stages are in red while proteins decreased in abundance are in blue. The DAPs involved in the three most significant KEGG pathways are indicated by colored circles in green, brown and yellow.

References

    1. Algarra B., Maillo V., Avilés M., Gutiérrez-adán A., Rizos D., Jiménez-movilla M. (2018). Effects of Recombinant OVGP1 Protein on In Vitro Bovine Embryo Development. J. Reprod. Development 64 (5), 433–443. 10.1262/jrd.2018-058 - DOI - PMC - PubMed
    1. Avilés M., Gutiérrez-Adán A., Coy P. (2010). Oviductal Secretions: Will They Be Key Factors for the Future ARTs? Mol. Hum. Reprod. 16 (12), 896–906. 10.1093/molehr/gaq056 - DOI - PubMed
    1. Baldassarre M., Razinia Z., Burande C. F., Lamsoul I., Lutz P. G., Calderwood D. A. (2009). Filamins Regulate Cell Spreading and Initiation of Cell Migration. PLoS One 4 (11), e7830. 10.1371/journal.pone.0007830 - DOI - PMC - PubMed
    1. Banliat C., Tsikis G., Labas V., Teixeira-Gomes A.-P., Com E., Lavigne R., et al. (2020). Identification of 56 Proteins Involved in Embryo-Maternal Interactions in the Bovine Oviduct. Ijms 21 (2), 466. 10.3390/ijms21020466 - DOI - PMC - PubMed
    1. Bardou P., Mariette J., Escudié F., Djemiel C., Klopp C. (2014). Jvenn: an Interactive Venn Diagram Viewer. BMC Bioinformatics 15, 293. 10.1186/1471-2105-15-293 - DOI - PMC - PubMed