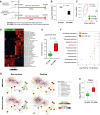
. 2022 Dec;71(12):2439-2450.
doi: 10.1136/gutjnl-2021-325021. Epub 2022 Apr 6.

Cigarette smoke promotes colorectal cancer through modulation of gut microbiota and related metabolites

Affiliations

Cigarette smoke promotes colorectal cancer through modulation of gut microbiota and related metabolites

Xiaowu Bai et al. Gut. 2022 Dec.

Abstract

Objective: Cigarette smoking is a major risk factor for colorectal cancer (CRC). We aimed to investigate whether cigarette smoke promotes CRC by altering the gut microbiota and related metabolites.

Design: Azoxymethane-treated C57BL/6 mice were exposed to cigarette smoke or clean air 2 hours per day for 28 weeks. Shotgun metagenomic sequencing and liquid chromatography mass spectrometry were parallelly performed on mice stools to investigate alterations in microbiota and metabolites. Germ-free mice were transplanted with stools from smoke-exposed and smoke-free control mice.

Results: Mice exposed to cigarette smoke had significantly increased tumour incidence and cellular proliferation compared with smoke-free control mice. Gut microbial dysbiosis was observed in smoke-exposed mice with significant differential abundance of bacterial species including the enrichment of Eggerthella lenta and depletion of Parabacteroides distasonis and Lactobacillus spp. Metabolomic analysis showed increased bile acid metabolites, especially taurodeoxycholic acid (TDCA) in the colon of smoke-exposed mice. We found that E. lenta had the most positive correlation with TDCA in smoke-exposed mice. Moreover, smoke-exposed mice manifested enhanced oncogenic MAPK/ERK (mitogen-activated protein kinase/extracellular signal‑regulated protein kinase 1/2) signalling (a downstream target of TDCA) and impaired gut barrier function. Furthermore, germ-free mice transplanted with stools from smoke-exposed mice (GF-AOMS) had increased colonocyte proliferation. Similarly, GF-AOMS showed increased abundances of gut E. lenta and TDCA, activated MAPK/ERK pathway and impaired gut barrier in colonic epithelium.

Conclusion: The gut microbiota dysbiosis induced by cigarette smoke plays a protumourigenic role in CRC. The smoke-induced gut microbiota dysbiosis altered gut metabolites and impaired gut barrier function, which could activate oncogenic MAPK/ERK signalling in colonic epithelium.

Keywords: BACTERIAL PATHOGENESIS; BILE ACID METABOLISM; COLORECTAL CANCER.


Conflict of interest statement

Competing interests: None declared.

Figures
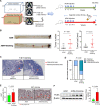
Figure 1
Figure 1
Cigarette smoking increases colorectal tumourigenicity in mice. (A) Smoking or clean chamber designed for cigarette smoke exposure and schematic overview of the AOM-induced cancer model. The mixed fresh air and smoke air was pumped into the smoking chamber and fresh air was pumped into the clean chamber. Mice were placed into the chamber 2 hours daily for 28 weeks. AOM (10 mg/kg) was injected intraperitoneally once per week for 6 consecutive weeks from day 0. Mice were sacrificed at the end of week 28 (AOM group, n=15; AOM+Smoking group, n=15). (B) Representative images of colon at sacrifice. Tumour number and tumour size in the mice of AOM and AOM+Smoking group. (C) Representative images of H&E staining of adenoma in the AOM group and adenocarcinoma in the AOM+Smoking group. (D) Incidence of adenoma and adenocarcinoma in the colon of AOM-treated mice. Statistical significance was determined by Fisher’s exact test. (E) Representative images of immunohistochemistry staining of Ki67 positive cells and proportion of Ki67 positive cells in the colon. (F) Protein expression of PCNA in the colon of AOM-treated mice by western blot. Data are expressed as mean±SD. Statistical significance was determined by unpaired Student’s t-test. AOM, azoxymethane; PCNA, proliferating cell nuclear antigen.
Figure 2
Figure 2
Cigarette smoke modulates the gut microbiota of mice. (A) Fisher statistic (alpha diversity) and (B) PCoA analysis (beta diversity) in AOM+Smoking and AOM group. Significance of alpha and beta diversity were accessed by two-tailed Mann-Whitney U test and PERMANOVA, respectively. (C) Differentially bacteria between AOM+Smoking and AOM group. Differences in abundance were detected by using a multivariate statistical model (p<0.05 (FDR corrected), FC >1.5, MaAsLin2). (D) The abundance of species Eggerthella lenta between AOM+Smoking and AOM group was validated by quantitative PCR. (E) Ecological network among differentially bacteria in AOM+Smoking group and in AOM group. Correlations were measured by SparCC method. Correlations with difference in correlation strengths between AOM+Smoking and AOM group >0.6 were selected for visualisation. AOM, azoxymethane; FC, fold change; PCoA, principal coordinates analysis; PERMANOVA, permutational multivariate analyses of variance.
Figure 3
Figure 3
Cigarette smoke alters gut microbiota-related metabolites in stool. (A) Stool metabolic profile was significantly different between AOM+Smoking and AOM group by OPLS-DA method which is a supervised multiple regression analysis for identifying discernible patterns among different groups. The x-axis captures the variation between the groups, while the y-axis captures the variation within the groups. (B) Differentially metabolites between AOM+Smoking and AOM groups, p<0.05, two-tailed Mann-Whitney U test. (C) Enrichment analysis of differentially metabolites between AOM+Smoking and AOM group. Enrichment score >1 were included. (D) The concentration of TDCA in the stool in AOM+Smoking and AOM groups was measured by targeted mass spectrometry assay, p<0.05, two-tailed Student’s t-test. (E) Association analysis of bacteria with differentially metabolites by partial’s Spearman correlation. (F) Linear association between TDCA and Eggerthella lenta by linear model with and without correction (smoke exposed/smoke free). AOM, azoxymethane; OPLS-DA, orthogonal partial least squares discriminant analysis; TDCA, taurodeoxycholic acid.
Figure 4
Figure 4
Cigarette smoke impairs the gut barrier function. (A) Protein expression of claudin-3 and ZO-1 in the colon of the AOM-treated mice by western blot. (B) Protein expression of claudin-3 and ZO-1 in the colon of the AOM-treated model by immunofluorescence staining. (C) The representative images of the structure of the colorectal gut barrier of AOM-treated mice. Arrows point to cell-cell junction under electron microscope. (a) Tight junction; (b) adherens junction; (c) desmosome; (d) gap junction. An asterisk indicates a disrupted cell junction. (D) LPS concentration in the serum of mice in the AOM and AOM+Smoking group. Data are expressed as mean±SD. Statistical significance was determined by unpaired Student’s t-test. AOM, azoxymethane; DAPI, 4′,6-diamidino-2-phenylindole; LPS, lipopolysaccharide.
Figure 5
Figure 5
Cigarette smoke enhances the expression of oncogenic MAPK/ERK pathway and proinflammatory pathway in colonic epithelium. (A) Differential expressed genes of colonic epithelium in the AOM+Smoking group compared with the AOM group by Mouse Cancer Pathway Finder PCR Array analysis (FC=AOM+Smoking/AOM, positive log2(FC)=higher expression in AOM+Smoking group and negative log2(FC)=higher expression in AOM group). FC between AOM+Smoking and AOM >2 was included. (B) The altered cancer signalling pathways in the AOM+Smoking group compared with AOM group by enrichment analysis. Enrichment scores >1 were included. The arrows represent the direction of enrichment, calculated by comparing the upregulated and downregulated genes in the pathway. The differentially expressed genes in MAPK signalling pathway were shown in network. (C) Protein expression of ρ-ERK1/2 in the colon of the AOM-treated mice by western blot. (D) Differential expressed genes of colonic epithelium in the AOM+Smoking mice compared with AOM mice by Mouse Inflammatory Response and Autoimmunity Array analysis. (E) The altered inflammatory signalling pathways in the AOM+Smoking group compared with AOM group by enrichment analysis. Enrichment score >1 were included. The differentially expressed genes in TNF and IL-17 signalling pathways were shown in network. (F) Gene expression of Cxcl2, Il-17a and Il-10 by quantitative RT-PCR. Data are expressed as mean±SD. **p<0.01, *p<0.05; statistical significance was determined by two-sided unpaired Student’s t-test. p values were adjusted by FDR (online supplemental tables 2,3). AOM, azoxymethane; ERK, extracellular signal‑regulated protein kinase; FC, fold change; Il, interleukin; MAPK, mitogen-activated protein kinase; RT-PCR, reverse transcription PCR; TNF, tumour necrosis factor.
Figure 6
Figure 6
Alteration of gut microbiota in germ-free mice with faecal microbiota transplantation from smoke-exposed conventional mice. (A) Schematic overview of the germ-free mice model. Germ-free mice were orally gavaged with stool from AOM+Smoking and AOM groups (n=8/group). Mice were sacrificed at the end of week 20. (B) Fisher statistic (alpha diversity) and (C) PCoA analysis (beta diversity) in GF-AOMS and GF-AOM group. Significance of alpha and beta diversity was accessed by two-tailed Mann-Whitney U test and PERMANOVA, respectively. (D) Differentially bacteria between GF-AOMS and GF-AOM groups. Differences in abundance were detected by using a multivariate statistical model (p<0.05 (FDR corrected), FC >1.5, MaAsLin2). (E) The abundance of species Eggerthella lenta between GF-AOMS and GF-AOM group was validated by quantitative PCR. (F) Consistent alteration in bacteria abundance (p<0.05, smoke-exposed mice vs smoke-free mice; GF-AOMS mice vs GF-AOM mice) in two mice model (germ-free mice and AOM mice). The FC in abundance between smoking and non-smoking was calculated. Red points represent germ-free mice model and yellow points represent conventional mice model. (G) Network modules were conserved after gavage feeding in the germ-free mice when comparing with the donor. Correlations were measured by SparCC method and network modules were extracted based on first-order neighbourhoods of bacteria. (H) The concentration of TDCA in the stool between GF-AOMS and GF-AOM groups measured by targeted mass spectrometry assay, p<0.05, two-tailed Mann-Whitney U test. AOM, azoxymethane; FC, fold change; GF-AOM, germ-free mice gavaged with stool from AOM donor mice; GF-AOMS, germ-free mice gavaged with stool from AOM+Smoking donor mice; PCoA, principal coordinates analysis; PERMANOVA, permutational multivariate analyses of variance; TDCA, taurodeoxycholic acid.
Figure 7
Figure 7
Altered microbiota by cigarette smoke increases colonocyte proliferation, impaired gut barrier function and enhances oncogenic MAPK/ERK and proinflammatory genes expression in germ-free mice. (A) Representative images of immunohistochemistry staining of Ki67 positive cells and proportion of Ki67 positive cells in the colon of germ-free mice. (B) Protein expression of PCNA in the colon of germ-free mice by western blot. (C) Protein expression of claudin-3 and ZO-1 in the colon of germ-free mice by western blot. (D) LPS concentration in the serum of mice in the GF-AOM and GF-AOMS group. (E) Electron microscope showing the structure of the colorectal gut barrier of germ-free mice. Arrows point to cell-cell junction. (F) Differential expressed genes of colonic epithelium in the GF-AOMS group compared with the GF-AOM group by Mouse Cancer Pathway Finder PCR Array analysis. (G) The altered cancer signalling pathways in the GF-AOMS group compared with the GF-AOM group by enrichment analysis. Enrichment scores >1 were included. The arrows represent the direction of enrichment, calculated by comparing the upregulated and downregulated genes in the pathway. The differentially expressed genes in MAPK signalling pathway were shown in network. (H) Protein expressions of ERK1/2 in the colon of mice in the GF-AOM and GF-AOMS group by western blot. (I) Differential expressed genes of colonic epithelium in the GF-AOMS group compared with the GF-AOM group by Mouse Inflammatory Response and Autoimmunity Array analysis. (J) The altered inflammatory signalling pathways in the GF-AOMS group compared with the GF-AOM by enrichment analysis. Enrichment scores >1 were included. The differentially expressed genes in TNF and IL-17 signalling pathways were shown in network. (K) Gene expression of Il-17a, Cxcl2 and Cxcr2 by quantitative RT-PCR. (a) Tight junction; (b) adherens junction; (c) desmosome; (d) gap junction. An asterisk indicates a disrupted cell junction. Data are expressed as mean±SD. *p<0.05; statistical significance was determined by two-tailed unpaired Student’s t-test. p values were adjusted by FDR (online supplemental tables 4,5). AOM, azoxymethane; ERK, extracellular signal‑regulated protein kinase; GF-AOM, germ-free mice gavaged with stool from AOM donor mice; GF-AOMS, germ-free mice gavaged with stool from AOM+Smoking donor mice; Il, interleukin; LPS, lipopolysaccharide; MAPK, mitogen-activated protein kinase; PCNA, proliferating cell nuclear antigen; RT-PCR, reverse transcription PCR; TNF, tumour necrosis factor

References

    1. Siegel RL, Miller KD, Goding Sauer A, et al. . Colorectal cancer statistics, 2020. CA Cancer J Clin 2020;70:145–64. 10.3322/caac.21601 - DOI - PubMed
    1. Carr PR, Weigl K, Edelmann D, et al. . Estimation of absolute risk of colorectal cancer based on healthy lifestyle, genetic risk, and colonoscopy status in a population-based study. Gastroenterology 2020;159:129–38. 10.1053/j.gastro.2020.03.016 - DOI - PMC - PubMed
    1. Ezzati M, Lopez AD. Estimates of global mortality attributable to smoking in 2000. Lancet 2003;362:847–52. 10.1016/S0140-6736(03)14338-3 - DOI - PubMed
    1. Gandini S, Botteri E, Iodice S, et al. . Tobacco smoking and cancer: a meta-analysis. Int J Cancer 2008;122:155–64. 10.1002/ijc.23033 - DOI - PubMed
    1. Botteri E, Iodice S, Bagnardi V, et al. . Smoking and colorectal cancer: a meta-analysis. JAMA 2008;300:2765–78. 10.1001/jama.2008.839 - DOI - PubMed

Publication types