. 2022 Apr 6;13(1):1868.
doi: 10.1038/s41467-022-29306-4.

Zoonotic origin of the human malaria parasite Plasmodium malariae from African apes

Affiliations

Zoonotic origin of the human malaria parasite Plasmodium malariae from African apes

Lindsey J Plenderleith et al. Nat Commun. .

Abstract

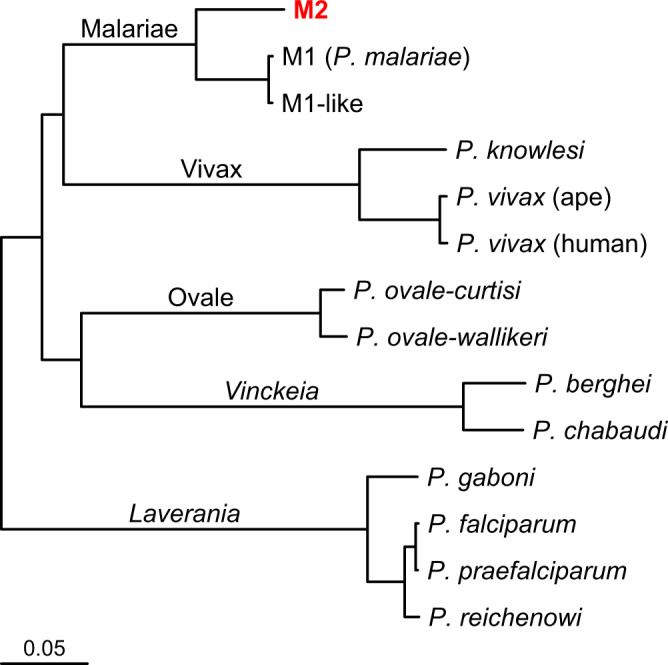
The human parasite Plasmodium malariae has relatives infecting African apes (Plasmodium rodhaini) and New World monkeys (Plasmodium brasilianum), but its origins remain unknown. Using a novel approach to characterise P. malariae-related sequences in wild and captive African apes, we found that this group comprises three distinct lineages, one of which represents a previously unknown, highly divergent species infecting chimpanzees, bonobos and gorillas across central Africa. A second ape-derived lineage is much more closely related to the third, human-infective lineage P. malariae, but exhibits little evidence of genetic exchange with it, and so likely represents a separate species. Moreover, the levels and nature of genetic polymorphisms in P. malariae indicate that it resulted from the zoonotic transmission of an African ape parasite, reminiscent of the origin of P. falciparum. In contrast, P. brasilianum falls within the radiation of human P. malariae, and thus reflects a recent anthroponosis.


Conflict of interest statement

The authors declare no competing interests.

Figures

Fig. 1
Fig. 1. Phylogenetic relationships among M1 strains (including P. malariae) and the two ape-infective lineages M1-like and M2.
a Maximum likelihood tree derived from a 641 bp mitochondrial DNA cytB fragment; this tree includes all available M2 cytB sequences, but for clarity includes only a few, representative M1 and M1-like sequences. b Maximum likelihood tree derived from a 2,038 bp mitochondrial cytB/cox1 fragment; this tree includes all available sequences of sufficient length from these lineages, and was generated from a longer alignment that encompasses the region in part a (see Supplementary Fig. 1). c Maximum likelihood tree derived from a 682 bp asl fragment. d Maximum likelihood tree derived from a 724 bp ldh fragment. Boxes represent sequences and are coloured according to the host from which the sample was derived, as indicated in the key. A black bar at the left of a box indicates a sample from a captive or sanctuary ape; asterisks denote newly derived sequences; numbers in the boxes give the sequence code (Supplementary Table 2). Bootstrap support from 1,000 replicates was 100% for the nodes separating M2 from M1 and M1-like, and for the node separating M1 from M1-like in part b. Scale bars indicate the number of nucleotide changes.
Fig. 2
Fig. 2. P. malariae-related contigs from chimpanzee sample PGABG03.
a Identity to M1-like genome assembly PmlGA01 of de novo contigs assembled from PGABG03 sequencing reads mapped to P. malariae. To improve readability, one contig with a nucleotide identity of 70% has been omitted from the plot. Contigs between 83% and 92% nucleotide identity to PmlGA01 (dashed red lines) were assumed to originate from M2 and used for further assembly; contigs between 92% and 97% identity or below 83% identity were evaluated manually and included as M2 contigs if appropriate. b Boxplot of nucleotide divergences between M1 and M1-like, and between M1 and M2; n = 285 genes, totalling 350 kb of aligned sequence. A vertical centre line indicates the median; the box indicates the interquartile range; whiskers indicate 1.5x the interquartile range; black circles represent outliers.
Fig. 3
Fig. 3. Relationship of the novel P. malariae-related species M2 to other mammalian Plasmodium species, including M1 (represented by P. malariae) and its close relative M1-like, from African apes.
A maximum-likelihood tree was derived from protein alignments. Nucleotide sequences for 186 genes with one-to-one orthologues in all 14 genomes were translated and aligned, then gene alignments were cleaned and concatenated to a single alignment from which the tree was constructed. The five major lineages are labelled; for the two corresponding to subgenera the names are italicised. The tree has been rooted on the branch to the Laverania. The new, divergent ape-derived lineage M2 appears at the top of the tree in red. Bootstrap support from 1,000 replicates was at least 99% for all nodes except that separating the Malariae and Vivax lineages from the rest of the tree. The scale bar represents 0.05 substitutions/site.
Fig. 4
Fig. 4. Relationships among M1 and M1-like strains.
a Character-based phylogenetic network showing relationships between all three M1-like strains and a subset of the highest coverage M1 genomes (PmUG01, GN01, MA01, MOpte51017, MY01, UAN, THA05), based on 990 SNPs from 45 kb of sequence callable in all genomes. Dashed arcs indicate the M1 and M1-like groups of parasites. The reticulation at the centre of the network represents alternative paths introduced by incompatible SNPs, for example in which Ptv_Leo and GA02 share an allele rather than Ptv_Leo and GA01 as in most SNPs. b Character-based phylogenetic network of all available M1 genomes, including P. brasilianum and a sample derived from a chimpanzee (MOpte51017), based on 2,050 SNPs from 1.1 Mb of sequence. The two clusters correspond to strains from Asia (upper left cluster) and Africa (lower right cluster). P. brasilianum and MOpte51017 cluster with the African human strains. Scale bars indicate substitutions/site. Strain names are coloured according to their host or geographical origin, as indicated in the key.
Fig. 5
Fig. 5. A short region of high M1 diversity on chromosome 10.
a Divergence (SNPs per callable site) from the M1 reference genome (PmUG01) is plotted for windows of 20 kb with a 100 bp step size; values are plotted at the midpoint of each window. Subtelomeric regions were not analysed and are not shown in the plot, and low-complexity and uncallable sites were changed to N. Only windows with at least 40% non-N bases were included, leading to gaps in the lines. The M1-like strains are represented as thick red (GA01) and blue (GA02) lines, and the remaining thin coloured lines represent M1 strains. M1-like strain Ptv_Leo does not appear because it had no 20 kb windows on this chromosome that met the criteria for analysis. The dashed black box highlights a region of approximately 45 kb (positions 1,680,100-1,723,901) where many M1 strains have unusually high divergence from the reference. A more detailed view of this region is shown in Supplementary Fig. 6. b Character-based phylogenetic network generated from 415 SNPs in the high-diversity region, analysing M1-like strain GA01 and the five M1 strains that had coverage of most of the region. Pairwise nucleotide diversity among these M1 strains was 0.0063 substitutions per site. c Character-based phylogenetic network generated from 26 SNPs in the high-diversity region, analysing the 16 M1 and two M1-like strains with the highest genome coverage (Supplementary Table 4). To be included in the networks, we required a variant site to be covered by all strains, and many strains had coverage gaps at different sites, hence adding more strains usually decreased the number of SNPs analysed. Strain names in the networks are coloured according to their host or geographical orgin, as indicated in the key. Scale bars indicate 0.001 substitutions/site.
Fig. 6
Fig. 6. Synonymous and nonsynonymous nucleotide polymorphisms in M1 and M1-like.
a Direction of Selection (DoS) values for M1 and M1-like. The density plots show the distribution of the DoS statistic in M1 (red) and M1-like (blue) for 903 genes with defined values of DoS in both lineages. Vertical dashed lines indicate the median DoS value for each lineage. b Unfolded site frequency spectra of SNPs at 1102 fourfold (blue) and 4583 zerofold (yellow) degenerate sites in M1.

References

    1. Sutherland, C. J. & Polley, S. D. In Genetics and Evolution of Infectious Diseases (ed. Tibayrenc, M.) 487–507 (Elsevier, 2017).
    1. Sutherland CJ. Persistent parasitism: the adaptive biology of Malariae and Ovale malaria. Trends Parasitol. 2016;32:808–819. - PubMed
    1. Mueller I, Zimmerman PA, Reeder JC. Plasmodium malariae and Plasmodium ovale – the ‘bashful’ malaria parasites. Trends Parasitol. 2007;23:278–283. - PMC - PubMed
    1. Collins WE, Jeffery GM. Plasmodium malariae: parasite and disease. Clin. Microbiol. Rev. 2007;20:579–592. - PMC - PubMed
    1. McKenzie FE, Bossert WH. Multispecies Plasmodium infections of humans. J. Parasitol. 1999;85:12–18. - PMC - PubMed