. 2022 Apr 6;13(1):1852.
doi: 10.1038/s41467-022-29515-x.

Direct measurements of mRNA translation kinetics in living cells

Affiliations

Direct measurements of mRNA translation kinetics in living cells

Mikhail Metelev et al. Nat Commun. .

Abstract

Ribosome mediated mRNA translation is central to life. The cycle of translation, however, has been characterized mostly using reconstituted systems, with only few techniques applicable for studies in the living cell. Here we describe a live-cell ribosome-labeling method, which allows us to characterize the whole processes of finding and translating an mRNA, using single-molecule tracking techniques. We find that more than 90% of both bacterial ribosomal subunits are engaged in translation at any particular time, and that the 30S and 50S ribosomal subunits spend the same average time bound to an mRNA, revealing that 30S re-initiation on poly-cistronic mRNAs is not prevalent in E. coli. Instead, our results are best explained by substantial 70S re-initiation of translation of poly-cistronic mRNAs, which is further corroborated by experiments with translation initiation inhibitors. Finally, we find that a variety of previously described orthogonal ribosomes, with altered anti-Shine-Dalgarno sequences, show significant binding to endogenous mRNAs.


Conflict of interest statement

The authors declare no competing interests.

Figures
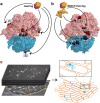
Fig. 1
Fig. 1. Single-molecule tracking of ribosomal subunits.
a Site-specific labeling of ribosomal subunits was achieved by genetically fusing the HaloTag protein to a ribosomal protein (L1, L9, L19, or L25 of the 50S subunit, and S2 of the 30S subunit). L1 is not resolved in the shown structure, and hence not highlighted. b Site-specific labelling of only a subpopulation of ribosomal subunits was achieved by introducing the MS2 RNA aptamer into a surface exposed helix of ribosomal RNA (23S rRNA H98 or H101, 16S rRNA h6 or h44), to which a co-expressed MS2CP-HaloTag fusion protein binds. c Fluorescence time-lapse movies of cells were acquired, and diffusion trajectories of labeled ribosomal subunits were automatically detected in cells segmented based on phase-contrast images.
Fig. 2
Fig. 2. HMM-estimated occupancies in different diffusion states for all fitted model sizes.
The area of the circles is proportional to the relative occupancy. Occupancies lower than 1% are shown as *. The red dashed lines indicate the threshold, 0.25 µm2/s, used for coarse-graining larger models to a two-state model. All datasets are also shown in Supplementary Data 4–7. n = 179569, 115349, 161623, and 191950 trajectory steps collected from 3, 3, 7, and 6 independent experiments for L9, H98, S2, and h6 labelling, respectively. Source data are provided as a Source Data file.
Fig. 3
Fig. 3. Distinction between freely diffusing and mRNA-bound ribosomal subunits.
a Distribution of apparent diffusion coefficient for 30S variants (h6 labelling), estimated from mean-squared-displacement analysis of diffusion trajectory segments of 7 frames. b HMM-estimated occupancy (steady-state fraction) of 30S subunit variants (h6 labelling) in mRNA-bound or freely diffusing state. n = 191950, 31023, and 43010 trajectory steps collected from 6, 2, and 3 independent experiments for 30S, O-30S, and O-30S-U1400, respectively. c Distribution of apparent diffusion coefficient for ribosomal subunits (S2 and L9 labelling) in cells untreated, or treated with 2 mg/ml KSG. d HMM-estimated occupancy of 30S and 50S subunits (S2 and L9 labelling, respectively) in the freely diffusing state in presence or absence of 2 mg/ml KSG. n = 161623, 43846, 179569, and 63265 trajectory steps collected from 7, 2, 3, and 2 independent experiments for 30S, 30S+KSG, 50S, and 50S+KSG, respectively. Panels b and d show weighted averages of coarse-grained HMM results from 7–11 state models, using 0.25 µm2/s as cutoff between bound and free subunits (Supplementary Data 12). The complete results for all model sizes (2–11) are shown in Supplementary Data 4 and 6–11. Error bars with caps represent weighted standard deviation, calculated from individual model sizes (7–11) with bootstrap estimated standard errors (shown as error bars without caps). Source data are provided as a Source Data file.
Fig. 4
Fig. 4. Translation kinetics from coarse-grained HMM-results.
a, b Estimated occupancy and dwell-time of ribosomal subunits in the mRNA-bound state or the freely diffusive state for different HMM fitting model sizes. Full models (Supplementary Data 4−7) were coarse-grained into two states: mRNA-bound or free, using the threshold 0.25 µm2/s. c, d Weighted averages of occupancy and dwell-time, based on model sizes 7–11 (as shown in panels a, b, Supplementary Data 12). Error bars with caps represent weighted standard deviation, calculated from individual model sizes (7–11) with bootstrap estimated standard errors (shown as error bars without caps). n = 179569, 115349, 161623, and 191950 trajectory steps collected from 3, 3, 7, and 6 independent experiments for L9, H98, S2, and h6 labelling, respectively. Source data are provided as a Source Data file.
Fig. 5
Fig. 5. Inhibition of initiation by AtaT toxin and KSG.
a, b HMM-estimated dwell-time of 30S and 50S subunits in the freely diffusing state (a) or in the mRNA bound state (b) in presence or absence of 20 µg/ml KSG or during the expression of the toxin AtaT. The data shows weighted averages from coarse-grained HMM-fitted model sizes 7–11 (Supplementary Data 12). Results for individual model sizes (2–11) are shown in Supplementary Data 4, 17−21. Error bars with caps represent weighted standard deviation, calculated from individual model sizes (7–11) with bootstrap estimated standard errors (shown as error bars without caps). n = 161623, 141242, 101518, 179569, 182163, and 103391 trajectory steps collected from 7, 2, 5, 3, 2, and 5 independent experiments for 30S, 30S+KSG, 30S+AtaT, 50S, 50S+KSG, and 50S+AtaT, respectively. Source data are provided as a Source Data file.
Fig. 6
Fig. 6. Estimated mRNA-bound-state dwell-time of 50S subunits at different temperatures and with microscopy data acquired at 30 or 60 ms camera exposure times.
The data shows weighted averages from coarse-grained HMM-fitted model sizes 7–11 (Supplementary Data 12). Results for individual model sizes (2–11), are shown in Supplementary Data 4 and 20−24. Error bars with caps represent weighted standard deviation, calculated from individual model sizes (7–11) with bootstrap estimated standard errors (shown as error bars without caps). n = 142400, 146595, 144083, 155262, 179569, and 93809 trajectory steps collected from 2, 2, 2, 3, 3, and 2 independent experiments for 30 and 60 ms frame time at 25 °C, 30 °C, and 37 °C respectively. Source data are provided as a Source Data file.
Fig. 7
Fig. 7. Translation kinetics of modified 30S subunits.
Estimated occupancy (a) and dwell-time (b) of tracked 30S subunit variants in the mRNA-bound state or the freely diffusive state. The data shows weighted averages from coarse-grained HMM-fitted model sizes 7–11 (Supplementary Data 12). Results for individual model sizes (2–11) are shown in Supplementary Data 7 and Supplementary Data 25−28. Error bars with caps represent weighted standard deviation, calculated from individual model sizes (7–11) with bootstrap estimated standard errors (shown as error bars without caps). n = 191950, 90335, 33838, 86221, and 55186 trajectory steps collected from 6, 6, 2, 2, and 2 independent experiments for 30S, O-ASD 30S, O-ASD-C722-A723 30S, O-30S, and O-30S-U1400, respectively. Source data are provided as a Source Data file.

Similar articles

Cited by

References

    1. Rodnina MV. The ribosome in action: Tuning of translational efficiency and protein folding. Protein Sci. 2016;25:1390–1406. - PMC - PubMed
    1. Frank, J. The translation elongation cycle-capturing multiple states by cryo-electron microscopy. Philos. Trans. R. Soc. Lond. B. Biol. Sci.372, (2017). - PMC - PubMed
    1. Kaledhonkar S, et al. Late steps in bacterial translation initiation visualized using time-resolved cryo-EM. Nature. 2019;570:400–404. - PMC - PubMed
    1. Prabhakar, A., Puglisi, E. V., Puglisi, J. D. Single-molecule fluorescence applied to translation. Cold Spring Harb. Perspect. Biol.11, (2019). - PMC - PubMed
    1. Elf J, Barkefors I. Single-molecule kinetics in living cells. Annu. Rev. Biochem. 2019;88:635–659. - PubMed

Publication types