. 2022 Apr 6;12(1):5772.
doi: 10.1038/s41598-022-09798-2.

scSPLAT, a scalable plate-based protocol for single cell WGBS library preparation

Affiliations

scSPLAT, a scalable plate-based protocol for single cell WGBS library preparation

Amanda Raine et al. Sci Rep. .

Abstract

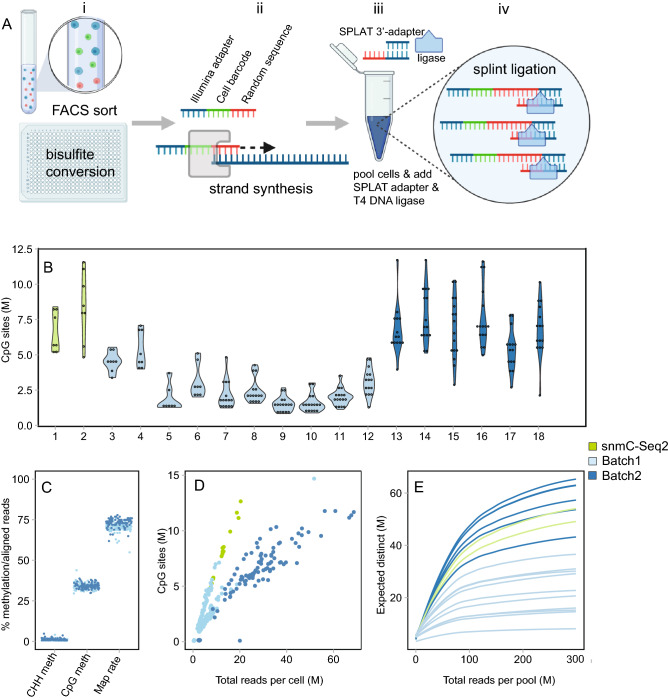
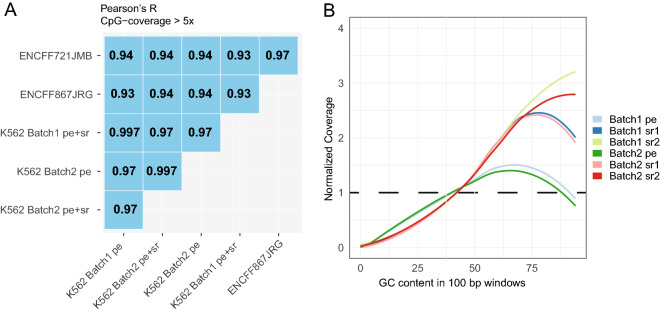
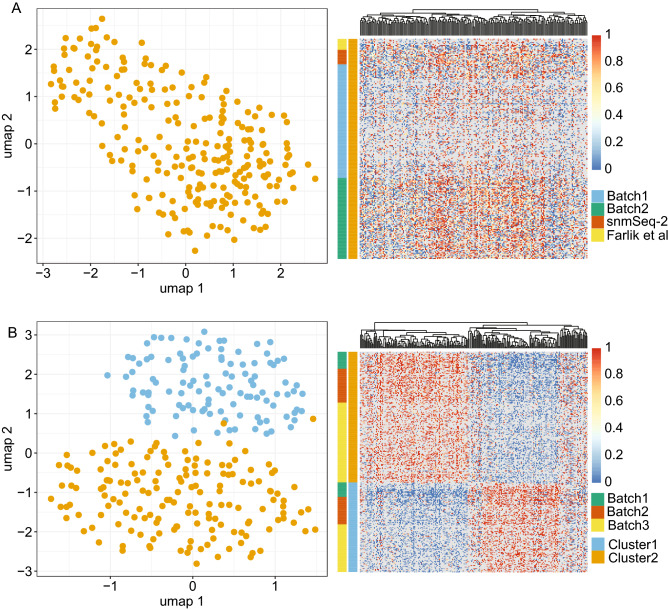
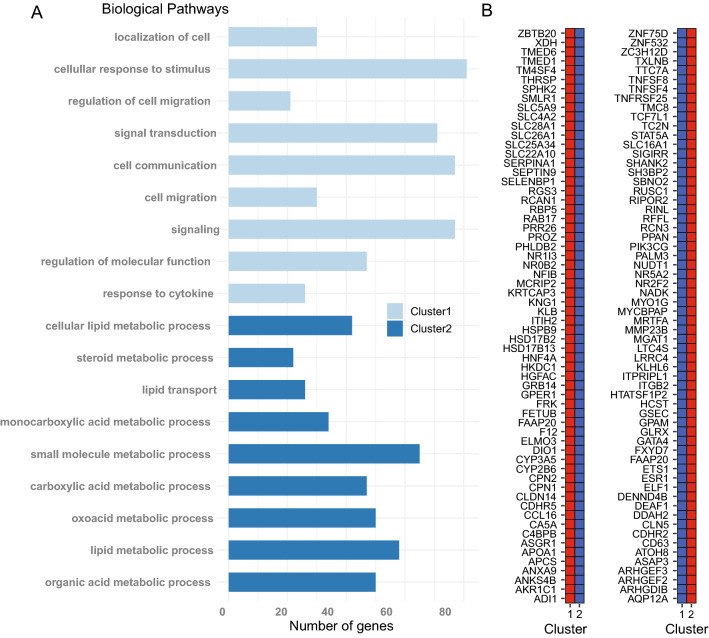
DNA methylation is a central epigenetic mark that has diverse roles in gene regulation, development, and maintenance of genome integrity. 5 methyl cytosine (5mC) can be interrogated at base resolution in single cells by using bisulfite sequencing (scWGBS). Several different scWGBS strategies have been described in recent years to study DNA methylation in single cells. However, there remain limitations with respect to cost-efficiency and yield. Herein, we present a new development in the field of scWGBS library preparation; single cell Splinted Ligation Adapter Tagging (scSPLAT). scSPLAT employs a pooling strategy to facilitate sample preparation at a higher scale and throughput than previously possible. We demonstrate the accuracy and robustness of the method by generating data from 225 single K562 cells and from 309 single liver nuclei and compare scSPLAT against other scWGBS methods.


Conflict of interest statement

The authors declare no competing interests.

Figures

Figure 1
Figure 1
Schematic overview of the scSPLAT method and quality assessment of single cell K562 data. (A) Step i-iv. i) Cells are FACS sorted into 384 wells containing lysis buffer and bisulfite conversion is performed in 384-plate format. ii) A random strand synthesis reaction is performed in each well using a randomer flagged with an inline cell barcode and 26 bp of the Illumina P5 adapter sequence. iii) Reactions from multiple wells (up to 32) are then pooled and SPRI bead purified. iv) Splinted ligation adapter tagging (SPLAT) is performed to ligate the adapter to the 3’-ends of the DNA fragments in a bulk reaction. (B) Violin plots showing the total number of covered CpG sites/cell in each library pool. Individual cells are indicated by dots overlaying the plots. Violin plot number 1–6 comprises 8 cells and number 7–18 comprises 16 cells. (C) The percentage of CHH methylation (indicative of bisulfite conversion efficiency), methylation levels in CpG-context and read mapping efficiency per K562 cell. (D) The number of CpG sites per cell covered ≥ 1 × plotted as a function of the total number of (raw) reads generated per cell. (E) Pool-wise library complexities plotted with the c-curve function in the preseq tool.
Figure 2
Figure 2
Assessment of methylation levels and GC bias in pseudo-bulk scSPLAT K562 data. (A) Single cell data were merged batch-wise to produce ‘pseudo’ bulk data sets. Pairwise methylation correlation was computed across the pseudo-bulk SPLAT data and two sets of K562 ENCODE bulk WGBS data. Pearson’s R values are shown for comparisons across ENCODE sets and pseudo-bulk SPLAT mapped in paired-end (pe) mode as well as in combined paired end and single read mode (pe + sr). (B) GC bias profiles for batch-wise merged pe and sr mapped reads respectively. Coverage was shifted towards genomic regions of higher GC content, especially for the sr mapped data (reads that were unmappable in pe mode and subsequently mapped as single reads).
Figure 3
Figure 3
Clustering of K562 and Liver nuclei based on single cell DNA methylation profiles. (A) K562 cells. Left panel show UMAP visualization of Epiclomal Region clustering of K562 cells based on CpG-island methylation. Right panel is a heat map showing mean methylation of the regions (CpG-islands) used as input for Epiclomal Region clustering of K562 cells. Blue color indicates no methylation and red color high methylation, Greys boxes in the heatmap indicates missing values. (B) Liver nuclei. Left panel show UMAP visualization of Epiclomal Region clustering of liver nuclei based on CpG-island methylation. Right panel is a heat map showing mean methylation of the regions (CpG-islands) used as input for Epiclomal Region clustering of liver nuclei.
Figure 4
Figure 4
Cluster specific gene ontology pathway analysis. (A) Result from gene ontology pathway analysis. Genes associated with a hypomethylated DMR in cluster 1 or cluster 2 and located in a promoter and/or TSS region, were used as input for GO pathway analysis. The most significant biological pathways found for cluster 1 and cluster 2, respectively are shown. Metabolic pathways were identified in cluster 2, indicating hepatocytes (HCs). For cluster 1 the identified GO pathways did not reveal a specific cell type (B) A subset of the genes with DMRs in promoter regions. The DNA methylation status of the DMRs in each respective cluster are shown (low methylation = blue, high methylation = red).

References

    1. Lee T, Zhai J, Meyers BC. Conservation and divergence in eukaryotic DNA methylation. Proc. Natl. Acad. Sci. 2010;107:9027–9028. doi: 10.1073/pnas.1005440107. - DOI - PMC - PubMed
    1. Smallwood SA, Lee HJ, Angermueller C, Krueger F, Saadeh H, Peat J, Andrews SR, Stegle O, Reik W, Kelsey G. Single-cell genome-wide bisulfite sequencing for assessing epigenetic heterogeneity. Nat. Methods. 2014;11:817–820. doi: 10.1038/nmeth.3035. - DOI - PMC - PubMed
    1. Farlik M, Sheffield NC, Nuzzo A, Datlinger P, Schönegger A, Klughammer J, Bock C. Single-cell DNA methylome sequencing and bioinformatic inference of epigenomic cell-state dynamics. Cell Rep. 2015;10:1386–1397. doi: 10.1016/j.celrep.2015.02.001. - DOI - PMC - PubMed
    1. Hui T, Cao Q, Wegrzyn-Woltosz J, O'Neill K, Hammond CA, Knapp DJ, Laks E, Moksa M, Aparicio S, Eaves CJ, Karsan A. High-resolution single-cell DNA methylation measurements reveal epigenetically distinct hematopoietic stem cell subpopulations. Stem Cell Rep. 2018;11:578–592. doi: 10.1016/j.stemcr.2018.07.003. - DOI - PMC - PubMed
    1. Luo C, Rivkin A, Zhou J, Sandoval JP, Kurihara L, Lucero J, Castanon R, Nery JR, Pinto-Duarte A, Bui B, Fitzpatrick C. Robust single-cell DNA methylome profiling with snmC-seq2. Nat. Commun. 2018;9:3824. doi: 10.1038/s41467-018-06355-2. - DOI - PMC - PubMed

Publication types