. 2022 Apr 6;12(1):5810.
doi: 10.1038/s41598-022-09721-9.

Extensive epigenetic modification with large-scale chromosomal and plasmid recombination characterise the Legionella longbeachae serogroup 1 genome

Affiliations

Extensive epigenetic modification with large-scale chromosomal and plasmid recombination characterise the Legionella longbeachae serogroup 1 genome

Sandy Slow et al. Sci Rep. .

Abstract

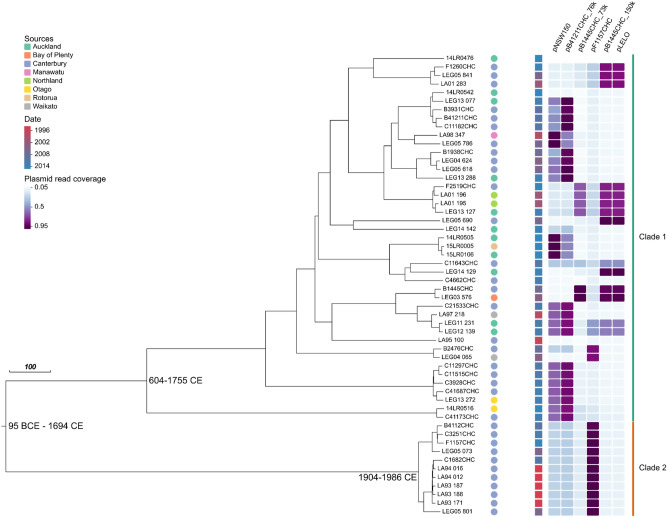
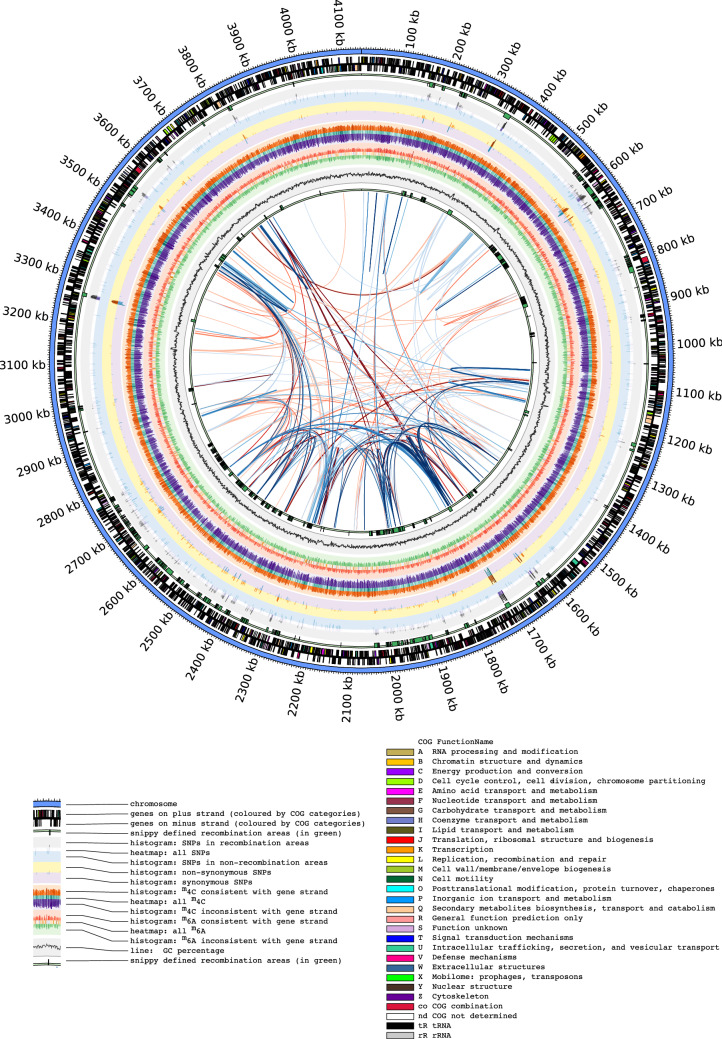
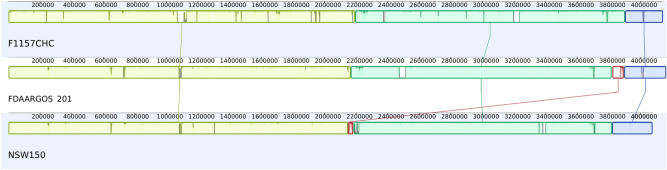
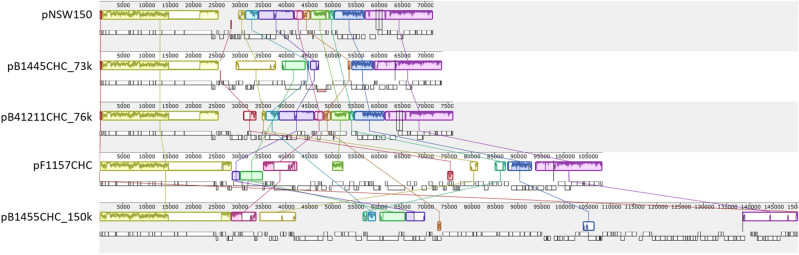
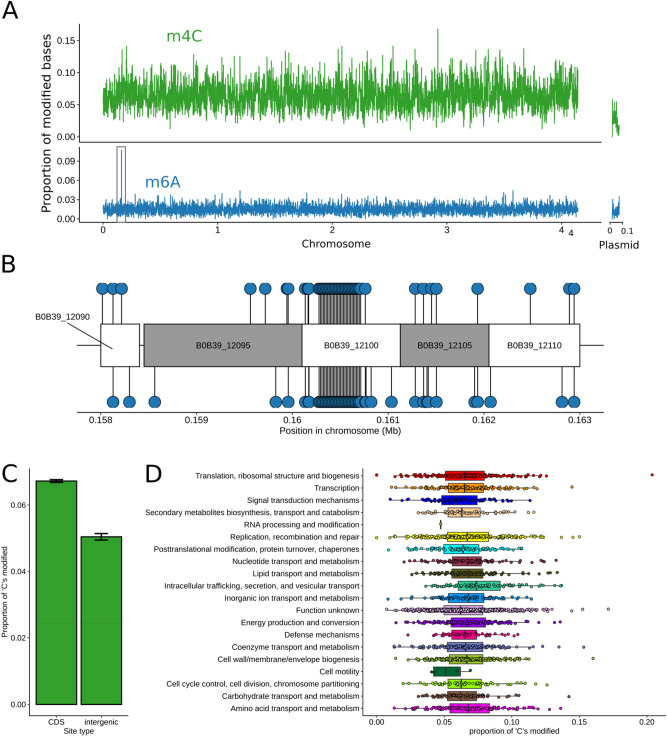
Legionella longbeachae is an environmental bacterium that is the most clinically significant Legionella species in New Zealand (NZ), causing around two-thirds of all notified cases of Legionnaires' disease. Here we report the sequencing and analysis of the geo-temporal genetic diversity of 54 L. longbeachae serogroup 1 (sg1) clinical isolates, derived from cases from around NZ over a 22-year period, including one complete genome and its associated methylome. The 54 sg1 isolates belonged to two main clades that last shared a common ancestor between 95 BCE and 1694 CE. There was diversity at the genome-structural level, with large-scale arrangements occurring in some regions of the chromosome and evidence of extensive chromosomal and plasmid recombination. This includes the presence of plasmids derived from recombination and horizontal gene transfer between various Legionella species, indicating there has been both intra- and inter-species gene flow. However, because similar plasmids were found among isolates within each clade, plasmid recombination events may pre-empt the emergence of new L. longbeachae strains. Our complete NZ reference genome consisted of a 4.1 Mb chromosome and a 108 kb plasmid. The genome was highly methylated with two known epigenetic modifications, m4C and m6A, occurring in particular sequence motifs within the genome.


Conflict of interest statement

The authors declare no competing interests.

Figures

Figure 1
Figure 1
Maximum clade credibility tree of 54 L. longbeachae clinical isolates. The scale bar represents the length of 100 years. Isolates are coloured by date of collection (squares), region (circles) and plasmid read coverage (heat map). The years in parentheses represent the estimated timing of coalescent events (95% Highest Posterior Density interval).
Figure 2
Figure 2
Circos plot of NZ L. longbeachae isolate F1157CHC. Tracks from the outside to the inside and the predicted gene functional COG category colours are denoted in the key. All data for the SNPs, methylation patterns and GC percentage are values calculated in non-overlapping 1 kb bins. The data for the SNPs and methylation patterns are shown in a log10 scale, and the histograms are also coloured so that larger values are in darker colours. In the centre of the plot are the results from the Reputer analysis, with palindromic repeats in red and forward repeats in blue. The repeats are darker in colour with a smaller Hamming distance between the repeats.
Figure 3
Figure 3
Mauve alignment of the three complete L. longbeachae sg1 genomes, F1157CHC, FDAARGOS and NSW150 from top to bottom. The 4 main collinear blocks are indicated by colours (LCB1 is red, LCB2 is yellow, LCB3 is green and LCB4 is blue). The sizes of the blocks for LCB1, LCB2, LCB3 and LCB4 are ~ 81 kb, ~ 2265 kb, ~ 1807 kb and ~ 272 kb respectively. Lines between LCBs in the isolates are for the same LCB. In the visualisation the areas within the LCBs without colour indicates underlying differences in the LCB, as explained by the fact that the LCBs are different sizes in each isolate.
Figure 4
Figure 4
Mauve alignment of five L. longbeachae reference plasmids.
Figure 5
Figure 5
The type I-F CRISPR-Cas element found in some of the L. longbeachae isolates sequenced in this study.
Figure 6
Figure 6
Methyl-distribution and methyl COG. Both methylation marks are approximately evenly distributed across the L. longbeachae genome. (A) The frequency with which m4C (above in green) and m6A (below in blue) modifications were detected is plotted in 1 kb windows, note the difference in y-axes for each sub-plot. The black box represents the region of unusually high m6A modifications highlighted in (B) and the locations of individual m6A modifications are shown as blue circles for the region with an unusually high rate of this mark. The alternating white and grey boxes represent genes in this region, and are labelled with their NCBI locus ID. The gene responsible for the very high rate of m6A modification, B0B39_12100, is a tetratricopeptide repeat protein. m4C methylation is not strongly associated with any functional class. (C) The proportion of ‘C’ nucleotides are with evidence for methylation in coding and intergenic sequences. Error bars represent a 95% confidence interval, calculated using the normal approximation of a binomial distribution. (D) Each point represents the proportion of ‘C’ nucleotides in a given gene that show evidence for methylation. The genes are grouped and shaded by the COG category (x-axis). The box plots summarise the distribution of this value across each COG category.

References

    1. Phin N, et al. Epidemiology and clinical management of Legionnaires' disease. Lancet Infect. Dis. 2014;14(10):1011–1021. - PubMed
    1. Priest PC, et al. The burden of Legionnaires' disease in New Zealand (LegiNZ): A national surveillance study. Lancet Infect. Dis. 2019;19(7):770–777. - PubMed
    1. Harte, D. Laboratory-based legionellosis surveillance, 2012. New Zealand Public Health Surveillance Report (2013).
    1. Murdoch DR, et al. Impact of routine systematic polymerase chain reaction testing on case finding for Legionnaires' disease: A pre-post comparison study. Clin. Infect. Dis. 2013;57(9):1275–1281. - PubMed
    1. Yu VL, et al. Distribution of Legionella species and serogroups isolated by culture in patients with sporadic community-acquired legionellosis: An international collaborative survey. J. Infect. Dis. 2002;186(1):127–128. - PubMed

Publication types