. 2022 Jul;16(7):1788-1797.
doi: 10.1038/s41396-022-01229-4. Epub 2022 Apr 6.

Linking transcriptional dynamics of CH4-cycling grassland soil microbiomes to seasonal gas fluxes

Affiliations

Linking transcriptional dynamics of CH4-cycling grassland soil microbiomes to seasonal gas fluxes

Jana Täumer et al. ISME J. 2022 Jul.

Abstract

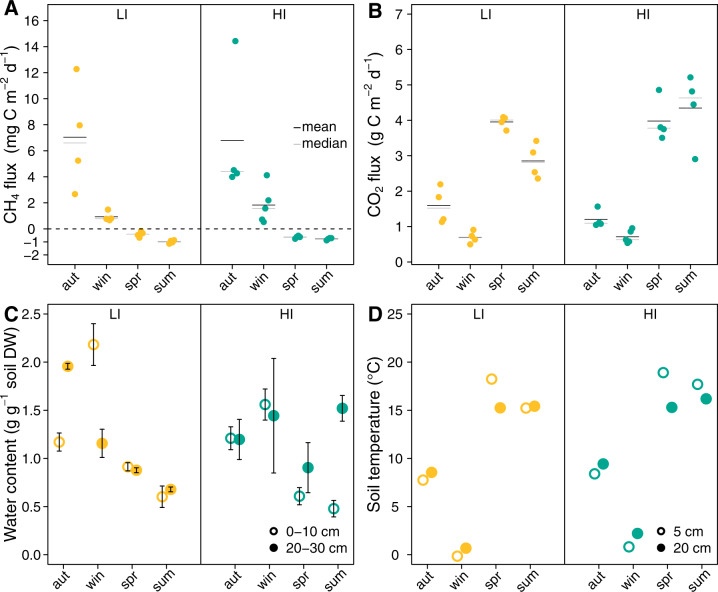
Soil CH4 fluxes are driven by CH4-producing and -consuming microorganisms that determine whether soils are sources or sinks of this potent greenhouse gas. To date, a comprehensive understanding of underlying microbiome dynamics has rarely been obtained in situ. Using quantitative metatranscriptomics, we aimed to link CH4-cycling microbiomes to net surface CH4 fluxes throughout a year in two grassland soils. CH4 fluxes were highly dynamic: both soils were net CH4 sources in autumn and winter and sinks in spring and summer, respectively. Correspondingly, methanogen mRNA abundances per gram soil correlated well with CH4 fluxes. Methanotroph to methanogen mRNA ratios were higher in spring and summer, when the soils acted as net CH4 sinks. CH4 uptake was associated with an increased proportion of USCα and γ pmoA and pmoA2 transcripts. We assume that methanogen transcript abundance may be useful to approximate changes in net surface CH4 emissions from grassland soils. High methanotroph to methanogen ratios would indicate CH4 sink properties. Our study links for the first time the seasonal transcriptional dynamics of CH4-cycling soil microbiomes to gas fluxes in situ. It suggests mRNA transcript abundances as promising indicators of dynamic ecosystem-level processes.


Conflict of interest statement

The authors declare no competing interests.

Figures

Fig. 1
Fig. 1. Net surface gas fluxes, soil temperature, and water content.
Gas fluxes of CH4 (A), CO2 (B), gravimetric soil water content (C), and temperature (D) in the soils of the grassland site with low (yellow, LI) and high (turquoise, HI) land-use intensity in autumn (aut) 2017 and winter (win), spring (spr), and summer (sum) 2018. In A and B, one point shows the average of 4–6 repeated measurements of one chamber across one day; the mean and median are indicated with a black and gray line, respectively. In C, one point represents the mean and standard deviation of three replicates taken at noon, n = 3. In D, points represent the temperature measured at 12:00 in 5 cm and 20 cm soil depth, respectively.
Fig. 2
Fig. 2. RNA and microbial biomass nitrogen content.
Correlation between RNA content and microbial nitrogen content (Nmic) per g soil dry weight (DW) in the soils of the grassland sites with low (LI, yellow) and high (HI, turquoise) land-use intensity. Linear regression RNA = 1.8182 + 0.0197 Nmic, df = 58 (dashed lines show 95% CI). The “r” denotes the Pearson correlation coefficient. Significance codes: ***p < 0.001, n = 60.
Fig. 3
Fig. 3. Soil (micro-)biome composition at the two grassland sites.
Distance-based redundancy analysis (dbRDA) of the Bray–Curtis dissimilarity matrix of all 39,854 bacterial, archaeal and eukaryotic taxa (A) and the 287 CH4-cycling Archaea and Bacteria (B) in the soils of the grassland sites with low (LI, yellow) and high (HI, turquoise) land-use intensity from the upper (0–10 cm) and the deeper soil layer (20–30 cm) taken in autumn (aut) 2017 and winter (win), spring (spr) and summer (sum) 2018. Samples from autumn, winter, spring, and summer are depicted as circles, diamonds, upward-pointing triangles, and downward-pointing triangles, respectively.
Fig. 4
Fig. 4. Methanogen SSU rRNA and mRNA abundances across seasons and depths.
Absolute abundances (SSU rRNA transcripts g−1 soil DW) of methanogenic Archaea (A), the relative abundance of SSU rRNA transcripts belonging to methanogenic Archaea normalized to the total amount of SSU rRNA transcripts belonging to methanogenic Archaea (B), and transcript abundances (mRNA transcripts g−1 soil DW) of mRNA of methanogenesis pathways (C) in soils from the upper (0–10 cm) and the deeper soil layer (20–30 cm) of the grassland sites with low (LI, yellow) and high (HI, turquoise) land-use intensity taken in autumn (aut) 2017 and winter (win), spring (spr) and summer (sum) 2018. In A, B, and C, columns show means per season and depth of the upper (0–10 cm) and the deeper soil layer (20–30 cm) in LI and HI. “unclassified methanogens” contain methanogens unclassified at the class level and low abundance methanogenic groups. Bars represent the means of three replicates. In C, error bars represent the means and the standard deviations of three replicates. Linear correlation of absolute abundances of methanogenesis mRNA transcripts with CH4 fluxes (D). In D, points represent seasonal means across both depths; samples from autumn, winter, spring, and summer are depicted as circles, diamonds, upward-pointing triangles, and downward-pointing triangles, respectively. The “r” denotes the Pearson correlation coefficient. Significance codes: *p < 0.05, **p < 0.01, ns not significant. DW dry weight. We refer to Supplementary Fig. 5 and 6 showing the absolute and relative abundances of methanogen SSU rRNA in the individual samples, respectively.
Fig. 5
Fig. 5. Absolute and relative methanotroph SSU rRNA abundances and composition of pmoA transcripts.
Absolute abundances (SSU rRNA transcripts g−1 soil DW) of methanotrophic microorganisms (Archaea and Bacteria) (A), proportion of SSU rRNA transcripts belonging to methanotrophic microorganisms normalized to the total amount of SSU rRNA transcripts belonging to methanogenic Archaea and methanotrophs (B), and the proportion of pmoA groups normalized to the total amount of pmoA transcripts (C). Columns show means per seasons and depth in soils from the upper (0–10 cm) and the deeper soil layer (20–30 cm) of the grassland sites with low (LI) and high (HI) land-use intensity taken in autumn (aut) 2017 and winter (win), spring (spr) and summer (sum) 2018. “unclassified Methylococcales” contain Methylococcales unclassified at the family level and low abundance Methylococcales families. “pmoA like” = unclassified pmoA-like sequences. Bars represent the means of three replicates. Abbreviations: DW dry weight. We refer to Supplementary Figs. 10–12 showing the absolute and relative abundances of methanotroph SSU rRNA and the pmoA composition in the individual samples, respectively.
Fig. 6
Fig. 6. Methanotroph to methanogen ratio across seasons.
The ratio of methanotroph to methanogen SSU rRNA transcripts (A) and pMMO to methanogenesis mRNA transcripts (B). The ratio was calculated with mean transcript abundances of the upper (0–10 cm) and the deeper soil layer (20–30 cm) of one soil sample. of the grassland sites with low (LI, yellow) and high (HI, turquoise) land-use intensity taken in autumn (aut) 2017 and winter (win), spring (spr) and summer (sum) 2018. Statistically significant categories of the ratios between seasons were tested with an ANOVA and subsequent post-hoc Tukey’s test at p-adjusted < 0.05 level.

References

    1. Canadell JG, Monteiro PMS, Costa, MH, Cotrim da Cunha L, Cox PM, Eliseev AV, et al. Global carbon and other biogeochemical cycles and feedbacks. In: Masson-Delmotte V, Zhai P, Pirani A, Connors SL, Péan C, Berger S, et al. editors. Climate Change 2021: The Physical Science Basis. Contribution of Working Group I to the Sixth Assessment Report of the Intergovernmental Panel on Climate Change. Cambridge University Press; 2021, in press.
    1. Rosentreter JA, Borges AV, Deemer BR, Holgerson MA, Liu S, Song C, et al. Half of global methane emissions come from highly variable aquatic ecosystem sources. Nat Geosci. 2021;14:225–30. doi: 10.1038/s41561-021-00715-2. - DOI
    1. Saunois M, Stavert AR, Poulter B, Bousquet P, Canadell JG, Jackson RB, et al. The global methane budget 2000 – 2017. Earth Syst. Sci Data. 2020;12:1561–623.
    1. Lamentowicz M, Gałka M, Pawlyta J, Lamentowicz Ł, Goslar T, Miotk-Szpiganowicz G. Climate change and human impact in the southern Baltic during the last millennium reconstructed from an ombrotrophic bog archive. Stud Quat. 2011;28:3–16.
    1. Davidson NC. How much wetland has the world lost? Long-term and recent trends in global wetland area. Mar Freshw Res. 2014;65:934–41. doi: 10.1071/MF14173. - DOI

Publication types