. 2022 Apr;604(7905):310-315.
doi: 10.1038/s41586-022-04558-8. Epub 2022 Apr 6.

A joint NCBI and EMBL-EBI transcript set for clinical genomics and research

Affiliations

A joint NCBI and EMBL-EBI transcript set for clinical genomics and research

Joannella Morales et al. Nature. 2022 Apr.

Abstract

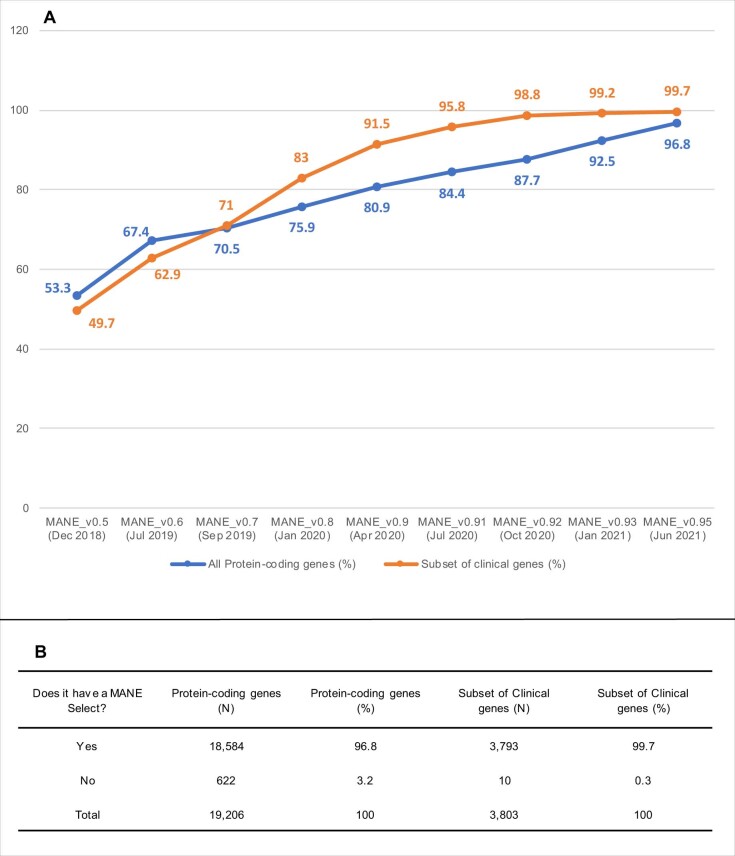
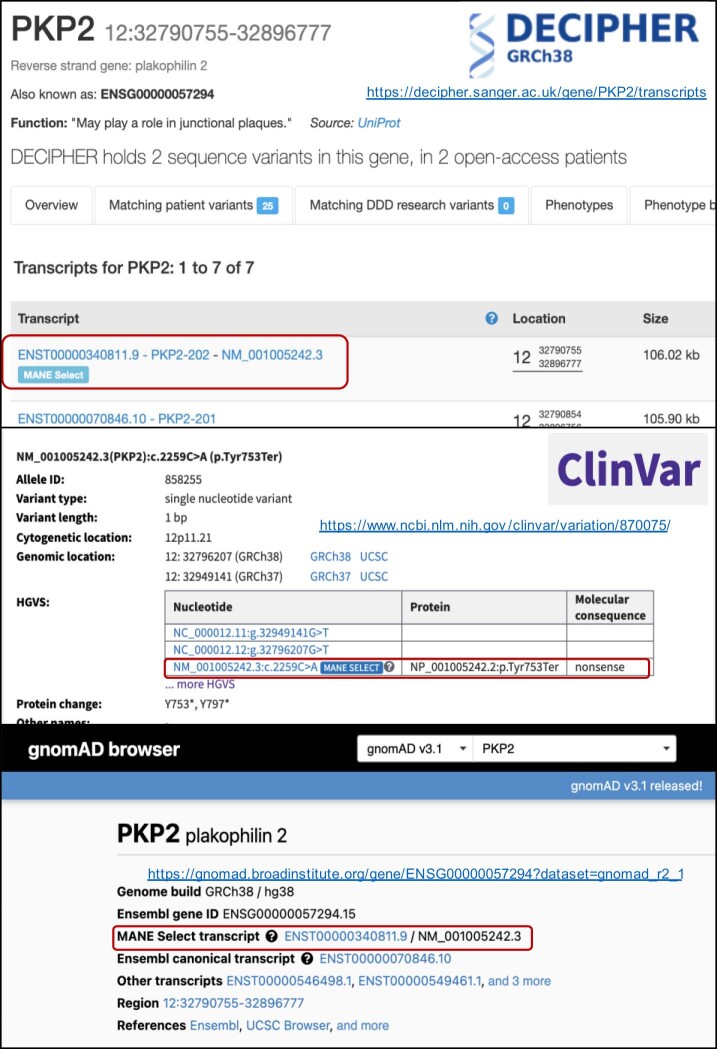
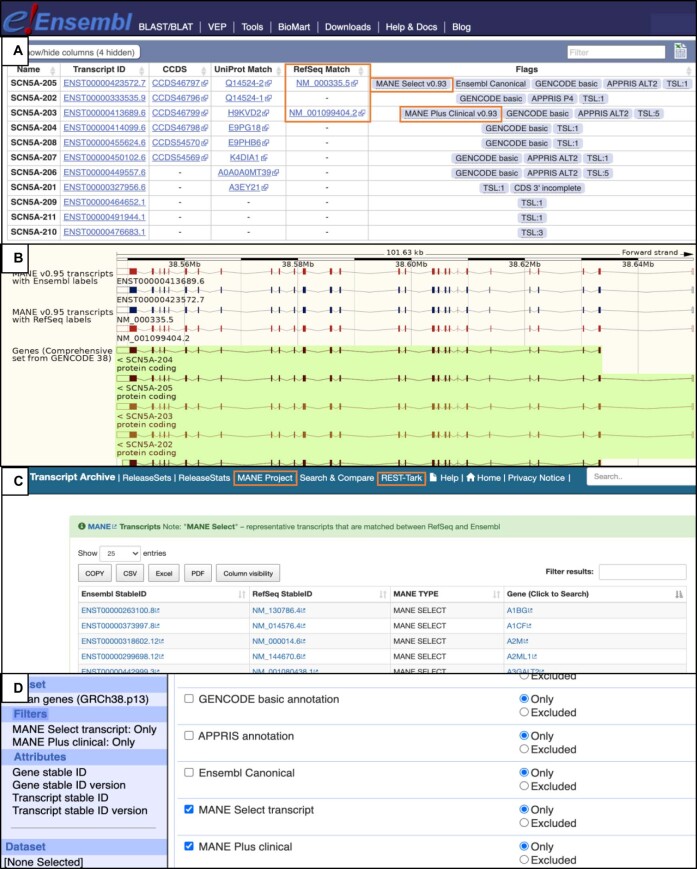
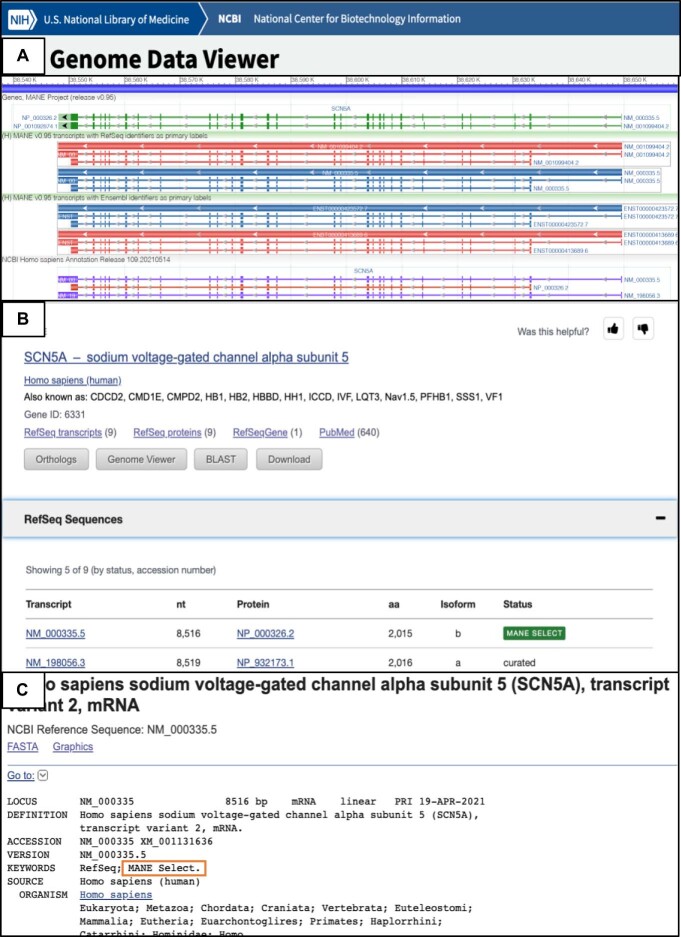
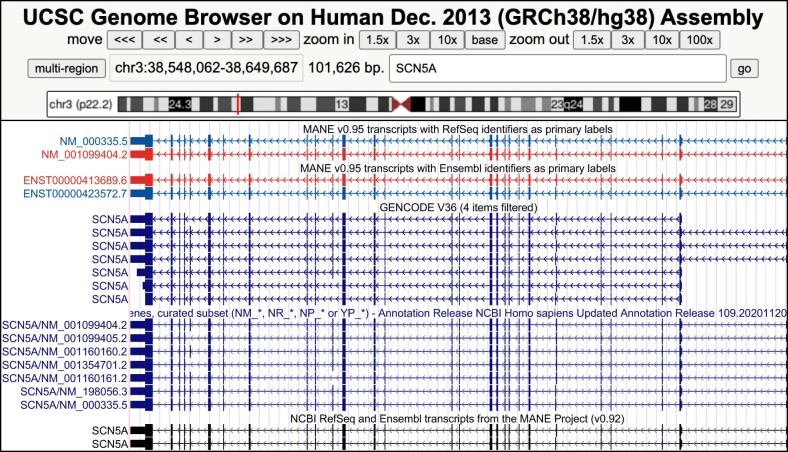
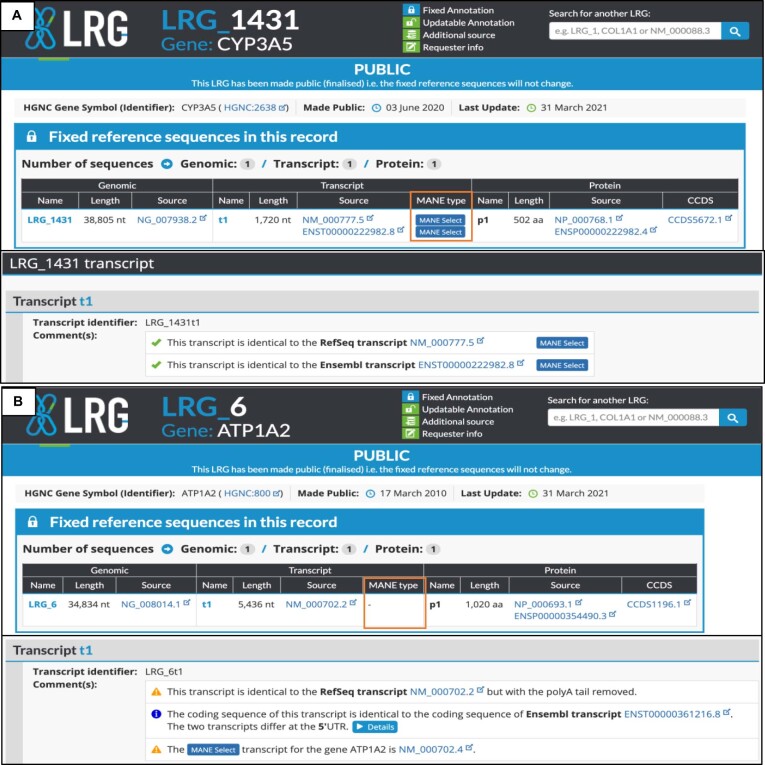
Comprehensive genome annotation is essential to understand the impact of clinically relevant variants. However, the absence of a standard for clinical reporting and browser display complicates the process of consistent interpretation and reporting. To address these challenges, Ensembl/GENCODE1 and RefSeq2 launched a joint initiative, the Matched Annotation from NCBI and EMBL-EBI (MANE) collaboration, to converge on human gene and transcript annotation and to jointly define a high-value set of transcripts and corresponding proteins. Here, we describe the MANE transcript sets for use as universal standards for variant reporting and browser display. The MANE Select set identifies a representative transcript for each human protein-coding gene, whereas the MANE Plus Clinical set provides additional transcripts at loci where the Select transcripts alone are not sufficient to report all currently known clinical variants. Each MANE transcript represents an exact match between the exonic sequences of an Ensembl/GENCODE transcript and its counterpart in RefSeq such that the identifiers can be used synonymously. We have now released MANE Select transcripts for 97% of human protein-coding genes, including all American College of Medical Genetics and Genomics Secondary Findings list v3.0 (ref. 3) genes. MANE transcripts are accessible from major genome browsers and key resources. Widespread adoption of these transcript sets will increase the consistency of reporting, facilitate the exchange of data regardless of the annotation source and help to streamline clinical interpretation.


Conflict of interest statement

E.B. is a paid consultant for Oxford Nanopore Technologies and Dovetail, Inc. P.F. is a member of the scientific advisory boards of Fabric Genomics, Inc., and Eagle Genomics, Ltd. All other authors declare no competing interests.

Figures

Fig. 1
Fig. 1. Conservation versus expression when manually curating two high-value clinical genes.
Top, gene MEN1 (HGNC:7010) tracks from NCBI GDV, as described below from top to bottom. Track 1, magnified region of the gene showing a portion of the CDS including an alternatively spliced exon (NCBI annotation release 109.20210514). Track 2, MANE v0.95 track showing the corresponding region of the MANE Select transcript (NM_001370259.2) lacking the alternatively spliced exon. Track 3, RNA-seq exon coverage (aggregate, filtered), with the numbers indicating the peak heights of the graph on a linear scale. Track 4, RNA-seq intron-spanning data from recount3, with horizontal lines depicting introns and numbers above the line indicating the number of reads. Track 5, PhyloCSF tracks. A transcript excluding the alternatively spliced exon was chosen as the MANE Select transcript owing to low expression (tracks 3 and 4) and lack of evolutionary constraint (no positive PhyloCSF signal, as indicated by blue colour) for the alternatively spliced exon. Bottom, gene TSC2 (HGNC:12363) tracks from GDV, as described below from top to bottom. Track 1, NCBI annotation release 109.20210514 track showing a portion of the coding region. Track 2, MANE v0.95 track showing the corresponding region of the MANE Select transcript (NM_000548.5). Track 3, RNA-seq exon coverage (aggregate, filtered). Track 4, portion of RNA-seq intron-spanning data from recount3. Track 5, PhyloCSF tracks. The MANE Select transcript includes the alternatively spliced protein-coding exon, which, despite its lower expression compared with neighbouring exons, shows evolutionary constraint of the CDS (presence of positive signal in the PhyloCSF track, as indicated by blue colour).
Fig. 2
Fig. 2. The need for a MANE Plus Clinical transcript for the SCN5A (HGNC:10593) gene.
Top, Ensembl browser display of the SCN5A gene showing MANE Select (blue) and MANE Plus Clinical (red) transcripts (Ensembl/GENCODE on top and RefSeq below) from MANE release v0.95. Bottom, magnified view of the portion of the gene that includes two mutually exclusive exons. The tracks are as described below, from top to bottom. Track 1, MANE v0.95 track showing the upstream MANE Select exon and downstream MANE Plus Clinical exon, shown in blue and red, respectively. Track 2, GTEx aggregate exon coverage (black wiggle plot). Track 3, ClinVar variants described as P or LP, coloured to indicate the type of variant (green, synonymous; yellow, missense; red, stop gained). Track 4, PhyloCSF tracks (one row for each frame) from NCBI GDV, with positive signal shown in blue.
Fig. 3
Fig. 3. Comparison of the MANE Select dataset with gnomAD and ClinVar.
Doughnut chart showing a comparison of MANE Select transcripts with the most frequently used RefSeq transcript accession for variant submission in ClinVar and Ensembl canonical transcripts used for display in the gnomAD v3.1.1 resource. Source data
Extended Data Fig. 1
Extended Data Fig. 1. The Select pipelines.
a, The RefSeq Pipeline picks the Select transcript based on a set of hierarchically scored criteria described in the Methods section and in more detail in Supplementary Method 1. b, The Ensembl pipeline assigns Ensembl Canonical to the transcript with the highest score, which is a sum of the component scores for each criteria (e.g. conservation, expression, APPRIS choice, UniProt choice, length). Details are listed in Supplementary Method 1.
Extended Data Fig. 2
Extended Data Fig. 2. MANE collaboration UTR definition.
Graphic display of the 5′ terminal UTR exon of the gene PTPRC (HGNC:9666) in NCBI GDV to illustrate how we defined the 5′ end of the transcript. Annotation tracks (top to bottom) show transcripts in RefSeq Annotation Release 109_20210514, transcripts in Ensembl Release 104 and the MANE Select (v0.95) track. The longest 5′ UTR among the RefSeq and Ensembl/GENCODE annotation sets is flagged at the first base with a blue vertical box. The “FANTOM Total CTSS Counts” track displays histograms representing CAGE tag counts at each base position. The strongest CAGE peak (the most abundant start site or the base position with the absolute maximum CAGE tag count) is highlighted with a yellow vertical box. The “RefSeq Processed CAGE” track at the bottom displays the start site (highlighted with a green vertical box) selected by the UTR algorithm. Details of how the UTR algorithm works are covered in the Methods and provided in Supplementary Method 3: UTR algorithm. A similar logic was used to compute polyA clusters and determine the 3′ ends of transcripts.
Extended Data Fig. 3
Extended Data Fig. 3. Frequency of TSS signatures in RefSeq, Ensembl, and MANE transcripts.
A) Frequency of A, C, G, T nucleotides at each position (y-axis) relative to the transcription start site (x-axis). MANE transcripts show an enrichment of C at −1, and purine (A or G) at +1. B) Count of transcripts with a best Inr motif (y-axis) placed relative to the TSS (x-axis). The peak of Inr motifs at −3 corresponds to the core CA motif located at −1 to +1. C) Count of transcripts with a TATA-box (y-axis) placed relative to the transcription start site (x-axis). The peak of TATA-box motifs at −31 corresponds to the core TATAAA box motif located at −28 to −23 upstream of the TSS. Details of the methods are available in Supplementary Methods 1. Source data
Extended Data Fig. 4
Extended Data Fig. 4. MANE Select coverage over time.
(A) Graphical display of the percentage of all protein-coding genes (blue) and of the subset of clinical genes (orange) that have a defined MANE Select transcript per each MANE project release over time. (B) Number of genes that have a defined MANE Select transcript (MANE v0.95). The list includes 101 genes that will require the MANE Select to be defined using an ALT or PATCH (rather than the GRCh38 Primary Assembly). It does not include an additional set of 345 genes that require review due to conflicting gene types between RefSeq and Ensembl/GENCODE.
Extended Data Fig. 5
Extended Data Fig. 5. Commonly used resources that have adopted the MANE Select in their browsers and display.
Top panel: A screenshot of the gene page of PKP2 (HGNC:9024) in the DECIPHER database (https://www.deciphergenomics.org/). The transcript table on the gene page shows the MANE Select label with the RefSeq and Ensembl identifiers (marked by a red box). Middle panel: A ClinVar variant display (https://www.ncbi.nlm.nih.gov/clinvar/variation/870075/) page for the gene PKP2 (allele ID 858255). The HGVS table in this page includes the RefSeq component of the MANE Select (indicated by red box). Bottom panel: A display page from the Genome Aggregation Database gnomAD v3.1. The MANE Select pair, along with the RefSeq and Ensembl identifiers, are displayed at the top of the page (indicated by red box). We note that UniProt, another commonly used resource, will update their browser soon to include flagged MANE Select proteins.
Extended Data Fig. 6
Extended Data Fig. 6. Display of MANE data in Ensembl.
(A) In Ensembl’s Gene page, the Ensembl/GENCODE transcript(s) in the MANE set is highlighted with the “MANE Select” or “MANE Plus Clinical” flags, visible in the last column of the transcript table. The identical RefSeq transcript is highlighted in the same table, in the column titled “RefSeq Match”. (B) Graphical representation is visible in the Location page after configuring the view by adding the custom-made MANE Project track hub (https://ftp.ncbi.nlm.nih.gov/refseq/MANE/trackhub/hub.txt). (C) The list of MANE transcripts can be accessed and downloaded from Ensembl’s Transcript Archive (Tark) MANE Project page (http://tark.ensembl.org/web/manelist) and programmatically using APIs available in the REST API page (http://tark.ensembl.org/api/#!/transcript/transcript_manelist_list), or Ensembl’s REST API e.g. https://rest.ensembl.org/overlap/id/ENSG00000128573?feature=mane;content-type=text/xml. (D) MANE data can also be downloaded from Ensembl BioMart (https://www.ensembl.org/biomart/martview/c24cb3213fe65da552fcb8b755c2910c) by choosing the ‘Human Genes (GRCh38.p13) dataset and the ‘MANE transcripts’ filter.
Extended Data Fig. 7
Extended Data Fig. 7. Access to MANE data in NCBI resources.
(A) Genome Data Viewer (GDV). The MANE track (green, at the top) shows RefSeq transcripts assigned as MANE Select and MANE Plus Clinical for the gene SCN5A (HGNC:10593). The middle section shows RefSeq and Ensembl identifiers included in the MANE sets, available by adding the MANE track hub using the ‘Configure Track Hubs’ menu. The bottom section shows a portion of RefSeq annotation release 109.20210514. (B) The gene search results page (shown here for the gene SCN5A), reached by searching for any human protein-coding gene in https://www.ncbi.nlm.nih.gov/gene/, flags the MANE Select in the expanded transcript list. (C) A portion of the transcript record of NM_000335.5, the MANE Select for SCN5A. The MANE Select tag (boxed) is included in the ‘KEYWORDS’ section. The keyword can be used in Nucleotide and Protein database queries to extract a list of MANE Select transcripts. For example: PALM[gene] AND MANE Select[keyword]. The entire list of MANE Select transcripts can be obtained using the Entrez query “Homo sapiens[organism] AND MANE_select[keyword]”. MANE data can also be parsed from the annotation files available in the NCBI RefSeq FTP page (https://ftp.ncbi.nlm.nih.gov/refseq/H_sapiens/annotation/annotation_releases/109.20210514/GCF_000001405.39_GRCh38.p13/) using the “MANE Select” tag attribute (tag=MANE Select in GFF3, or tag ”MANE Select'' in GTF), in the rows associated with the mRNA, CDS and exon features. In addition, column 9 also contains the matching Ensembl transcript identifier as an external database reference (Dbxref). Rows in the annotation files associated with the CDS feature contain the MANE Select tag, along with the matching Ensembl protein identifier.
Extended Data Fig. 8
Extended Data Fig. 8. Access to MANE Data in UCSC browser.
The MANE data are accessible in UCSC’s Genome Browser as a data track in the Genes and Gene Predictions section (bottom of figure). MANE data can also be viewed in this browser by adding the track hub (https://ftp.ncbi.nlm.nih.gov/refseq/MANE/trackhub/hub.txt), which displays the RefSeq and Ensembl identifiers of the MANE Select separately (top of figure), as shown in this display of the SCN5A (HGNC:10593).
Extended Data Fig. 9
MANE transcript display in LRG records. Screenshots of the LRG records for the genes CYP3A5 (HGNC:2638) (http://ftp.ebi.ac.uk/pub/databases/lrgex/LRG_1431.xml) and ATP1A2 (HGNC:800) (http://ftp.ebi.ac.uk/pub/databases/lrgex/LRG_6.xml) displaying MANE transcript annotations. As illustrated in this figure, if the LRG and MANE Select transcripts are identical (Panel A, LRG_1431 for CYP3A5), the MANE Select flag is displayed in the Fixed Reference Sequence and Transcript sections of the LRG. In the event that the LRG transcript is not the MANE Select (Panel B, LRG_6 for ATP1A2), there will be no flag in the Fixed reference section but the MANE Select transcript will be listed in the Transcript section for the user’s information.

References

    1. Frankish A, et al. GENCODE 2021. Nucleic Acids Res. 2021;49:D916–D923. doi: 10.1093/nar/gkaa1087. - DOI - PMC - PubMed
    1. O’Leary NA, et al. Reference sequence (RefSeq) database at NCBI: current status, taxonomic expansion, and functional annotation. Nucleic Acids Res. 2016;44:D733–D745. doi: 10.1093/nar/gkv1189. - DOI - PMC - PubMed
    1. Miller DT, et al. ACMG SF v3.0 list for reporting of secondary findings in clinical exome and genome sequencing: a policy statement of the American College of Medical Genetics and Genomics (ACMG) Genet. Med. 2021;23:1381–1390. doi: 10.1038/s41436-021-01172-3. - DOI - PubMed
    1. Landrum MJ, et al. ClinVar: improvements to accessing data. Nucleic Acids Res. 2020;48:D835–D844. doi: 10.1093/nar/gkz972. - DOI - PMC - PubMed
    1. ENCODE Project Consortium et al. Expanded encyclopaedias of DNA elements in the human and mouse genomes. Nature. 2020;583:699–710. doi: 10.1038/s41586-020-2493-4. - DOI - PMC - PubMed