. 2022 Apr;604(7905):316-322.
doi: 10.1038/s41586-022-04564-w. Epub 2022 Apr 6.

A complete temporal transcription factor series in the fly visual system

Affiliations

A complete temporal transcription factor series in the fly visual system

Nikolaos Konstantinides et al. Nature. 2022 Apr.

Abstract

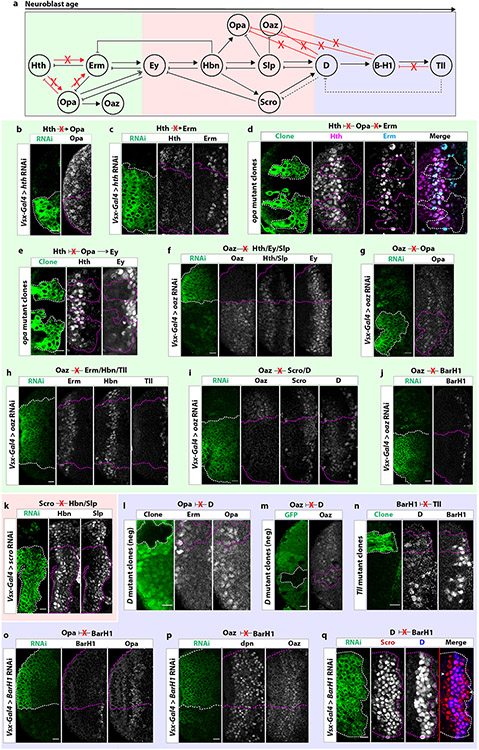
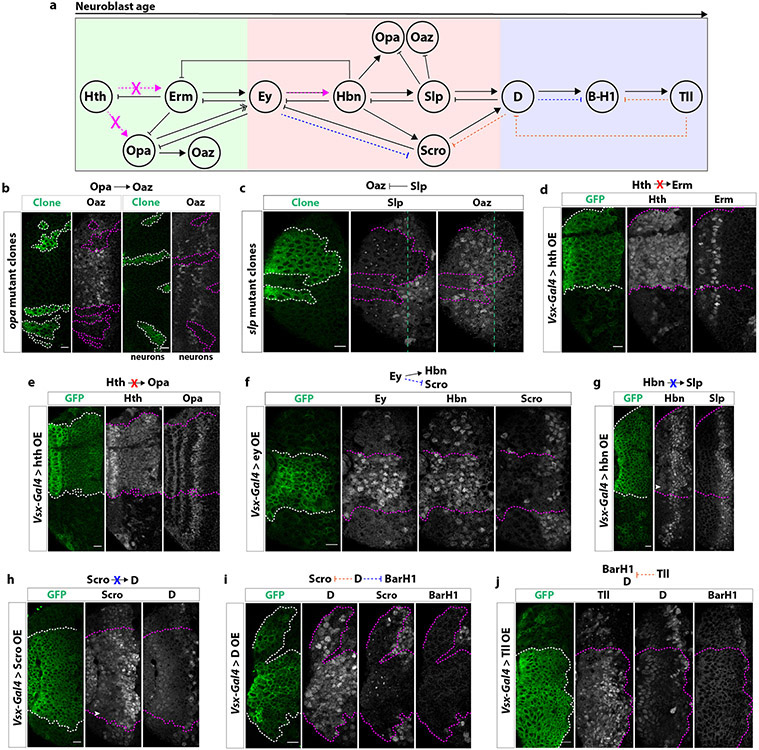
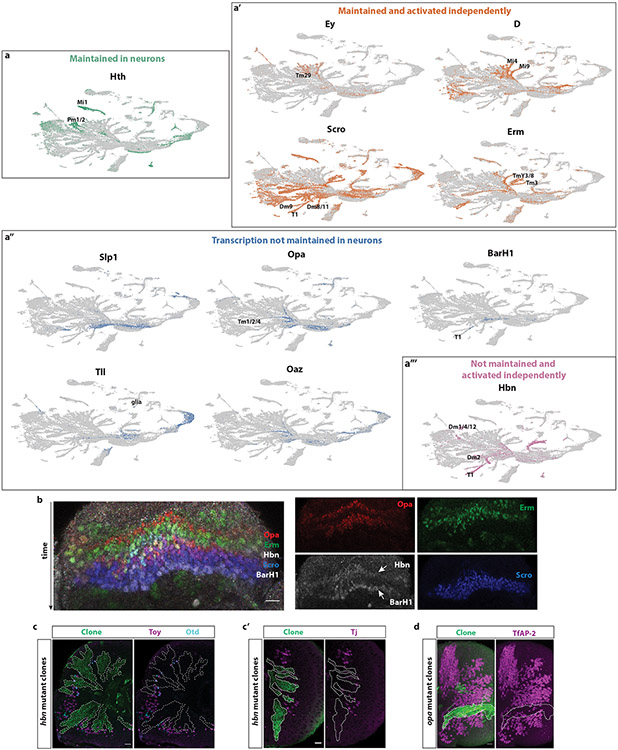
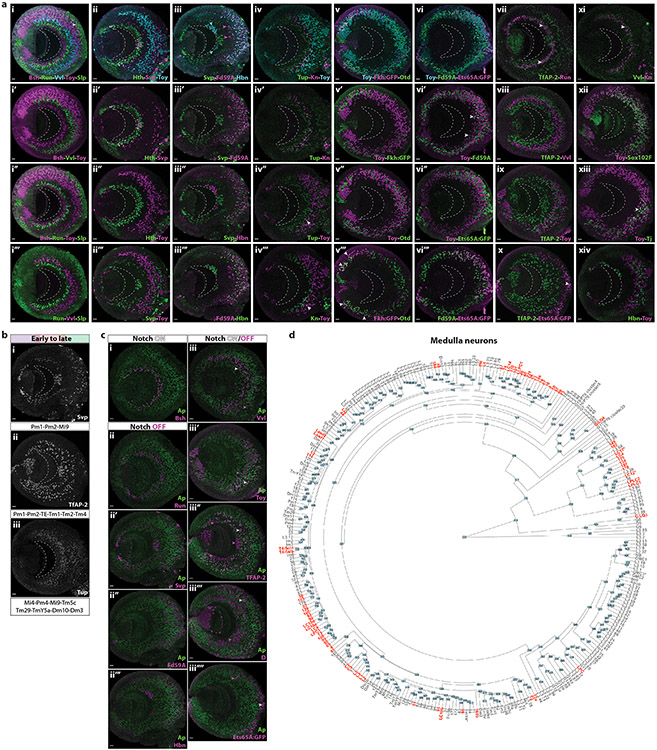
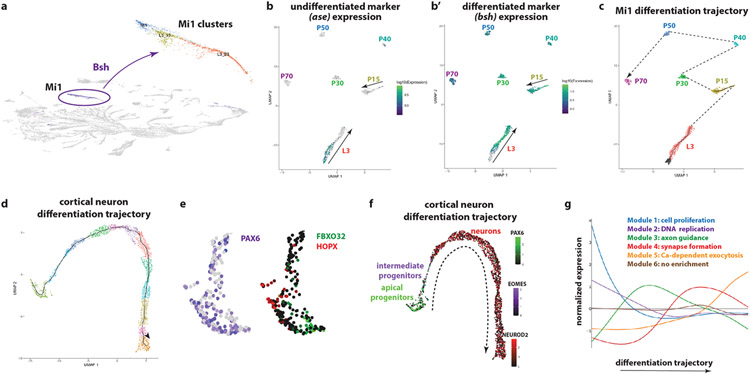
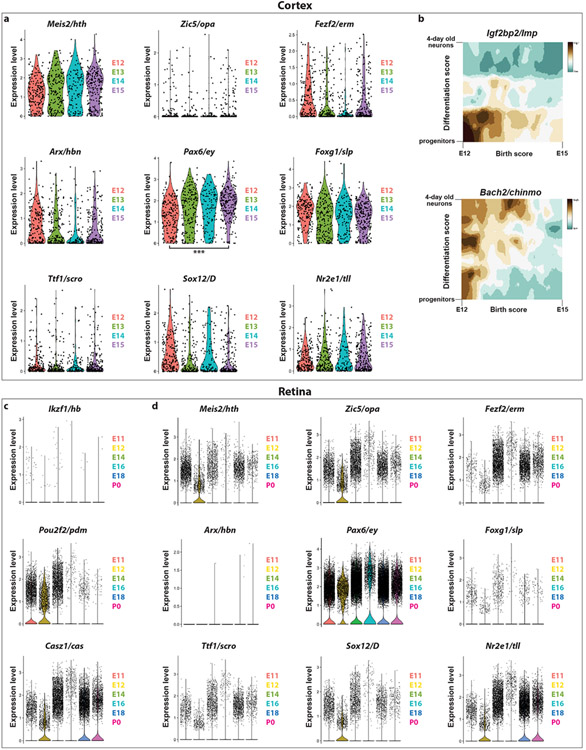
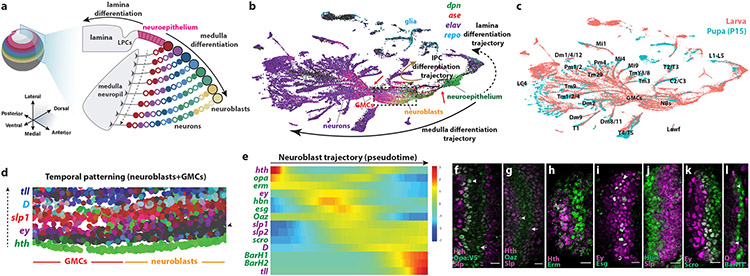
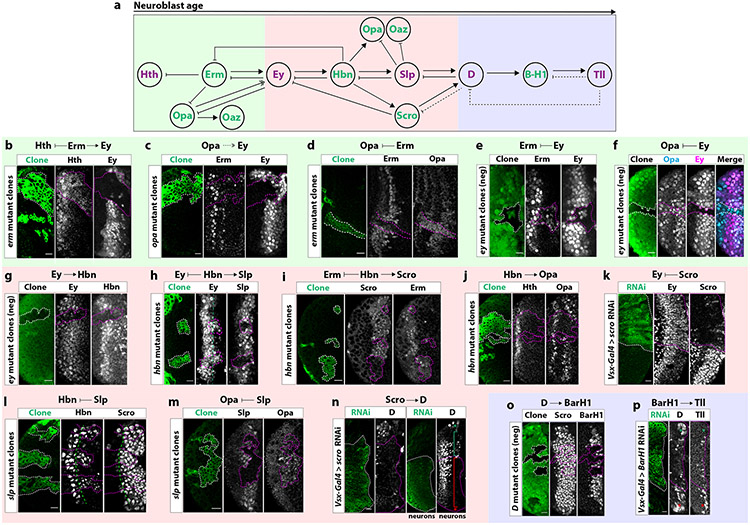
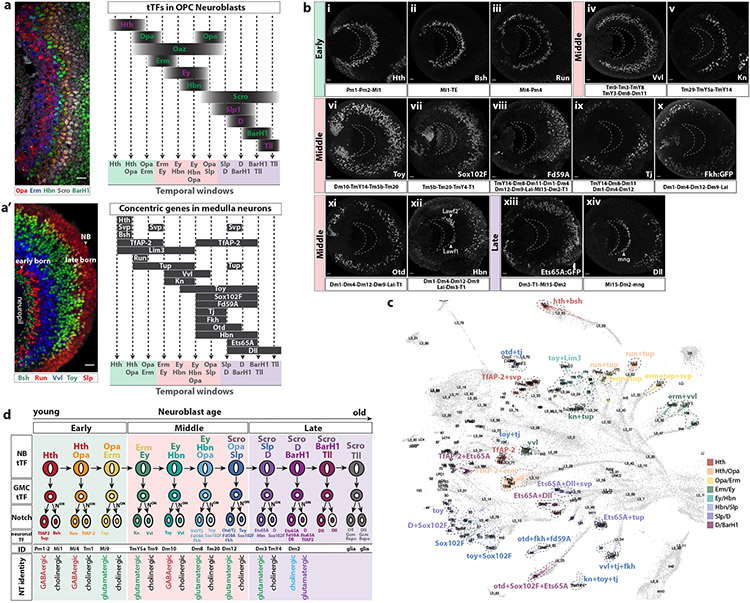
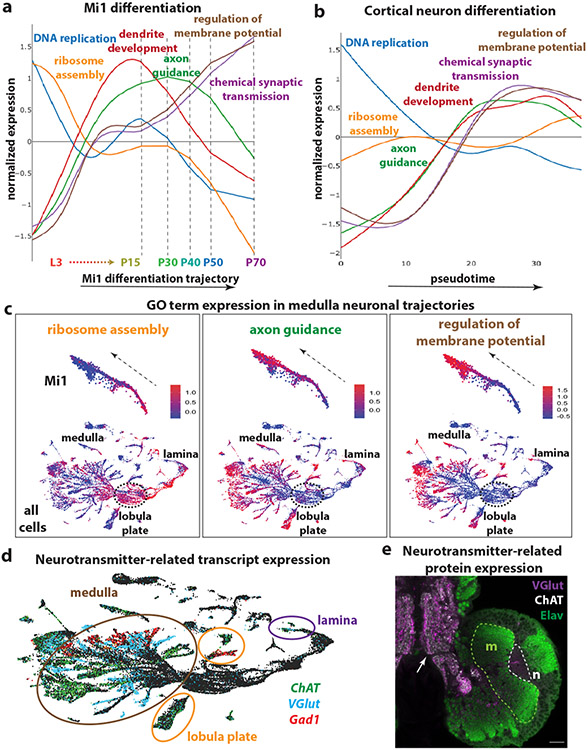
The brain consists of thousands of neuronal types that are generated by stem cells producing different neuronal types as they age. In Drosophila, this temporal patterning is driven by the successive expression of temporal transcription factors (tTFs)1-6. Here we used single-cell mRNA sequencing to identify the complete series of tTFs that specify most Drosophila optic lobe neurons. We verify that tTFs regulate the progression of the series by activating the next tTF(s) and repressing the previous one(s), and also identify more complex mechanisms of regulation. Moreover, we establish the temporal window of origin and birth order of each neuronal type in the medulla and provide evidence that these tTFs are sufficient to explain the generation of all of the neuronal diversity in this brain region. Finally, we describe the first steps of neuronal differentiation and show that these steps are conserved in humans. We find that terminal differentiation genes, such as neurotransmitter-related genes, are present as transcripts, but not as proteins, in immature larval neurons. This comprehensive analysis of a temporal series of tTFs in the optic lobe offers mechanistic insights into how tTF series are regulated, and how they can lead to the generation of a complete set of neurons.


Conflict of interest statement

Declaration of Interests

Authors declare no conflicts of interest.

Figures

Extended Data figure 1:
Extended Data figure 1:. Integration of libraries
(a-a’) Comparison of library distribution on a tSNE plot of datasets before (merged) and after library integration (batch effect correction). Before integration, there is a clear bias in the distribution of the libraries within clusters. After integration, this bias is largely eliminated. (b-b’) Comparison of the library contribution in each cluster before (merged) and after library integration (batch effect correction). With the exception of few clusters in each case, all clusters have a similar percentage of cells coming from each library. (c) Comparison of cluster sizes per library before (merged - n = 71 clusters) and after library integration (batch effect correction - n = 93 clusters). The variance in the merged dataset is larger than the one in the integrated one, indicating noise that was potentially alleviated by the batch correction. Boxplots display the first, second and third quartiles. Whiskers extend from the box to the highest or lowest values in the 1.5 inter-quartile range, and outlying datapoints are represented by a dot.
Extended Data figure 2:
Extended Data figure 2:. Annotation of the developing optic lobe UMAP plot
(a) UMAP plots showing the expression of different cell type markers that allows for the annotation of the different clusters. Shotgun/DE-Cad (shg) is expressed in the neuroepithelium (NE) and young neuroblasts (NBs). Deadpan (dpn) is expressed in neuroepithelium and neuroblasts. Asense (ase) is expressed in the neuroblasts and GMCs. Elav is mostly expressed in the neurons, although the transcript can already be seen in the GMCs. Finally, repo is expressed in glial cells. (b) UMAP plot of single-cells coming from larval (L3) and pupal (P15) developing optic lobes. Using cell type annotation, we identify cell types that belong to the four optic lobe neuropils (lamina, medulla, lobula, and lobula plate), as well as central brain cells that were not removed during the dissections, and glial cells. (c) Expression of markers for the lamina and the lobula plate. Lamina is marked by the expression of gcm, eya, sim, tll, and dac, while lobula plate expresses strongly acj6, faintly dac, and the progenitors (neuroblasts and GMCs) express tll. (d) (Top) UMAP: Spatial transcription factors (Vsx, Optix, and Rx) are not expressed in medulla neuroblasts (NBs), while only Vsx is expressed in some neuronal types (it is unknown whether this expression reflects their origin from the Vsx spatial domain). (Inset) sTFs are only expressed in the neuroepithelium (NE) in largely non-overlapping domains. (Bottom). UMAP plots with the expression of individual sTFs in the neuroepithelium. (e) UMAP plot of the neuroepithelial cells. Top: Expression of the spatial transcription factors (Vsx1, Optix, and Rx) can be seen in largely non-overlapping clusters. Bottom: Semi-supervised clustering of the neuroepithelial cells and identification of the three spatial clusters (Vsx, Optix, and Rx).
Extended Data figure 3:
Extended Data figure 3:. Candidate tTF expression in neuroblast trajectory
Expression pattern over pseudotime of all TFs that were found to be expressed in a temporal manner along the medulla neuroblast trajectory. (a) 14 transcription factors were found to be expressed temporally in high relative expression levels. These include the already known tTFs (hth, ey, slp1, slp2, D, and tll in purple), as well as eight new candidate tTFs (in green). (b) Another 25 transcription factors were found to be expressed temporally in lower relative expression levels. Ap, ct, gcm, and gem expression were tested in developing optic lobes and they were not expressed temporally. Hence, these 25 transcription factors were excluded from downstream analysis. (c) Gcm-Gal4 (green) is expressed in glial cells coming from the Tll temporal window (magenta). Scale bar: 10 μm. (d) Cut-Gal4 (green) is expressed in neuroblasts of all ages found in the surface of the optic lobe (arrow). Scale bar: 10 μm.
Extended Data figure 4:
Extended Data figure 4:. Newly identified tTFs are expressed temporally
(a) Antibody staining (frontal view) against five of the eight new temporal transcription factors, Opa (red), Erm (blue), Hbn (green), Scro (white), and BarH1 (green), shown in different combinations. (b) Antibody staining against Opa, Hth, Ey, and Arm (which marks all cells). Opa is expressed in two waves, one succeeding and partially overlapping with the Hth window and one later partially overlapping with Ey. The expression of Opa covers the previous “gap” between Hth- and Ey-expressing neuroblasts. (c) Antibody staining against Erm and Ey. Erm starts being expressed before Ey, partially overlapping with it (magenta arrowheads). (d) Antibody staining against Hbn and Ey. Hbn expression begins slightly after Ey and overlaps almost completely with it. Ey-positive, Hbn-negative neuroblasts are indicated with arrowheads. (e) Antibody staining against Oaz and D. Oaz expression precedes the expression of D. (f) Antibody staining against Dpn, Oaz, BarH1, and Arm (which marks all cells). BarH1 is expressed after Oaz. (g) Antibody staining against BarH1 and Tll. BarH1 is expressed before and overlaps with Tll. (h) Fluorescent in situ hybridization against dpn, Oaz, BarH1 and BarH2. BarH2 is expressed in the same neuroblasts as BarH1, after Oaz has stopped being expressed. Hoechst marks all cells. (i) Hbn is expressed between the two Opa temporal windows in neurons, while BarH1 is expressed after the second Opa temporal window. Hbn is also expressed in later born neurons, after the second Opa wave, and is lost from the first lamina (in between Opa) as neurons mature. Scale bars: 10 μm
Extended Data figure 5:
Extended Data figure 5:. Negative genetic interactions between tTFs
(a) Diagram of genetic interactions between tTFs in medulla neuroblasts. Red “X”‘s within the diagram indicate no genetic interaction. Within the early unit (green box), we identified three new tTFs: Opa, Erm and Oaz. Hth does not activate Erm or Opa. Furthermore, Opa does not repress Hth or activate Erm. Within the middle unit (red box), we identified three new temporal factors: Homeobrain (Hbn), Scarecrow (Scro) and Opa. Opa is not inhibited by D or BarH1. Oaz is also not inhibited by D or BarH1. Within the late unit (blue box) we identified one new temporal factor: BarH1. Tailless (Tll) is not necessary to inhibit BarH1. (b) In cells expressing hth RNAi driven by Vsx-Gal4 (GFP: green), Opa expression is not affected, indicating that Hth does not activate Opa. (c) Erm is unaffected in cells expressing hth RNAi driven by Vsx-Gal4 (GFP: green). Hence, Hth does not activate Erm. (d) In opa mutant clones (GFP: green), Hth and Erm expression are unaffected, indicating that Opa does not inhibit Hth and does not activate Erm. (e) In opa mutant clones (GFP: green), Ey expression is delayed, indicating that Opa helps to time the expression of Ey. (f-j) In cells expressing Oaz RNAi driven by Vsx-Gal4 (GFP: green), (f) Hth, Ey, Slp, (g) Opa, (h) Erm, Hbn, Tll, (i) Scro, D, and (j) BarH1 are unaffected, indicating that Oaz does not regulate their expression. (k) Scro knock-down upon expression of scro RNAi (GFP: green) does not affect the expression of Hbn or Slp, as was expected given that Scro is coexpressed with both (see Figure 2). (l) In negatively marked D mutant clones, the expression of Opa is unaffected, indicating that D does not inhibit Opa. (m) Similarly, in negatively marked D mutant clones, the expression of Oaz is unaffected, indicating that D does not inhibit of Oaz. (n) In Tll mutant clones (GFP: green), neither D nor BarH1 expression are affected, indicating that Tll is not necessary to inhibit either factor. (o-q) In cells expressing RNAi against BarH1, (o) Opa, (p) Oaz, and (q) D are unaffected, indicating that BarH1 does not regulate their expression. Scale bars: 10 μm
Extended Data figure 6:
Extended Data figure 6:. Additional genetic interactions between tTFs
(a) Diagram of genetic interactions between tTFs in medulla neuroblasts. Magenta dashed arrows within the diagram indicate genetic interactions determined with misexpression of tTFs that confirm previous results from MARCM and knock-down experiments. Orange dashed arrows indicate genetic interactions uncovered with misexpression experiments. Blue dashed arrows indicate genetic interactions determined with misexpression experiments that are opposite to previous MARCM or knock-down experiments. (b) Left: In opa mutant clones (GFP: green), Oaz is not expressed, suggesting that Opa is necessary for the activation of Oaz. Right: Accordingly, oaz neurons are lost in opa mutant clones. (c) Slp inhibits the expression of Oaz. In slp mutant clones (GFP: green), Oaz remains expressed in older neuroblasts. (d) In cells misexpressing Hth driven by Vsx-Gal4 (GFP: green), Erm expression is not affected, indicating that Hth does not activate Erm. (e) In cells misexpressing Hth driven by Vsx-Gal4 (GFP: green), Opa expression is not affected, indicating that Hth does not activate Opa. (f) In cells misexpressing Ey driven by Vsx-Gal4 (GFP: green), Hbn expression is activated and Scro expression repressed. (g) In cells misexpressing Hbn driven by Vsx-Gal4 (GFP: green), Slp expression is not activated earlier. White arrowhead indicates low levels of Hbn protein being misexpressed early compared to adjacent wildtype tissue. (h) In cells misexpressing Scro driven by Vsx-Gal4 (GFP: green), D expression is not activated earlier. White arrowhead indicates low levels of Scro protein being misexpressed early compared to adjacent wildtype tissue. (i) In cells misexpressing D driven by Vsx-Gal4 (GFP: green), both Scro and BarH1 expression are repressed. (j) In cells misexpressing Tll driven by Vsx-Gal4 (GFP: green), both D and BarH1 expression are repressed. Scale bars: 10 μm
Extended Data figure 7:
Extended Data figure 7:. Temporal transcriptions factors are inherited in neurons and regulate neuronal diversity
(a) UMAP plots showing the expression of all temporal transcription factors in the developing Drosophila optic lobe. (a) Hth maintains its expression in some of their neuronal progeny, such as Mi1, Pm1, and Pm2. (a’) On the other hand, ey, D, erm and Scro not only maintain their expression in some neuronal progeny, but they are also activated independently in neuronal types that come from different temporal windows. Hence, most of them are expressed in both early- and late-born neuronal types (see also Supplementary Table 1). (a’’) Slp1, opa, BarH1, Oaz, and tll do not maintain their transcription in neurons. However, using their expression in GMCs at the root of neuronal branches, we can predict neuronal types that come from these temporal windows (such Tm1, Tm2, and Tm4 for Opa). (a’’’) Finally, hbn is not maintained in neuronal progeny of the Hbn+ neuroblasts, but it is activated independently in later-born neurons (such as T1). Neuronal types that come from the relevant temporal windows are indicated. (b) Expression of temporal transcription factors in neuronal progeny shows that the tTFs are expressed in the newly born progeny of their respective neuroblast temporal window. Time is depicted by the arrow; neurons born from young neuroblasts are on the top of the Figure. Opa-positive neurons are born from young neuroblasts (red), followed by Erm neurons (green). Then, neurons expressing Hbn and Opa can be detected. (red-white). Finally, Scro-positive (blue) and Scro and BarH1-positive neurons (blue-white) are born from older neuroblasts. Single-channel images can be seen in the right panels. (c) Hbn is involved in the generation of neuronal diversity by regulating the expression of downstream transcription factors. In Hbn-mutant MARCM clones (green) neurons expressing Toy, Otd (c) and Tj (c’) are not found. (d) Opa is also involved in the generation of neuronal diversity by regulating the expression of the downstream transcription factor TfAP-2 in some neurons. Opa-mutant MARCM clones (green) have fewer TfAP-2 positive cells (magenta) compared to the adjacent wild-type tissue. Scale bars: 10 μm
Extended Data figure 8:
Extended Data figure 8:. Temporal expression of concentric genes in medulla neurons
(a) Temporal expression of concentric genes in the medulla cortex. (i-i’’’) Expression (from early to late born) of Bsh, Run, Vvl, Toy and Slp in medulla neurons at L3 stage. Bsh neurons are closer to the medulla neuropil (indicated with dashed line), while Slp neurons (arrowhead) are closer to the surface of the brain (NB layer). Anterior is shown to the right and posterior to the left throughout the Figure. (ii-ii’’’) Expression of Hth, Svp and Toy in medulla neurons at L3 stage. Hth is expressed in the first-born neurons, located closer to the medulla neuropil. Svp is expressed in several laminae along the medulla cortex. Toy is expressed in mid-late born neurons. (iii-iii’’’) Expression of Svp, Forkhead domain 59A (Fd59A) and Hbn in medulla neurons at L3 stage. Svp is expressed in several laminae along the medulla cortex. Fd59A is expressed in mid-late born neurons, some of them (magenta arrowheads) generated before Hbn neurons. Cyan arrowheads denote Lawf1-2 neurons, which have a different origin. (iv-iv’’’) Expression of Tup, Knot (Kn), and Toy in medulla neurons at L3 stage. Tup is expressed in several laminae of early and late born neurons along the medulla cortex, some of them being born before Kn neurons (iv’). Tup+Toy neurons are the first-born Toy neurons in the ventral side of the medulla (iv’’, arrowhead). Kn neurons are generated before Kn+Toy neurons (iv’’’, arrowhead). (v-v’’’) Expression of Toy, Fkh:GFP and Otd in medulla neurons at L3 stage. Some Toy neurons are generated before Fkh and Otd neurons (E’-E’’). Fkh+Otd neurons (arrowhead) are only found in the posterior tips of the main OPC (E’’’), mainly in the Dpp region, as previously described. (vi-vi’’’) Expression of Toy, Fd59A and Ets65A:GFP in medulla neurons at L3 stage. Toy and Fd59A expressing neurons are intermingled in the medulla cortex, being coexpressed in specific subregions of the medulla cortex (vi’, arrowheads). Many Toy and Fd59A neurons are generated before Ets65A-expressing neurons (vi’’-vi’’’). (vii) Expression of TfAP-2 and Run in medulla neurons at L3 stage. The first laminae of TfAP-2+Ap+ neurons (NotchON) are intermingled with Run neurons (NotchOFF) (arrowheads), suggesting that they could be sister neurons. (viii) Expression of TfAP-2 and Vvl in medulla neurons at L3 stage. The first laminae of TfAP-2 neurons are generated before Vvl neurons. The second laminae of TfAP-2 neurons are generated after some Vvl neurons. (ix) Expression of TfAP-2 and Toy in medulla neurons at L3 stage. The first laminae of TfAP-2 neurons are generated before Toy neurons. The second laminae of TfAP-2 neurons are intermingled with some Toy neurons. (x) Expression of TfAP-2 and Ets65A:GFP in medulla neurons at L3 stage. All TfAP-2 neurons are born before Ets65A-expressing neurons, except in the cases where both TFs are coexpressed (arrowhead). These neurons are very late born and are the only NotchON medulla neurons that are glutamatergic. (xi) Expression of Vvl and Kn in medulla neurons at L3 stage. Vvl+Ap+ (NotchON) and Kn neurons (NotchOFF) start to be generated at similar times, suggesting that they could be sister neurons. (xii) Expression of Toy and Sox102F in medulla neurons at L3 stage. Toy and Sox102F neurons are mid-late born neurons intermingled in the medulla cortex. Toy and Sox102F are expressed individually or coexpressed in medulla neurons. (xiii) Expression of Toy and Tj in medulla neurons at L3 stage. Toy and Tj neurons are expressed in mid-late born neurons intermingled in the medulla cortex. They are coexpressed in specific subregions of the medulla cortex (arrowhead). (xiv) Expression of Toy and Hbn in medulla neurons at L3 stage. Hbn neurons are generated after some Toy neurons. Scale bars: 10 μm (b) Concentric genes expressed both early and late in medulla neurons. (i) TFs Seven-Up (Svp), (ii) TfAP-2 and (iii) Tailup (Tup) are expressed in several laminae along the medulla cortex and are expressed in neurons generated in several temporal windows. (c) Notch status of medulla neurons and concentric gene expression. (i) Expression of Bsh and Ap in medulla neurons. All Bsh neurons express Ap. Anterior is to the right and posterior to the left in this and subsequent panels. (ii) Expression of Run and Ap in medulla neurons at L3 stage. None of the Run positive neurons express Ap. (ii’) Expression of Ap and Svp in medulla neurons at L3 stage. None of the Svp positive neurons express Ap. (ii’’) Expression of Ap and Fd59A in medulla neurons at L3 stage. None of the Fd59A positive neurons express Ap. (ii’’’) Expression of Ap and Hbn in medulla neurons at L3 stage. None of the Hbn positive neurons express Ap. (iii) Expression of Ap and Vvl in medulla neurons at L3 stage. Vvl neurons that are earlier born, such as Tm9, express Ap (white arrowhead), while later born Vvl neurons, such as Dm8 and Dm11, do not (magenta arrowhead). (iii’) Expression of Ap and Toy in medulla neurons at L3 stage. Earlier born Toy neurons, such as Dm10, do not express Ap (magenta arrowhead), while later born Toy neurons, such as Tm20, express Ap (white arrowhead). (iii’’) Expression of Ap and TfAP-2 in medulla neurons at L3 stage. First born TfAP-2 neurons, such as Pm1, Pm2 and Pm3, do not express Ap (magenta arrowheads), while later born TfAP-2-expressing neurons, such as Tm1, express Ap (white arrowhead). (iii’’’) Expression of Ap and D in medulla neurons at L3 stage. Earlier born D neurons do not express Ap (magenta arrowhead) and express D in the absence of this tTF in their NBs of origin, while later born D neurons express Ap (white arrowhead) and are generated in the D temporal window. (iii’’’’) Expression of Ap and Ets65A:GFP in medulla neurons at L3 stage. Earlier born Ets65A neurons do not express Ap (magenta arrowhead), while later born Ets65A neurons express Ap (white arrowhead). Scale bars: 10 μm (d) Medulla clusters. Hierarchical tree relating the average variable gene expression from each cluster of the L3-P15 dataset. Low quality (LQ) clusters or clusters that have a different origin from the medulla side of the OPC neuroepithelium, such as PRs, L neurons, Lawf1-2, LCNs and LPLCs neurons are shown in red.
Extended Data figure 9:
Extended Data figure 9:. Neuronal differentiation in flies and humans
(a) Bsh is expressed almost exclusively in Mi1s and was used to identify the Mi1 clusters. Cluster Mi1 represents the pupal annotated cluster. Cluster L3_23 consists of GMCs that give rise to Mi1s and newly born Mi1s, while cluster L3_53 corresponds to more mature Mi1 cells, as assessed by their proximity to the P15 Mi1 cells. (b) UMAP plot of Mi1 cells at different stages of differentiation from L3 to P70. The expression of ase (b) and bsh (b’) were used to find the beginning and end, respectively, of the L3 trajectory. (c) UMAP plot of Mi1 cells at different stages of differentiation from L3 to P70. L3 and P15 trajectories are elongated, depicting Mi1 cells of different ages. Transcriptomes are then synchronized (compact group of clusters) around P30. (d) UMAP plot showing the trajectory of 3,363 single cell transcriptomes of the developing human cortex (gestational week 19), as generated by Monocle3. The orientation of the trajectory was identified by looking at the expression of marker genes for progenitors, intermediate progenitors and neurons (see panel f). Colors indicate different clusters along the trajectory. (e) UMAP plot focusing on the PAX6-positive single-cell transcriptomes of the developing human cortex (gestational week 19). The radial glia population contains both ventricular radial glia (FBXO32-positive cells) and outer radial glia (HOPX-positive cells). (f) UMAP plot of 3,363 single-cell transcriptomes of the developing human cortex (gestational week 19). The trajectory from progenitors to neurons can be observed by the expression of Pax6 (apical progenitors), Eomes (intermediate progenitors), and NeuroD2 (neurons). The dashed arrow depicts the differentiation trajectory. (g) Differential expression analysis along the trajectory of the cortical neurons identified six modules of genes. Gene Ontology enrichment analysis found the first two modules to be enriched in terms such as cell proliferation (FDR=10−3) and DNA replication (FDR=10−44); they likely correspond to the progenitor cells. Then, the third module is enriched in neurite development terms, such as axon guidance (FDR=10−7), while the fourth one is enriched in terms related with synapse organization (FDR=10−11). The fifth one contains “functional genes”, such as calcium-dependent exocytosis (FDR=10−2). The sixth module does not show a clear peak of expression and no GO terms were found to be enriched.
Extended Data Figure 10:
Extended Data Figure 10:. Expression of Drosophila tTFs in mouse neural progenitors
(a) The mouse orthologs of the Drosophila optic lobe temporal transcription factors are not expressed in specific temporal windows in mouse cortical radial glia during embryonic stages E12-E15, which span their neurogenic period, except for Pax6, which is enriched in young progenitors (two-sided Wilcoxon rank sum test, adjusted p-value = 1.969240e-08). (b) Heatmap of expression of Igf2bp1 and Bach2 (orthologs of Drosophila Imp and chinmo, respectively) in radial glia and neuronal progeny. Igf2bp1 is expressed in young apical progenitors, while Bach2 is expressed in young apical progenitors and neurons that are born by these young progenitors. Source: http://genebrowser.unige.ch/telagirdon/ (c) Violin plots showing the expression of the known temporal factors of the mouse retinal progenitor cells, Ikzf1, Pou2f2 and Casz1, orthologs of the Drosophila VNC temporal transcription factors, hb, pdm and cas, respectively. Pou2f2 is expressed in younger progenitors and Casz1 in older progenitors. We do not see expression of Ikzf1 at these stages, as has been reported before. (d) Violin plots showing the expression of the orthologs of the Drosophila optic lobe tTFs in the mouse retinal progenitor cells. The expression of the orthologs of hth (Meis2), opa (Zic5), and D (Sox12) seem to be restricted to embryonic stage 12, while the ortholog of ey (Pax6) is expressed constitutively, as expected. Interestingly, Nr2e1 is expressed just before birth, which is when the retinal progenitor cells start generating Müller glia ortholog; similarly, its ortholog tll also starts to be expressed when the Drosophila medulla neuroblasts become gliogenic.
Figure 1.
Figure 1.. Single-cell sequencing of the developing Drosophila larval optic lobe.
(a) Schematic of the Drosophila L3 brain. The neuroepithelium is converted to lamina precursor cells (LPCs) laterally, and into medulla neuroblasts medially, in a wave of neurogenesis (youngest neuroblasts are closer to the neuroepithelium). As neuroblasts age, they produce different neuronal types (filled circles: NotchON, outlined circles: NotchOFF neurons). The dashed arrow points from young to old neurons. (b) UMAP plot of ~70,000 single-cell transcriptomes from the integrated L3 and P15 optic lobe dataset. The arrows depict differentiation trajectories (medulla: black solid arrow, lamina: dashed arrow, lobula plate: brown arrow). GMCs form an hourglass (left red arrow) with reduced transcriptomic diversity. A similar hourglass is observed in the transition from neuroepithelium to neuroblasts (right red arrow). The dashed box contains neuroblasts and GMCs shown in d. (c) Same UMAP plot as in b with L3 (pink) and P15 datasets (cyan) labeled. (d) Close-up of the UMAP plot showing neuroblasts and GMCs. The previously described temporal factors are expressed in partially overlapping sets of neuroblasts organized in the plot from bottom to top (dashed arrow). A row of neuroblasts that do not express a known tTF (arrowhead), succeeds the hth-positive neuroblasts. (e) Temporal expression of previously known (purple) and candidate (green) tTFs along the neuroblast developmental trajectory. Heatmap colors represent scaled expression along the trajectory. (f-l) Immunostainings of newly identified (green) and previously known (purple) tTFs. (f) Opa:V5 is expressed in two waves, one after Hth (arrowhead) and one before Slp (arrow). (g) Oaz is expressed after Hth (arrowhead) and until Slp (arrow). (h) Erm is expressed after Hth. (i) Esg is expressed in a salt-and-pepper manner within the Ey window. (j) Hbn is expressed before Slp. (k) Scro is expressed after Ey (arrowhead). (l) BarH1 is expressed after D (arrowheads). Arrows and arrowheads point to overlapping expression. Scale bars:10 μm
Figure 2.
Figure 2.. Complex genetic interactions between tTFs control the progression of the temporal series.
(a) The temporal series is subdivided into three units (early: green, middle: red and late: blue) by previously identified (purple) and new (green) tTFs. (b) In erm MARCM mutant clones (GFP: green), Hth is extended and Ey is lost. (c) In opa MARCM mutant clones (GFP: green), Erm is unaffected and Ey expression is delayed. (d) In erm MARCM mutant clones (GFP: green), Opa is extended. (e) Negatively labeled ey MARCM mutant clones (GFP-negative) express Erm beyond its temporal window. (f) ey MARCM mutant clones (GFP-negative) express Opa beyond its temporal window. (g) In ey MARCM mutant clones (GFP-negative), Hbn expression is lost. (h) In hbn MARCM mutant clones (GFP: green), Ey expression is extended, while Slp expression is lost. (i) In hbn MARCM mutant clones (GFP: green), Erm is expanded and Scro expression is lost. (j) The second Opa expression window is lost in hbn mutant clones (GFP: green). (k) Cells expressing scro RNAi (GFP+: green; scro−) continue to express Ey into later temporal windows. (l) In slp MARCM mutant clones (GFP: green) Hbn expression is extended without affecting Scro,. (m) In slp MARCM mutant clones (GFP: green), Opa extends to later temporal windows. (n) Left: In neuroblasts expressing scro RNAi (GFP+: green), D expression is lost. Right: Neurons coming from the D temporal window express D (green bracket). In the absence of Scro, D is no longer expressed (red bracket). Wild-type (green asterisk) and scro-RNAi expressing neuroblasts (D-, red asterisk) can be found in the surface. (o) In negatively marked D mutant clones (GFP-negative), BarH1 expression is lost and Scro expression is unaffected. (p) In comparison to wild-type NBs (red asterisk), NBs expressing BarH1 RNAi (GFP: green) (green asterisk) do not express Tll. Genetic interactions uncovered in each experiment are shown for each panel. Scale bars: 10 μm
Figure 3.
Figure 3.. Temporal window of origin and birth order of medulla neurons
(a) Left: Frontal view of L3 medulla NBs sequentially expressing the indicated tTFs. Right: Schematic of tTF expression as medulla neuroblasts age, based on immunostaining. Dashed lines represent predicted temporal windows. (a’) Left: Sagittal section of L3 medulla cortex showing the expression of the concentric genes Bsh, Run, Vvl and Toy, and the tTF Slp. Early born neurons are located closer to the medulla neuropil, while later born neurons are farther. Right: Schematic of concentric gene expression in medulla neurons activated and maintained through different temporal windows. (b) Sagittal sections of optic lobes showing the expression of concentric genes at L3 stage. Anterior is to the right and posterior to the left. Earlier born neurons are located closer to the medulla neuropil (dashed crescent). Early, middle and late subdivisions are based on the predicted temporal windows when a given concentric gene starts to be expressed. Medulla neurons that express the corresponding concentric gene are indicated below each panel. Tj (ix) and Fork head (Fkh:GFP) (x) expression is restricted to specific regions of the medulla cortex. Hbn (xii) is also expressed in lamina wide-field neurons (Lawf1-2, arrowheads) that originate from the Dpp regions of the lamina neuroepithelium and migrate along the medulla neuropil. Dll (xiv) is also expressed in medulla neuropil glia (mng, arrowhead). (c) UMAP plot showing differently colored medulla clusters from the P15 dataset indicating groups that share concentric gene expression within a given temporal window. Cluster identity is indicated when known. (d) Schematic representing tTF expression in medulla NBs and GMCs and downstream concentric gene expression in neurons. Neurons and glia predicted to be generated in each temporal window are indicated. Neurons sharing the same Notch status generated in the same temporal window express the same neurotransmitter (NT). Scale bar: 10 μm
Figure 4.
Figure 4.. Neuronal differentiation in flies and humans
(a) Average expression of genes belonging to different Gene Ontology (GO) terms during the differentiation trajectory of Mi1 neurons. DNA replication is enriched at the beginning of the trajectory, followed by ribosome assembly and translation-related terms. Then, terms involved in neurite development and neuropil targeting, such as dendrite development and axon guidance, are enriched and peak around P15 and P30. Neuronal function terms, such as regulation of membrane potential and neurotransmission start to be upregulated as early as L3, reach a plateau around P15, and increase drastically from P30. (b) Average expression of genes belonging to the Drosophila GO terms that were described in “a”, over pseudotime in human cortical neurons. The differentiation path is similar to Drosophila neurons, with the exception of ribosome assembly terms, which are not enriched in human cortical neurons. (c) UMAP plots containing L3 and P15 single cells showing the developmental progression in Mi1s neurons (top – dashed arrows), which is similar for all optic lobe neurons (bottom), including lamina and lobula plate neurons. Ribosome assembly, axon guidance and regulation of membrane potential terms are sequentially upregulated. (d) UMAP plot showing the expression of ChAT (green), VGlut (blue), and Gad1 (red), as markers for cholinergic, glutamatergic, and GABAergic cells, respectively, in medulla (brown), lamina (purple) and lobula plate (orange) neurons. These transcripts are already detected in cells at L3 stage. (e) Immunostaining of VGlut (purple), ChAT (white) and Elav (green), in the developing Drosophila central nervous system at L3 stage. Neurons in the medulla (dashed line, m) express Elav (green) but do not express VGluT or ChAT protein in the neuropil (n), although the transcripts are present at this stage. However, VGlut and ChAT are expressed in the projections of mature larval neurons (also marked by Elav) of the ventral nerve cord (arrow). Scale bar:20 μm.

References

    1. Pearson BJ & Doe CQ Specification of temporal identity in the developing nervous system. Annual review of cell and developmental biology 20, 619–647 (2004). - PubMed
    1. Sato M, Yasugi T & Trush O Temporal patterning of neurogenesis and neural wiring in the fly visual system. Neuroscience Research 138, 49–58 (2019). - PubMed
    1. Doe CQ Temporal Patterning in the Drosophila CNS. Annual review of cell and developmental biology 33, 219–240 (2017). - PubMed
    1. Azevedo FAC et al. Equal numbers of neuronal and nonneuronal cells make the human brain an isometrically scaled-up primate brain. The Journal of comparative neurology 513, 532–41 (2009). - PubMed
    1. Rossi AM, Fernandes VM & Desplan C Timing temporal transitions during brain development. Curr Opin Neurobiol 42, 84–92 (2017). - PMC - PubMed

Online references

    1. Davis FP et al. A genetic, genomic, and computational resource for exploring neural circuit function. eLife 9, (2020). - PMC - PubMed
    1. Naidu VG et al. Temporal progression of Drosophila medulla neuroblasts generates the transcription factor combination to control T1 neuron morphogenesis. Developmental biology 464, 35–44 (2020). - PMC - PubMed
    1. Stoeckius M et al. Cell Hashing with barcoded antibodies enables multiplexing and doublet detection for single cell genomics. Genome biology 19, 224 (2018). - PMC - PubMed
    1. Southall T et al. Cell-type-specific profiling of gene expression and chromatin binding without cell isolation: Assaying RNA pol II occupancy in neural stem cells. Developmental Cell 26, 101–112 (2013). - PMC - PubMed
    1. Gold KS & Brand AH Optix defines a neuroepithelial compartment in the optic lobe of the Drosophila brain. Neural development 9, 18 (2014). - PMC - PubMed

MeSH terms